Tea Tree Oil Treatments Market Size and Share Forecast Outlook 2025 to 2035

The global Tea Tree Oil Treatments Market is expected to record a valuation of USD 1,285.9 million in 2025 and USD 3,972.1 million in 2035, with an increase of USD 2,686.2 million, which equals a growth of nearly 209% over the decade. The overall expansion represents a CAGR of 11.9% and more than a 3X increase in market size.
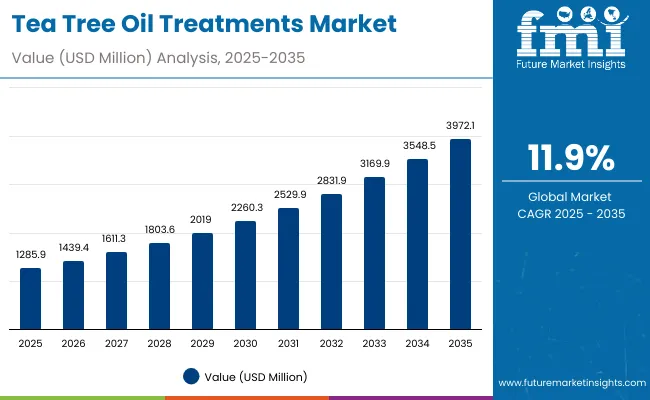
Quick Stats for Global Tea Tree Oil Treatments Market

  • Tea Tree Oil Treatments Market Value (2025): USD 1,285.9 million
  • Tea Tree Oil Treatments Market Forecast Value (2035): USD 3,972.1 million
  • Tea Tree Oil Treatments Market Forecast CAGR: 11.9%
  • Leading Segment in Global Tea Tree Oil Treatments Market in 2025: Acne/blemish care (59.6%)
  • Key Growth Regions in the Global Tea Tree Oil Treatments Market: India, China, Japan
  • Top Key Players in Global Tea Tree Oil Treatments Market: The Body Shop, Thursday Plantation, Desert Essence, A’kin, Paul Mitchell, Dr. Organic, Innisfree, Jason Natural, NOW Foods, Himalaya

Tea Tree Oil Treatments Market

Global Tea Tree Oil Treatments Market Key Takeaways

Metric Value
Global Tea Tree Oil Treatments Estimated Value in (2025E) USD 1,285.9 million
Global Tea Tree Oil Treatments Forecast Value in (2035F) USD 3,972.1 million
Forecast CAGR (2025 to 2035) 11.9%

During the first five-year period from 2025 to 2030, the market increases from USD 1,285.9 million to USD 2,260.3 million, adding USD 974.4 million, which accounts for 36% of the total decade growth. This phase records steady adoption across acne/blemish care treatments, anti-inflammatory serums, and oil-control cleansers, driven by the rising demand for natural anti-acne skincare. Cleansers dominate this period as they cater to over 47% of the consumer applications, making tea tree oil-based face washes and foaming cleansers a daily essential in acne-prone skincare routines.

The second half from 2030 to 2035 contributes USD 1,711.8 million, equal to 64% of total growth, as the market jumps from USD 2,260.3 million to USD 3,972.1 million. This acceleration is powered by widespread consumer preference for clean-label and vegan skincare, growth in Ayurvedic-inspired innovations, and a sharp rise in e-commerce-driven adoption. By the end of the decade, vegan and Ayurvedic claims together capture a larger share above 45%, while e-commerce as a channel surpasses other retail channels in growth momentum. Software analogies in beauty (skin diagnostic apps, AR-based try-ons) integrated with tea tree oil products also create recurring revenue for top brands through subscription beauty kits and digital-first retail ecosystems.

From 2020 to 2024, the global Tea Tree Oil Treatments Market grew steadily, driven by hardware-equivalent growth in product launches focusing on cleansers, serums, and acne spot treatments. During this period, the competitive landscape was dominated by heritage brands like The Body Shop and Thursday Plantation, controlling nearly 10% of revenue. Competitive differentiation relied heavily on consumer trust in natural positioning, anti-acne efficacy, and dermatologist endorsements, while Ayurvedic-inspired lines were still in a nascent stage. Vegan and clean-label claims accounted for less than 20% of market share, as consumer awareness was building gradually.

Demand for tea tree oil skincare expands sharply from 2025 onward, with revenue expected to cross USD 1,285.9 million in 2025 and triple by 2035. The revenue mix shifts dramatically as natural/organic, vegan, and Ayurvedic-inspired claims grow to more than 55% share. Traditional skincare leaders face rising competition from K-beauty and clean beauty players like Innisfree and Dr. Organic, who offer integrated routines with multi-step acne kits. Major Western players pivot to hybrid models, integrating tea tree oil with salicylic acid, niacinamide, and probiotics to retain relevance among Gen Z and millennial users. Emerging entrants specializing in direct-to-consumer distribution, e-commerce subscriptions, and AR-based skin diagnostic platforms are rapidly gaining share. The competitive advantage is moving away from heritage positioning alone to an ecosystem of brand trust, digital presence, and recurring subscription-based skincare routines.

Why the Global Tea Tree Oil Treatments Market is Growing?

The global Tea Tree Oil Treatments Market is growing due to its strong reputation as a natural solution for acne and blemish care, coupled with rising consumer demand for clean-label and botanical-based beauty products. Advances in cosmetic formulations have allowed tea tree oil to be blended with modern actives such as niacinamide and hyaluronic acid, improving tolerance and appeal across sensitive skin types. This has improved efficacy while reducing irritation, allowing tea tree oil to transition from a niche natural extract into a mainstream skincare ingredient.

Acne/blemish care dominates demand, as tea tree oil’s antimicrobial and anti-inflammatory properties make it one of the most researched essential oils for acne treatment. The segment benefits from rising cases of adult acne, mask-related breakouts (maskne), and stress-related skin issues. Expansion of oil-control and soothing products, particularly in serums and spot treatments, has also boosted growth.E-commerce has significantly accelerated market penetration by enabling D2C brands to reach global consumers, often with affordable and trial-sized products. Social media platforms like Instagram, TikTok, and YouTube have become influential in driving consumer education about tea tree oil’s benefits, with dermatologists and beauty influencers endorsing its efficacy.

The segmental growth is expected to be led by acne/blemish care within function, cleansers within product type, and natural/organic within claims. Collectively, these pillars highlight tea tree oil’s role as a natural but science-backed anti-acne hero ingredient, ensuring it remains relevant in both Western and Asian beauty routines.

Segmental Analysis

The global Tea Tree Oil Treatments Market is segmented by function, product type, channel, claim, and region. Function includes acne/blemish care, anti-inflammatory, oil control, and soothing, highlighting the primary skin concerns addressed by tea tree oil formulations. Product type segmentation covers serums, creams/lotions, cleansers, and spot treatments, representing the core delivery formats through which tea tree oil is incorporated into daily skincare routines. Distribution channels include e-commerce, pharmacies, mass retail, and specialty beauty stores, reflecting both traditional and digital sales pathways. Claims encompass natural/organic, vegan, clean-label, and Ayurvedic-inspired, underscoring the evolving consumer priorities for authenticity, sustainability, and holistic health. Regionally, the scope spans North America, Latin America, Europe, Asia-Pacific, and the Middle East & Africa, with India, China, and Japan showing the fastest growth over the forecast period.
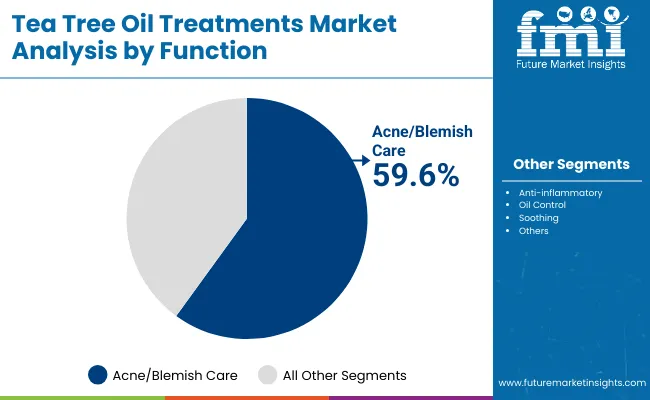
Insights into the Function Segment with Acne/Blemish Care Leading in Market Share

Tea Tree Oil Treatments Market By Function

Function Value Share% 2025
Acne/blemish care 59.6%
Others 40.4%

The acne/blemish care segment is projected to contribute nearly 60% of the global Tea Tree Oil Treatments Market revenue in 2025, making it the dominant function category. The segment’s strength lies in tea tree oil’s antimicrobial and anti-inflammatory properties, which are widely recognized as effective in targeting acne-causing bacteria, reducing redness, and promoting clearer skin. Demand is bolstered by the rising prevalence of acne across both teenagers and adults, especially in urban markets where pollution and stress contribute to skin breakouts.

This dominance is further supported by the popularity of tea tree oil-based foaming cleansers, spot treatments, and targeted acne serums, which are perceived as natural yet effective alternatives to harsher chemical-based treatments. In emerging markets such as India and China, tea tree oil acne solutions are often positioned alongside Ayurvedic or herbal claims, boosting cultural acceptance. As dermatologists and influencers continue endorsing tea tree oil for acne management, the segment is expected to retain its leading position throughout the forecast period.
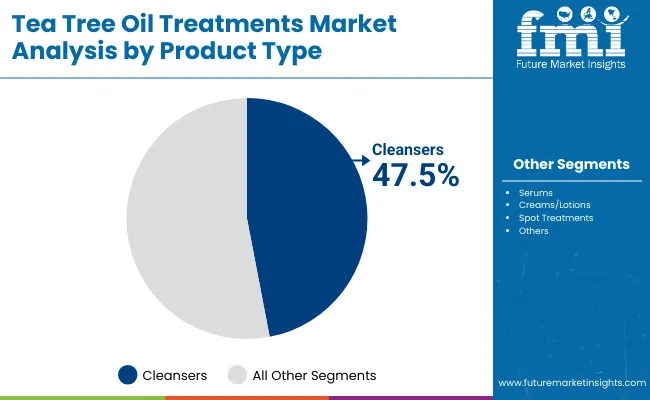
Insights into the Product Type Segment with Cleansers Dominating the Demand

Tea Tree Oil Treatments Market By Product Type

Product Type Value Share% 2025
Cleansers 47.5%
Others 52.5%

Cleansers are forecasted to hold nearly half of the global Tea Tree Oil Treatments Market share in 2025, establishing themselves as the leading product type. Cleansers formulated with tea tree oil are especially popular among consumers with oily and acne-prone skin, as they provide daily antibacterial protection while helping to regulate sebum production. Their wide accessibility in both premium and mass retail outlets reinforces this segment’s growth trajectory.

The segment’s rise is also fueled by innovations in gel-based face washes, micellar water, exfoliating scrubs, and wipes, which have expanded usage occasions from routine cleansing to on-the-go skin refreshment. With recurring daily use, cleansers represent one of the most consistent and replenishable purchase categories in tea tree oil skincare. The integration of multifunctional benefits, such as 2-in-1 cleanser + mask or cleanser + exfoliating hybrid formats, ensures ongoing consumer engagement and sustained revenue generation for brands.
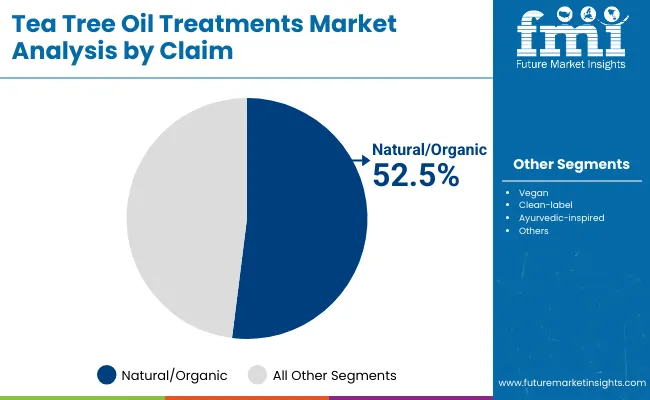
Insights into the Claim Segment with Natural/Organic Leading

Tea Tree Oil Treatments Market By Claim

Claim Value Share% 2025
Natural/organic 52.5%
Others 47.5%

The natural/organic segment is projected to account for more than 52% of the global Tea Tree Oil Treatments Market revenue in 2025, making it the leading claim type. This dominance reflects the strong consumer association of tea tree oil with botanical purity, safety, and sustainability. As clean beauty trends accelerate, consumers are increasingly seeking out products with transparent ingredient lists, eco-conscious packaging, and certifications validating natural origins.

Natural/organic claims also align with regional market trends. In North America and Europe, clean-label positioning enhances brand credibility, while in Asia-Pacific, particularly India, Ayurvedic-inspired marketing often overlaps with natural claims, creating a dual advantage. With consumers becoming more mindful about chemical additives and sustainability practices, the natural/organic segment is expected to remain the anchor claim, while vegan and Ayurvedic-inspired lines accelerate growth among younger and culturally attuned demographics.

What are the Drivers, Restraints, and Key Trends of the Global Tea Tree Oil Treatments Market?

Drivers

Rising Global Acne Prevalence and Preference for Natural Remedies

One of the strongest growth drivers for the global Tea Tree Oil Treatments Market is the rising prevalence of acne among both teenagers and adults, coupled with the shift toward natural alternatives. With acne/blemish care already accounting for 59.6% of the global market in 2025, tea tree oil’s scientifically supported antibacterial and anti-inflammatory properties make it an attractive solution. Unlike conventional acne treatments containing benzoyl peroxide or antibiotics, tea tree oil products are perceived as gentler, plant-based, and suitable for long-term use. This appeal resonates particularly well in markets like the USA and India, where awareness of natural skincare is high. In India and China, the association of tea tree oil with herbal and Ayurvedic positioning further strengthens consumer acceptance, especially among young urban populations who want modern solutions grounded in tradition. The rising incidence of adult acne, stress-related skin conditions, and “maskne” (mask-related acne) continues to drive repeat purchases across cleansers, serums, and spot treatments, making this the backbone of market expansion.

E-commerce and Digital Dermatology as Multipliers of Demand

E-commerce has become a central driver for the distribution of tea tree oil skincare, with D2C platforms and subscription models enabling global reach. Specialty beauty stores and pharmacies remain important, but online platforms are growing disproportionately faster, allowing niche and emerging brands to compete alongside global leaders like The Body Shop. The integration of AR try-on tools, dermatologist-led digital consultations, and subscription skincare boxes has amplified consumer confidence in buying acne treatments online. Influencer-led marketing on TikTok, Instagram, and YouTube has turned tea tree oil cleansers and spot treatments into viral products, especially among Gen Z. This driver is particularly pronounced in Asia-Pacific, where consumers rely heavily on mobile-first shopping experiences. By bridging education, access, and affordability, e-commerce and digital dermatology platforms are unlocking entirely new consumer bases and fueling double-digit CAGR across emerging markets like China (21.3%) and India (22.8%).

Restraints

Skin Irritation Risks and Perception of Limited Clinical Backing

While tea tree oil is widely praised for its natural antibacterial properties, it can also be irritating or sensitizing for certain skin types, especially when used in high concentrations. This creates skepticism among dermatologists and cautious consumers, particularly in mature markets like Germany and the USA, where clinical validation and dermatologist-tested claims carry significant weight. Unlike regulated actives such as salicylic acid or retinoids, tea tree oil is still perceived by some as a “home remedy” rather than a clinically proven treatment. This restraint limits penetration into premium dermocosmetic channels and slows down adoption among consumers who prefer evidence-based products. Without sustained R&D investment into controlled formulations, some consumers may hesitate to replace or supplement pharmaceutical acne treatments with tea tree oil-based solutions.

Fragmented Supply Chain and Price Volatility of Raw Material

The global Tea Tree Oil Treatments Market faces a structural restraint in the form of raw material volatility. Tea tree oil production is geographically concentrated, largely in Australia, which creates vulnerabilities in supply chain stability and pricing. Seasonal variations, climate conditions, and global shipping disruptions can lead to inconsistent quality and fluctuating costs. For mid-tier and mass-market players, these raw material uncertainties make it difficult to ensure stable product pricing, especially in cost-sensitive markets such as India. Moreover, smaller brands often struggle to maintain consistent sourcing and rely heavily on third-party suppliers, reducing their ability to standardize formulations. This creates a barrier to scaling operations globally, as inconsistent supply undermines both consumer trust and regulatory compliance across different regions.

Key Trends

Hybrid Formulations with Tea Tree Oil and Modern Actives

A key trend reshaping the global Tea Tree Oil Treatments Market is the shift from single-ingredient solutions to hybrid formulations that combine tea tree oil with modern actives such as salicylic acid, niacinamide, probiotics, or hyaluronic acid. This approach addresses one of the core restraints irritation risk while also improving product efficacy in line with consumer expectations for multi-functional skincare. Hybrid products not only appeal to acne sufferers but also to consumers seeking broader benefits such as oil control, soothing, and hydration. In the USA, brands are launching tea tree oil + salicylic acid cleansers, while in Asia-Pacific, Ayurvedic-inspired hybrids featuring tea tree oil with neem or turmeric are gaining traction. By blending natural purity with clinical performance, hybrid formulations are driving premiumization and category expansion across both mass retail and specialty channels.

Ayurveda and Herbal Positioning Driving Asian Growth

Another defining trend is the Ayurvedic-inspired positioning of tea tree oil skincare in Asia, particularly in India and China. With India’s CAGR forecasted at 22.8%, the highest globally, brands are increasingly integrating tea tree oil with other herbal ingredients in Ayurvedic-based product lines. This trend resonates strongly with consumers who view Ayurveda as both traditional and scientifically credible. Chinese consumers, meanwhile, are highly responsive to natural/organic and herbal claims, with 54.5% of China’s tea tree oil skincare market in 2025 already tied to natural/organic positioning. Ayurvedic-inspired formulations also align with the broader “East meets West” beauty philosophy, where heritage wellness systems are combined with modern packaging, e-commerce accessibility, and dermatologist endorsements. This trend is not only fueling domestic growth in Asia but also enabling Indian and Chinese brands to expand into international markets with culturally authentic offerings.
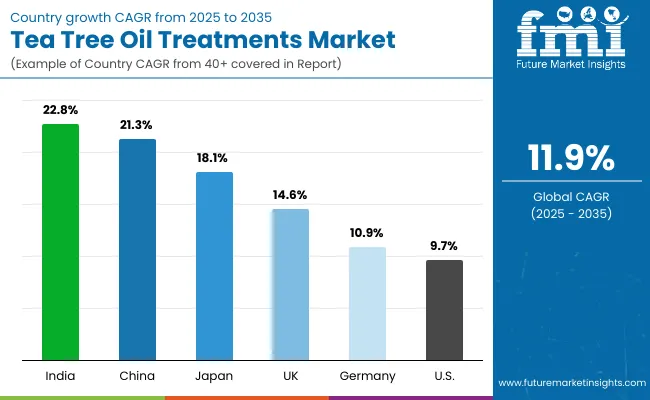
Analysis of Global Tea Tree Oil Treatments Market By Key Countries

Country Wise Tea Tree Oil Treatments Market

Countries Estimated CAGR (2025 to 2035)
China 21.3%
USA 9.7%
India 22.8%
UK 14.6%
Germany 10.9%
Japan 18.1%

Between 2025 and 2035, the global Tea Tree Oil Treatments Market is expected to expand most rapidly in India (22.8% CAGR) and China (21.3% CAGR), highlighting the rising importance of Asia-Pacific as the growth engine of this segment. In India, the surge is driven by strong demand for Ayurvedic-inspired formulations, increasing disposable incomes, and a younger consumer base that is highly responsive to natural and herbal beauty trends. China’s momentum is tied to its fast-evolving natural/organic skincare preferences, integration of tea tree oil into hybrid K-beauty and C-beauty routines, and the dominance of e-commerce channels that make international and local tea tree oil brands easily accessible. Japan (18.1% CAGR) also stands out, where consumers value tea tree oil for its oil-control and soothing benefits, aligning well with minimalist, functional skincare regimens that focus on gentle yet effective daily-use products.

On the other hand, mature Western markets show more moderate growth. The USA (9.7% CAGR) remains one of the largest contributors by absolute market size, driven primarily by acne/blemish care, which dominates over 60% of functional demand. However, its relatively slower growth reflects a more saturated market where tea tree oil competes with established dermocosmetic actives like benzoyl peroxide and retinoids. Germany (10.9% CAGR) and the UK (14.6% CAGR) are shaped by Europe’s clean beauty movement, where tea tree oil products resonate with the natural/organic claim segment that already accounts for more than half of global revenues. The higher growth in the UK compared to Germany reflects stronger adoption of mass-market and specialty beauty formats, while Germany’s market remains more premium and pharmacy-led. Collectively, these country-level differences illustrate how the market is driven by emerging-market dynamism in Asia and steady but slower growth in the West, creating a globally balanced expansion path through 2035.
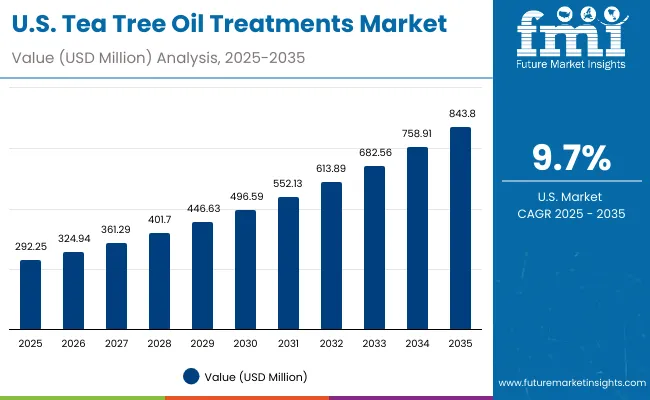
Sales Outlook for Tea Tree Oil Treatments in the United States

Usa Tea Tree Oil Treatments Market

Year USA Tea Tree Oil Treatments Market (USD Million)
2025 292.3
2026 324.9
2027 361.3
2028 401.7
2029 446.6
2030 496.6
2031 552.1
2032 613.9
2033 682.6
2034 758.9
2035 843.8

The Tea Tree Oil Treatments Market in the United States is projected to grow at a CAGR of 9.7%, supported by steady consumer demand for acne/blemish care products, which represent over 61% of functional usage. A notable year-on-year increase is being recorded across cleansers and spot treatments, particularly among Gen Z and millennial consumers seeking natural anti-acne solutions. Dermatologist endorsements and digital consultations have helped tea tree oil transition into mainstream skincare, while retail pharmacy shelves continue to stock tea tree-based acne washes alongside traditional medicated solutions. E-commerce channels, boosted by TikTok-driven product virality, are expanding access to niche and private-label tea tree oil products. Premium players are also bundling tea tree oil with niacinamide and salicylic acid, making hybrid products more attractive in competitive dermocosmetic aisles.

  • Acne/blemish care remains the largest driver, commanding 61.6% of market demand.
  • Spot treatments and cleansers are being integrated into acne care routines across all age groups.
  • Hybrid products combining tea tree oil with proven actives are capturing dermatologist-backed credibility.

Growth and Expansion Outlook for Tea Tree Oil Treatments in the United Kingdom

The Tea Tree Oil Treatments Market in the United Kingdom is expected to grow at a CAGR of 14.6%, driven by strong alignment with Europe’s clean beauty movement. Natural/organic claims resonate with UK consumers, who actively seek tea tree oil cleansers and serums as affordable alternatives to premium natural skincare. Adoption has been accelerated by pharmacy chains and specialty beauty stores, where tea tree oil products are marketed under “natural acne solutions” banners. Indie brands are also leveraging e-commerce and subscription kits to expand access. Beyond acne treatments, oil control and soothing products are gaining share, catering to consumers with sensitive skin conditions aggravated by urban pollution and stress.

  • Natural/organic claims account for the largest share, with Ayurvedic-inspired blends slowly entering niche retail channels.
  • Specialty beauty retailers are expanding tea tree product lines, often in bundled acne kits.
  • Mass-market availability ensures consistent growth across both teens and adult demographics.

Growth and Expansion Outlook for Tea Tree Oil Treatments in India

India is witnessing rapid growth in the Tea Tree Oil Treatments Market, which is forecast to expand at a CAGR of 22.8%, the highest globally. Growth is driven by rising consumer awareness of natural acne remedies and the widespread acceptance of Ayurvedic-inspired formulations. Tea tree oil products are often marketed alongside neem, turmeric, or tulsi, giving them both cultural relevance and premium positioning. Penetration is expanding rapidly in tier-2 and tier-3 cities, supported by cost-effective launches from domestic players and broader distribution via online marketplaces. Educational campaigns and dermatologist endorsements are further boosting trust in tea tree oil’s anti-acne efficacy.

  • Ayurvedic positioning is helping tea tree oil treatments resonate with India’s large youth demographic.
  • Domestic players are scaling affordable cleansers and creams, widening adoption in smaller cities.
  • Tiered product ranges (mass to premium) ensure penetration across income levels.

Sales Outlook for Tea Tree Oil Treatments in China

The Tea Tree Oil Treatments Market in China is expected to grow at a CAGR of 21.3%, one of the fastest among leading economies. Growth is driven by natural/organic positioning, which already accounts for 54.5% of sales in 2025, reflecting high consumer preference for safe, plant-based skincare. E-commerce dominates distribution, with platforms such as Tmall and JD.com featuring a wide selection of both international and domestic tea tree oil brands. Local C-beauty firms are innovating with hybrid formulas and value-added formats like sheet masks and acne patches infused with tea tree oil. Younger consumers in urban areas are especially receptive to influencer-led marketing and product recommendations on Douyin (TikTok).
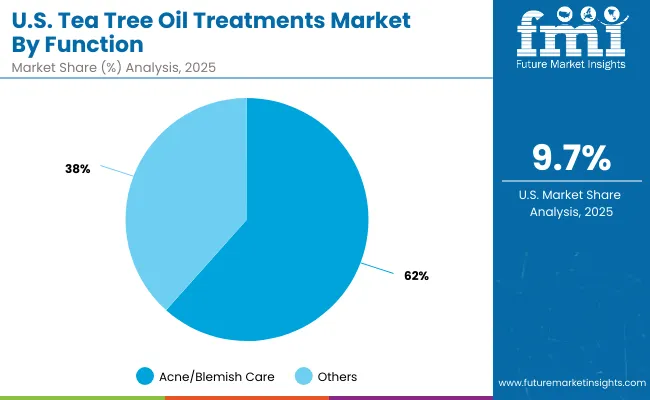
  • Natural/organic claims dominate consumer purchasing decisions in tea tree oil skincare.
  • C-beauty brands are blending tea tree oil with modern actives for premium acne kits.
  • Digital-first distribution is enabling mass adoption, with social commerce driving new brand launches.

Opportunity Analysis of USA Tea Tree Oil Treatments Market

Usa Tea Tree Oil Treatments Market By Function

USA by Function Value Share% 2025
Acne/blemish care 61.6%
Others 38.4%

The Tea Tree Oil Treatments Market in the United States is valued at USD 292.25 million in 2025, with acne/blemish care leading at 61.6%, followed by anti-inflammatory, oil control, and soothing solutions at 38.4%. The dominance of acne/blemish treatments is a direct outcome of the USA skincare landscape, where both teenage and adult acne prevalence remains high. Consumers prefer natural yet clinically acceptable solutions, and tea tree oil has established itself as a mainstream alternative to benzoyl peroxide and salicylic acid treatments.

Portability and product variety enhance adoption, with formats such as spot treatments, foaming cleansers, and acne patches making tea tree oil-based skincare convenient and accessible. Integration into dermatologist-recommended kits and over-the-counter retail pharmacy lines has also expanded consumer trust. Social media influencers and dermatologists on platforms like TikTok and Instagram further validate its role, positioning tea tree oil as a reliable option for ongoing acne management. As digital-first D2C models expand, the USA market is expected to experience steady growth led by acne-focused solutions.
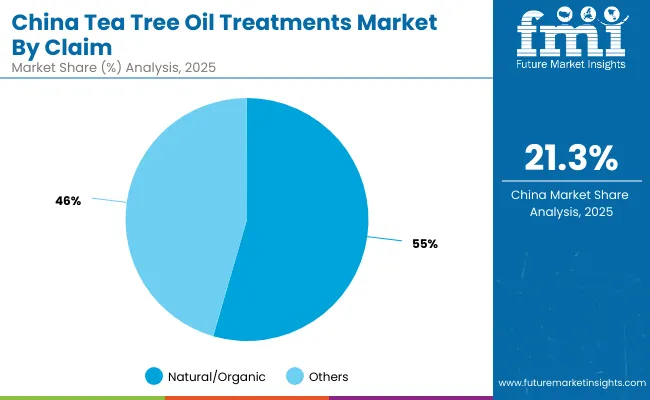
  • Market size for USA in 2025 is USD 292.25 million
  • Global market share is approximately 22.7% in 2025
  • Acne/blemish care leads at 61.6% due to widespread acne prevalence and natural remedy demand

Opportunity Analysis of China Tea Tree Oil Treatments Market

China Tea Tree Oil Treatments Market By Claim

China by Claim Value Share% 2025
Natural/organic 54.5%
Others 45.5%

The Tea Tree Oil Treatments Market in China is valued at an estimated USD 155.9 million in 2025, with natural/organic claims leading at 54.5%, followed by vegan, clean-label, and Ayurvedic-inspired positioning at 45.5%. The dominance of natural/organic is directly linked to China’s consumer preference for herbal and plant-based skincare solutions, which are perceived as safer and more trustworthy compared to synthetic formulas. This aligns with the rapid growth of China’s clean beauty segment, where natural positioning is the primary purchase driver.

E-commerce remains the leading distribution channel, with platforms like Tmall and JD.com enabling wide access to both international and domestic brands. Domestic C-beauty players are innovating with hybrid products such as sheet masks, serums, and acne patches that combine tea tree oil with niacinamide or centellaasiatica, strengthening performance claims. Government regulations promoting safety and ingredient transparency have further boosted consumer confidence in natural claims. The ability of tea tree oil treatments to align with both traditional Chinese herbal culture and modern clean beauty trends ensures strong double-digit growth through 2035.
  • Market size for China in 2025 is USD 155.9 million
  • Global market share is approximately 12.1% in 2025
  • Natural/organic claims lead at 54.5%, reflecting strong consumer trust in herbal positioning

Competitive Landscape of Global Tea Tree Oil Treatments Market

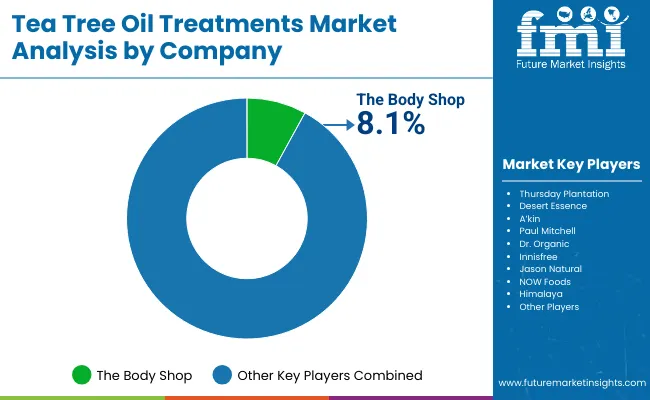
Tea Tree Oil Treatments Market By Company

Company Global Value Share 2025
The Body Shop 8.1%
Others 91.9%

The global Tea Tree Oil Treatments Market is moderately fragmented, with a mix of heritage natural beauty brands, K-beauty and C-beauty innovators, and niche-focused specialists competing across acne, oil control, and clean beauty categories. The Body Shop leads with 8.1% of global value share in 2025, owing to its long-established tea tree line and global retail network. Its strategy focuses on maintaining brand trust, leveraging sustainable sourcing, and expanding its acne kit bundles across both online and offline channels.Other established players such as Thursday Plantation, Desert Essence, and Jason Natural hold strong regional positions, often appealing to consumers through their organic and clean-label branding. K-beauty brands like Innisfree are accelerating adoption by integrating tea tree oil into multi-step skincare routines and e-commerce-driven outreach, particularly in Asia-Pacific. Herbal and Ayurvedic players such as Himalaya are capitalizing on demand in India and the Middle East, aligning tea tree oil with cultural wellness traditions.

The competitive field is further enriched by emerging indie and D2C brands that focus on vegan, subscription-based, and influencer-driven models, making tea tree oil treatments more accessible to younger demographics. Competitive differentiation is shifting away from simple product launches toward ecosystem strategies that include hybrid formulations, sustainable packaging, and digital engagement. As consumer expectations evolve, the strength of a brand’s natural positioning, e-commerce reach, and hybrid innovation will determine long-term leadership.

Key Developments in Global Tea Tree Oil Treatments Market

  • On February 14, 2024, The Body Shop relaunched its flagship Tea Tree Oil skincare range with updated formulations blending tea tree oil and salicylic acid. The move was positioned as a science-meets-nature update to attract Gen Z consumers and reinforce its leadership in acne-care solutions.
  • On June 3, 2024, Thursday Plantation introduced a tea tree oil spot treatment gel with rapid absorption technology in Australia and Southeast Asia. The innovation targeted adult acne and sensitive skin, emphasizing its “fast-acting yet gentle” positioning.

Scope of the Report

Item Value
Quantitative Units USD 1,285.9 million
Function Acne/blemish care, Anti-inflammatory, Oil control, and Soothing
Product Type Serums, Creams/lotions, Cleansers, and Spot treatments
Channel E-commerce, Pharmacies, Mass retail, and Specialty beauty stores
Claim Natural/organic, Vegan, Clean-label, and Ayurvedic -inspired
Regions Covered North America, Europe, Asia-Pacific, Latin America, Middle East & Africa
Country Covered United States, Canada, Germany, France, United Kingdom, China, Japan, India, Brazil, South Africa
Key Companies Profiled FARO Technologies, Inc., 3D Digital Corporation, 3D Systems, Inc., Autodesk, Inc., Artec 3D, Automated Precision, Inc. (API), Carl Zeiss Optotechnik GmbH, Creaform Inc., Direct Dimensions Inc., GOM GmbH, Hexagon AB, Konica Minolta, Inc., NextEngine Inc., Nikon Corporation, OGI Systems Ltd, and ShapeGrabber
Additional Attributes Dollar sales by scanner type and end-use industry, adoption trends in reverse engineering and quality control, rising demand for handheld and portable 3D scanners, sector-specific growth in aerospace, automotive, and healthcare, software and services revenue segmentation, integration with AR/VR and digital twin technologies, regional trends influenced by digitization initiatives, and innovations in laser triangulation, structured light, and photogrammetry methods.

Key Segments

By Function:

  • Acne/blemish care
  • Anti-inflammatory
  • Oil control
  • Soothing

By Product Type:

  • Serums
  • Spot treatments
  • Creams/lotions
  • Cleansers

By Channel:

  • E-commerce
  • Pharmacies
  • Dermatology clinics
  • Specialty beauty stores

By Claim:

  • Natural/organic
  • Vegan
  • Ayurvedic-inspired
  • Clean-label

By Region:

  • North America
  • Latin America
  • Europe
  • East Asia
  • South Asia & Pacific
  • Middle East and Africa

Table of Content

  1. Executive Summary
    • Global Market Outlook
    • Demand-side Trends
    • Supply-side Trends
    • Technology Roadmap Analysis
    • Analysis and Recommendations
  2. Market Overview
    • Market Coverage / Taxonomy
    • Market Definition / Scope / Limitations
  3. Market Background
    • Market Dynamics
      • Drivers
      • Restraints
      • Opportunity
      • Trends
    • Scenario Forecast
      • Demand in Optimistic Scenario
      • Demand in Likely Scenario
      • Demand in Conservative Scenario
    • Opportunity Map Analysis
    • Product Life Cycle Analysis
    • Supply Chain Analysis
      • Supply Side Participants and their Roles
        • Producers
        • Mid-Level Participants (Traders/ Agents/ Brokers)
        • Wholesalers and Distributors
      • Value Added and Value Created at Node in the Supply Chain
      • List of Raw Material Suppliers
      • List of Existing and Potential Buyer’s
    • Investment Feasibility Matrix
    • Value Chain Analysis
      • Profit Margin Analysis
      • Wholesalers and Distributors
      • Retailers
    • PESTLE and Porter’s Analysis
    • Regulatory Landscape
      • By Key Regions
      • By Key Countries
    • Regional Parent Market Outlook
    • Production and Consumption Statistics
    • Import and Export Statistics
  4. Global Market Analysis 2020 to 2024 and Forecast, 2025 to 2035
    • Historical Market Size Value (USD Million) & Volume (Units) Analysis, 2020 to 2024
    • Current and Future Market Size Value (USD Million) & Volume (Units) Projections, 2025 to 2035
      • Y-o-Y Growth Trend Analysis
      • Absolute $ Opportunity Analysis
  5. Global Market Analysis 2020 to 2024 and Forecast 2025 to 2035, By Function
    • Introduction / Key Findings
    • Historical Market Size Value (USD Million) & Volume (Units) Analysis By Function, 2020 to 2024
    • Current and Future Market Size Value (USD Million) & Volume (Units) Analysis and Forecast By Function, 2025 to 2035
      • Acne/blemish care
      • Anti-inflammatory
      • Oil control
      • Soothing
    • Y-o-Y Growth Trend Analysis By Function, 2020 to 2024
    • Absolute $ Opportunity Analysis By Function, 2025 to 2035
  6. Global Market Analysis 2020 to 2024 and Forecast 2025 to 2035, By Product Type
    • Introduction / Key Findings
    • Historical Market Size Value (USD Million) & Volume (Units) Analysis By Product Type, 2020 to 2024
    • Current and Future Market Size Value (USD Million) & Volume (Units) Analysis and Forecast By Product Type, 2025 to 2035
      • Serums
      • Spot treatments
      • Creams/lotions
      • Cleansers
    • Y-o-Y Growth Trend Analysis By Product Type, 2020 to 2024
    • Absolute $ Opportunity Analysis By Product Type, 2025 to 2035
  7. Global Market Analysis 2020 to 2024 and Forecast 2025 to 2035, By Channel
    • Introduction / Key Findings
    • Historical Market Size Value (USD Million) & Volume (Units) Analysis By Channel, 2020 to 2024
    • Current and Future Market Size Value (USD Million) & Volume (Units) Analysis and Forecast By Channel, 2025 to 2035
      • E-commerce
      • Pharmacies
      • Dermatology clinics
      • Specialty beauty stores
    • Y-o-Y Growth Trend Analysis By Channel, 2020 to 2024
    • Absolute $ Opportunity Analysis By Channel, 2025 to 2035
  8. Global Market Analysis 2020 to 2024 and Forecast 2025 to 2035, By Claim
    • Introduction / Key Findings
    • Historical Market Size Value (USD Million) & Volume (Units) Analysis By Claim, 2020 to 2024
    • Current and Future Market Size Value (USD Million) & Volume (Units) Analysis and Forecast By Claim, 2025 to 2035
      • Natural/organic
      • Vegan
      • Ayurvedic-inspired
      • Clean-label
    • Y-o-Y Growth Trend Analysis By Claim, 2020 to 2024
    • Absolute $ Opportunity Analysis By Claim, 2025 to 2035
  9. Global Market Analysis 2020 to 2024 and Forecast 2025 to 2035, By Region
    • Introduction
    • Historical Market Size Value (USD Million) & Volume (Units) Analysis By Region, 2020 to 2024
    • Current Market Size Value (USD Million) & Volume (Units) Analysis and Forecast By Region, 2025 to 2035
      • North America
      • Latin America
      • Europe
      • East Asia
      • South Asia & Pacific
      • Middle East and Africa
    • Market Attractiveness Analysis By Region
  10. North America Market Analysis 2020 to 2024 and Forecast 2025 to 2035, By Country
    • Historical Market Size Value (USD Million) & Volume (Units) Trend Analysis By Market Taxonomy, 2020 to 2024
    • Market Size Value (USD Million) & Volume (Units) Forecast By Market Taxonomy, 2025 to 2035
      • By Country
        • USA
        • Canada
      • By Function
      • By Product Type
      • By Channel
      • By Claim
    • Market Attractiveness Analysis
      • By Country
      • By Function
      • By Product Type
      • By Channel
      • By Claim
    • Key Takeaways
  11. Latin America Market Analysis 2020 to 2024 and Forecast 2025 to 2035, By Country
    • Historical Market Size Value (USD Million) & Volume (Units) Trend Analysis By Market Taxonomy, 2020 to 2024
    • Market Size Value (USD Million) & Volume (Units) Forecast By Market Taxonomy, 2025 to 2035
      • By Country
        • Brazil
        • Mexico
        • Colombia
        • Rest of Latin America
      • By Function
      • By Product Type
      • By Channel
      • By Claim
    • Market Attractiveness Analysis
      • By Country
      • By Function
      • By Product Type
      • By Channel
      • By Claim
    • Key Takeaways
  12. Europe Market Analysis 2020 to 2024 and Forecast 2025 to 2035, By Country
    • Historical Market Size Value (USD Million) & Volume (Units) Trend Analysis By Market Taxonomy, 2020 to 2024
    • Market Size Value (USD Million) & Volume (Units) Forecast By Market Taxonomy, 2025 to 2035
      • By Country
        • Germany
        • UK
        • France
        • Italy
        • Spain
        • Belgium
        • Netherlands
        • Nordic
        • Switzerland
        • Russia
        • Poland
        • Rest of Europe
      • By Function
      • By Product Type
      • By Channel
      • By Claim
    • Market Attractiveness Analysis
      • By Country
      • By Function
      • By Product Type
      • By Channel
      • By Claim
    • Key Takeaways
  13. East Asia Market Analysis 2020 to 2024 and Forecast 2025 to 2035, By Country
    • Historical Market Size Value (USD Million) & Volume (Units) Trend Analysis By Market Taxonomy, 2020 to 2024
    • Market Size Value (USD Million) & Volume (Units) Forecast By Market Taxonomy, 2025 to 2035
      • By Country
        • China
        • Japan
        • South Korea
      • By Function
      • By Product Type
      • By Channel
      • By Claim
    • Market Attractiveness Analysis
      • By Country
      • By Function
      • By Product Type
      • By Channel
      • By Claim
    • Key Takeaways
  14. South Asia & Pacific Market Analysis 2020 to 2024 and Forecast 2025 to 2035, By Country
    • Historical Market Size Value (USD Million) & Volume (Units) Trend Analysis By Market Taxonomy, 2020 to 2024
    • Market Size Value (USD Million) & Volume (Units) Forecast By Market Taxonomy, 2025 to 2035
      • By Country
        • India
        • Thailand
        • Malaysia
        • Indonesia
        • Singapore
        • Vietnam
        • Australia
        • New Zealand
        • Rest of South Asia
      • By Function
      • By Product Type
      • By Channel
      • By Claim
    • Market Attractiveness Analysis
      • By Country
      • By Function
      • By Product Type
      • By Channel
      • By Claim
    • Key Takeaways
  15. Middle East and Africa Market Analysis 2020 to 2024 and Forecast 2025 to 2035, By Country
    • Historical Market Size Value (USD Million) & Volume (Units) Trend Analysis By Market Taxonomy, 2020 to 2024
    • Market Size Value (USD Million) & Volume (Units) Forecast By Market Taxonomy, 2025 to 2035
      • By Country
        • Turkey
        • UAE
        • Saudi Arabia
        • Israel
        • Other GCC Countries
        • North Africa
        • South Africa
      • By Function
      • By Product Type
      • By Channel
      • By Claim
    • Market Attractiveness Analysis
      • By Country
      • By Function
      • By Product Type
      • By Channel
      • By Claim
    • Key Takeaways
  16. Key Countries Market Analysis
    • USA
      • Pricing Analysis
      • Market Share Analysis, 2024
        • By Function
        • By Product Type
        • By Channel
        • By Claim
    • Canada
      • Pricing Analysis
      • Market Share Analysis, 2024
        • By Function
        • By Product Type
        • By Channel
        • By Claim
    • Brazil
      • Pricing Analysis
      • Market Share Analysis, 2024
        • By Function
        • By Product Type
        • By Channel
        • By Claim
    • Mexico
      • Pricing Analysis
      • Market Share Analysis, 2024
        • By Function
        • By Product Type
        • By Channel
        • By Claim
    • Colombia
      • Pricing Analysis
      • Market Share Analysis, 2024
        • By Function
        • By Product Type
        • By Channel
        • By Claim
    • Germany
      • Pricing Analysis
      • Market Share Analysis, 2024
        • By Function
        • By Product Type
        • By Channel
        • By Claim
    • UK
      • Pricing Analysis
      • Market Share Analysis, 2024
        • By Function
        • By Product Type
        • By Channel
        • By Claim
    • France
      • Pricing Analysis
      • Market Share Analysis, 2024
        • By Function
        • By Product Type
        • By Channel
        • By Claim
    • Italy
      • Pricing Analysis
      • Market Share Analysis, 2024
        • By Function
        • By Product Type
        • By Channel
        • By Claim
    • Spain
      • Pricing Analysis
      • Market Share Analysis, 2024
        • By Function
        • By Product Type
        • By Channel
        • By Claim
    • Belgium
      • Pricing Analysis
      • Market Share Analysis, 2024
        • By Function
        • By Product Type
        • By Channel
        • By Claim
    • Netherlands
      • Pricing Analysis
      • Market Share Analysis, 2024
        • By Function
        • By Product Type
        • By Channel
        • By Claim
    • Nordic
      • Pricing Analysis
      • Market Share Analysis, 2024
        • By Function
        • By Product Type
        • By Channel
        • By Claim
    • Switzerland
      • Pricing Analysis
      • Market Share Analysis, 2024
        • By Function
        • By Product Type
        • By Channel
        • By Claim
    • Russia
      • Pricing Analysis
      • Market Share Analysis, 2024
        • By Function
        • By Product Type
        • By Channel
        • By Claim
    • Poland
      • Pricing Analysis
      • Market Share Analysis, 2024
        • By Function
        • By Product Type
        • By Channel
        • By Claim
    • China
      • Pricing Analysis
      • Market Share Analysis, 2024
        • By Function
        • By Product Type
        • By Channel
        • By Claim
    • Japan
      • Pricing Analysis
      • Market Share Analysis, 2024
        • By Function
        • By Product Type
        • By Channel
        • By Claim
    • South Korea
      • Pricing Analysis
      • Market Share Analysis, 2024
        • By Function
        • By Product Type
        • By Channel
        • By Claim
    • India
      • Pricing Analysis
      • Market Share Analysis, 2024
        • By Function
        • By Product Type
        • By Channel
        • By Claim
    • Thailand
      • Pricing Analysis
      • Market Share Analysis, 2024
        • By Function
        • By Product Type
        • By Channel
        • By Claim
    • Indonesia
      • Pricing Analysis
      • Market Share Analysis, 2024
        • By Function
        • By Product Type
        • By Channel
        • By Claim
    • Australia
      • Pricing Analysis
      • Market Share Analysis, 2024
        • By Function
        • By Product Type
        • By Channel
        • By Claim
    • New Zealand
      • Pricing Analysis
      • Market Share Analysis, 2024
        • By Function
        • By Product Type
        • By Channel
        • By Claim
    • Turkey
      • Pricing Analysis
      • Market Share Analysis, 2024
        • By Function
        • By Product Type
        • By Channel
        • By Claim
    • UAE
      • Pricing Analysis
      • Market Share Analysis, 2024
        • By Function
        • By Product Type
        • By Channel
        • By Claim
    • Saudi Arabia
      • Pricing Analysis
      • Market Share Analysis, 2024
        • By Function
        • By Product Type
        • By Channel
        • By Claim
    • Israel
      • Pricing Analysis
      • Market Share Analysis, 2024
        • By Function
        • By Product Type
        • By Channel
        • By Claim
    • North Africa
      • Pricing Analysis
      • Market Share Analysis, 2024
        • By Function
        • By Product Type
        • By Channel
        • By Claim
    • South Africa
      • Pricing Analysis
      • Market Share Analysis, 2024
        • By Function
        • By Product Type
        • By Channel
        • By Claim
  17. Market Structure Analysis
    • Competition Dashboard
    • Competition Benchmarking
    • Market Share Analysis of Top Players
      • By Regional
      • By Function
      • By Product Type
      • By Channel
      • By Claim
  18. Competition Analysis
    • Competition Deep Dive
      • The Body Shop
        • Overview
        • Product Portfolio
        • Profitability by Market Segments (Product/Age /Sales Channel/Region)
        • Sales Footprint
        • Strategy Overview
          • Marketing Strategy
          • Product Strategy
          • Channel Strategy
      • Thursday Plantation
        • Overview
        • Product Portfolio
        • Profitability by Market Segments (Product/Age /Sales Channel/Region)
        • Sales Footprint
        • Strategy Overview
          • Marketing Strategy
          • Product Strategy
          • Channel Strategy
      • Desert Essence
        • Overview
        • Product Portfolio
        • Profitability by Market Segments (Product/Age /Sales Channel/Region)
        • Sales Footprint
        • Strategy Overview
          • Marketing Strategy
          • Product Strategy
          • Channel Strategy
      • A’kin
        • Overview
        • Product Portfolio
        • Profitability by Market Segments (Product/Age /Sales Channel/Region)
        • Sales Footprint
        • Strategy Overview
          • Marketing Strategy
          • Product Strategy
          • Channel Strategy
      • Paul Mitchell
        • Overview
        • Product Portfolio
        • Profitability by Market Segments (Product/Age /Sales Channel/Region)
        • Sales Footprint
        • Strategy Overview
          • Marketing Strategy
          • Product Strategy
          • Channel Strategy
      • Dr. Organic
        • Overview
        • Product Portfolio
        • Profitability by Market Segments (Product/Age /Sales Channel/Region)
        • Sales Footprint
        • Strategy Overview
          • Marketing Strategy
          • Product Strategy
          • Channel Strategy
      • Innisfree
        • Overview
        • Product Portfolio
        • Profitability by Market Segments (Product/Age /Sales Channel/Region)
        • Sales Footprint
        • Strategy Overview
          • Marketing Strategy
          • Product Strategy
          • Channel Strategy
      • Jason Natural
        • Overview
        • Product Portfolio
        • Profitability by Market Segments (Product/Age /Sales Channel/Region)
        • Sales Footprint
        • Strategy Overview
          • Marketing Strategy
          • Product Strategy
          • Channel Strategy
      • NOW Foods
        • Overview
        • Product Portfolio
        • Profitability by Market Segments (Product/Age /Sales Channel/Region)
        • Sales Footprint
        • Strategy Overview
          • Marketing Strategy
          • Product Strategy
          • Channel Strategy
      • Himalaya
        • Overview
        • Product Portfolio
        • Profitability by Market Segments (Product/Age /Sales Channel/Region)
        • Sales Footprint
        • Strategy Overview
          • Marketing Strategy
          • Product Strategy
          • Channel Strategy
  19. Assumptions & Acronyms Used
  20. Research Methodology

List of Tables

  • Table 1: Global Market Value (USD Million) Forecast by Region, 2020-2035
  • Table 2: Global Market Volume (Units) Forecast by Region, 2020-2035
  • Table 3: Global Market Value (USD Million) Forecast by Function, 2020-2035
  • Table 4: Global Market Volume (Units) Forecast by Function, 2020-2035
  • Table 5: Global Market Value (USD Million) Forecast by Product Type, 2020-2035
  • Table 6: Global Market Volume (Units) Forecast by Product Type, 2020-2035
  • Table 7: Global Market Value (USD Million) Forecast by Channel, 2020-2035
  • Table 8: Global Market Volume (Units) Forecast by Channel, 2020-2035
  • Table 9: Global Market Value (USD Million) Forecast by Claim, 2020-2035
  • Table 10: Global Market Volume (Units) Forecast by Claim, 2020-2035
  • Table 11: North America Market Value (USD Million) Forecast by Country, 2020-2035
  • Table 12: North America Market Volume (Units) Forecast by Country, 2020-2035
  • Table 13: North America Market Value (USD Million) Forecast by Function, 2020-2035
  • Table 14: North America Market Volume (Units) Forecast by Function, 2020-2035
  • Table 15: North America Market Value (USD Million) Forecast by Product Type, 2020-2035
  • Table 16: North America Market Volume (Units) Forecast by Product Type, 2020-2035
  • Table 17: North America Market Value (USD Million) Forecast by Channel, 2020-2035
  • Table 18: North America Market Volume (Units) Forecast by Channel, 2020-2035
  • Table 19: North America Market Value (USD Million) Forecast by Claim, 2020-2035
  • Table 20: North America Market Volume (Units) Forecast by Claim, 2020-2035
  • Table 21: Latin America Market Value (USD Million) Forecast by Country, 2020-2035
  • Table 22: Latin America Market Volume (Units) Forecast by Country, 2020-2035
  • Table 23: Latin America Market Value (USD Million) Forecast by Function, 2020-2035
  • Table 24: Latin America Market Volume (Units) Forecast by Function, 2020-2035
  • Table 25: Latin America Market Value (USD Million) Forecast by Product Type, 2020-2035
  • Table 26: Latin America Market Volume (Units) Forecast by Product Type, 2020-2035
  • Table 27: Latin America Market Value (USD Million) Forecast by Channel, 2020-2035
  • Table 28: Latin America Market Volume (Units) Forecast by Channel, 2020-2035
  • Table 29: Latin America Market Value (USD Million) Forecast by Claim, 2020-2035
  • Table 30: Latin America Market Volume (Units) Forecast by Claim, 2020-2035
  • Table 31: Europe Market Value (USD Million) Forecast by Country, 2020-2035
  • Table 32: Europe Market Volume (Units) Forecast by Country, 2020-2035
  • Table 33: Europe Market Value (USD Million) Forecast by Function, 2020-2035
  • Table 34: Europe Market Volume (Units) Forecast by Function, 2020-2035
  • Table 35: Europe Market Value (USD Million) Forecast by Product Type, 2020-2035
  • Table 36: Europe Market Volume (Units) Forecast by Product Type, 2020-2035
  • Table 37: Europe Market Value (USD Million) Forecast by Channel, 2020-2035
  • Table 38: Europe Market Volume (Units) Forecast by Channel, 2020-2035
  • Table 39: Europe Market Value (USD Million) Forecast by Claim, 2020-2035
  • Table 40: Europe Market Volume (Units) Forecast by Claim, 2020-2035
  • Table 41: East Asia Market Value (USD Million) Forecast by Country, 2020-2035
  • Table 42: East Asia Market Volume (Units) Forecast by Country, 2020-2035
  • Table 43: East Asia Market Value (USD Million) Forecast by Function, 2020-2035
  • Table 44: East Asia Market Volume (Units) Forecast by Function, 2020-2035
  • Table 45: East Asia Market Value (USD Million) Forecast by Product Type, 2020-2035
  • Table 46: East Asia Market Volume (Units) Forecast by Product Type, 2020-2035
  • Table 47: East Asia Market Value (USD Million) Forecast by Channel, 2020-2035
  • Table 48: East Asia Market Volume (Units) Forecast by Channel, 2020-2035
  • Table 49: East Asia Market Value (USD Million) Forecast by Claim, 2020-2035
  • Table 50: East Asia Market Volume (Units) Forecast by Claim, 2020-2035
  • Table 51: South Asia & Pacific Market Value (USD Million) Forecast by Country, 2020-2035
  • Table 52: South Asia & Pacific Market Volume (Units) Forecast by Country, 2020-2035
  • Table 53: South Asia & Pacific Market Value (USD Million) Forecast by Function, 2020-2035
  • Table 54: South Asia & Pacific Market Volume (Units) Forecast by Function, 2020-2035
  • Table 55: South Asia & Pacific Market Value (USD Million) Forecast by Product Type, 2020-2035
  • Table 56: South Asia & Pacific Market Volume (Units) Forecast by Product Type, 2020-2035
  • Table 57: South Asia & Pacific Market Value (USD Million) Forecast by Channel, 2020-2035
  • Table 58: South Asia & Pacific Market Volume (Units) Forecast by Channel, 2020-2035
  • Table 59: South Asia & Pacific Market Value (USD Million) Forecast by Claim, 2020-2035
  • Table 60: South Asia & Pacific Market Volume (Units) Forecast by Claim, 2020-2035
  • Table 61: Middle East and Africa Market Value (USD Million) Forecast by Country, 2020-2035
  • Table 62: Middle East and Africa Market Volume (Units) Forecast by Country, 2020-2035
  • Table 63: Middle East and Africa Market Value (USD Million) Forecast by Function, 2020-2035
  • Table 64: Middle East and Africa Market Volume (Units) Forecast by Function, 2020-2035
  • Table 65: Middle East and Africa Market Value (USD Million) Forecast by Product Type, 2020-2035
  • Table 66: Middle East and Africa Market Volume (Units) Forecast by Product Type, 2020-2035
  • Table 67: Middle East and Africa Market Value (USD Million) Forecast by Channel, 2020-2035
  • Table 68: Middle East and Africa Market Volume (Units) Forecast by Channel, 2020-2035
  • Table 69: Middle East and Africa Market Value (USD Million) Forecast by Claim, 2020-2035
  • Table 70: Middle East and Africa Market Volume (Units) Forecast by Claim, 2020-2035

List of Figures

  • Figure 1: Global Market Value (USD Million) by Function, 2025-2035
  • Figure 2: Global Market Value (USD Million) by Product Type, 2025-2035
  • Figure 3: Global Market Value (USD Million) by Channel, 2025-2035
  • Figure 4: Global Market Value (USD Million) by Claim, 2025-2035
  • Figure 5: Global Market Value (USD Million) by Region, 2025-2035
  • Figure 6: Global Market Value (USD Million) Analysis by Region, 2020-2035
  • Figure 7: Global Market Volume (Units) Analysis by Region, 2020-2035
  • Figure 8: Global Market Value Share (%) and BPS Analysis by Region, 2025-2035
  • Figure 9: Global Market Y-o-Y Growth (%) Projections by Region, 2025-2035
  • Figure 10: Global Market Value (USD Million) Analysis by Function, 2020-2035
  • Figure 11: Global Market Volume (Units) Analysis by Function, 2020-2035
  • Figure 12: Global Market Value Share (%) and BPS Analysis by Function, 2025-2035
  • Figure 13: Global Market Y-o-Y Growth (%) Projections by Function, 2025-2035
  • Figure 14: Global Market Value (USD Million) Analysis by Product Type, 2020-2035
  • Figure 15: Global Market Volume (Units) Analysis by Product Type, 2020-2035
  • Figure 16: Global Market Value Share (%) and BPS Analysis by Product Type, 2025-2035
  • Figure 17: Global Market Y-o-Y Growth (%) Projections by Product Type, 2025-2035
  • Figure 18: Global Market Value (USD Million) Analysis by Channel, 2020-2035
  • Figure 19: Global Market Volume (Units) Analysis by Channel, 2020-2035
  • Figure 20: Global Market Value Share (%) and BPS Analysis by Channel, 2025-2035
  • Figure 21: Global Market Y-o-Y Growth (%) Projections by Channel, 2025-2035
  • Figure 22: Global Market Value (USD Million) Analysis by Claim, 2020-2035
  • Figure 23: Global Market Volume (Units) Analysis by Claim, 2020-2035
  • Figure 24: Global Market Value Share (%) and BPS Analysis by Claim, 2025-2035
  • Figure 25: Global Market Y-o-Y Growth (%) Projections by Claim, 2025-2035
  • Figure 26: Global Market Attractiveness by Function, 2025-2035
  • Figure 27: Global Market Attractiveness by Product Type, 2025-2035
  • Figure 28: Global Market Attractiveness by Channel, 2025-2035
  • Figure 29: Global Market Attractiveness by Claim, 2025-2035
  • Figure 30: Global Market Attractiveness by Region, 2025-2035
  • Figure 31: North America Market Value (USD Million) by Function, 2025-2035
  • Figure 32: North America Market Value (USD Million) by Product Type, 2025-2035
  • Figure 33: North America Market Value (USD Million) by Channel, 2025-2035
  • Figure 34: North America Market Value (USD Million) by Claim, 2025-2035
  • Figure 35: North America Market Value (USD Million) by Country, 2025-2035
  • Figure 36: North America Market Value (USD Million) Analysis by Country, 2020-2035
  • Figure 37: North America Market Volume (Units) Analysis by Country, 2020-2035
  • Figure 38: North America Market Value Share (%) and BPS Analysis by Country, 2025-2035
  • Figure 39: North America Market Y-o-Y Growth (%) Projections by Country, 2025-2035
  • Figure 40: North America Market Value (USD Million) Analysis by Function, 2020-2035
  • Figure 41: North America Market Volume (Units) Analysis by Function, 2020-2035
  • Figure 42: North America Market Value Share (%) and BPS Analysis by Function, 2025-2035
  • Figure 43: North America Market Y-o-Y Growth (%) Projections by Function, 2025-2035
  • Figure 44: North America Market Value (USD Million) Analysis by Product Type, 2020-2035
  • Figure 45: North America Market Volume (Units) Analysis by Product Type, 2020-2035
  • Figure 46: North America Market Value Share (%) and BPS Analysis by Product Type, 2025-2035
  • Figure 47: North America Market Y-o-Y Growth (%) Projections by Product Type, 2025-2035
  • Figure 48: North America Market Value (USD Million) Analysis by Channel, 2020-2035
  • Figure 49: North America Market Volume (Units) Analysis by Channel, 2020-2035
  • Figure 50: North America Market Value Share (%) and BPS Analysis by Channel, 2025-2035
  • Figure 51: North America Market Y-o-Y Growth (%) Projections by Channel, 2025-2035
  • Figure 52: North America Market Value (USD Million) Analysis by Claim, 2020-2035
  • Figure 53: North America Market Volume (Units) Analysis by Claim, 2020-2035
  • Figure 54: North America Market Value Share (%) and BPS Analysis by Claim, 2025-2035
  • Figure 55: North America Market Y-o-Y Growth (%) Projections by Claim, 2025-2035
  • Figure 56: North America Market Attractiveness by Function, 2025-2035
  • Figure 57: North America Market Attractiveness by Product Type, 2025-2035
  • Figure 58: North America Market Attractiveness by Channel, 2025-2035
  • Figure 59: North America Market Attractiveness by Claim, 2025-2035
  • Figure 60: North America Market Attractiveness by Country, 2025-2035
  • Figure 61: Latin America Market Value (USD Million) by Function, 2025-2035
  • Figure 62: Latin America Market Value (USD Million) by Product Type, 2025-2035
  • Figure 63: Latin America Market Value (USD Million) by Channel, 2025-2035
  • Figure 64: Latin America Market Value (USD Million) by Claim, 2025-2035
  • Figure 65: Latin America Market Value (USD Million) by Country, 2025-2035
  • Figure 66: Latin America Market Value (USD Million) Analysis by Country, 2020-2035
  • Figure 67: Latin America Market Volume (Units) Analysis by Country, 2020-2035
  • Figure 68: Latin America Market Value Share (%) and BPS Analysis by Country, 2025-2035
  • Figure 69: Latin America Market Y-o-Y Growth (%) Projections by Country, 2025-2035
  • Figure 70: Latin America Market Value (USD Million) Analysis by Function, 2020-2035
  • Figure 71: Latin America Market Volume (Units) Analysis by Function, 2020-2035
  • Figure 72: Latin America Market Value Share (%) and BPS Analysis by Function, 2025-2035
  • Figure 73: Latin America Market Y-o-Y Growth (%) Projections by Function, 2025-2035
  • Figure 74: Latin America Market Value (USD Million) Analysis by Product Type, 2020-2035
  • Figure 75: Latin America Market Volume (Units) Analysis by Product Type, 2020-2035
  • Figure 76: Latin America Market Value Share (%) and BPS Analysis by Product Type, 2025-2035
  • Figure 77: Latin America Market Y-o-Y Growth (%) Projections by Product Type, 2025-2035
  • Figure 78: Latin America Market Value (USD Million) Analysis by Channel, 2020-2035
  • Figure 79: Latin America Market Volume (Units) Analysis by Channel, 2020-2035
  • Figure 80: Latin America Market Value Share (%) and BPS Analysis by Channel, 2025-2035
  • Figure 81: Latin America Market Y-o-Y Growth (%) Projections by Channel, 2025-2035
  • Figure 82: Latin America Market Value (USD Million) Analysis by Claim, 2020-2035
  • Figure 83: Latin America Market Volume (Units) Analysis by Claim, 2020-2035
  • Figure 84: Latin America Market Value Share (%) and BPS Analysis by Claim, 2025-2035
  • Figure 85: Latin America Market Y-o-Y Growth (%) Projections by Claim, 2025-2035
  • Figure 86: Latin America Market Attractiveness by Function, 2025-2035
  • Figure 87: Latin America Market Attractiveness by Product Type, 2025-2035
  • Figure 88: Latin America Market Attractiveness by Channel, 2025-2035
  • Figure 89: Latin America Market Attractiveness by Claim, 2025-2035
  • Figure 90: Latin America Market Attractiveness by Country, 2025-2035
  • Figure 91: Europe Market Value (USD Million) by Function, 2025-2035
  • Figure 92: Europe Market Value (USD Million) by Product Type, 2025-2035
  • Figure 93: Europe Market Value (USD Million) by Channel, 2025-2035
  • Figure 94: Europe Market Value (USD Million) by Claim, 2025-2035
  • Figure 95: Europe Market Value (USD Million) by Country, 2025-2035
  • Figure 96: Europe Market Value (USD Million) Analysis by Country, 2020-2035
  • Figure 97: Europe Market Volume (Units) Analysis by Country, 2020-2035
  • Figure 98: Europe Market Value Share (%) and BPS Analysis by Country, 2025-2035
  • Figure 99: Europe Market Y-o-Y Growth (%) Projections by Country, 2025-2035
  • Figure 100: Europe Market Value (USD Million) Analysis by Function, 2020-2035
  • Figure 101: Europe Market Volume (Units) Analysis by Function, 2020-2035
  • Figure 102: Europe Market Value Share (%) and BPS Analysis by Function, 2025-2035
  • Figure 103: Europe Market Y-o-Y Growth (%) Projections by Function, 2025-2035
  • Figure 104: Europe Market Value (USD Million) Analysis by Product Type, 2020-2035
  • Figure 105: Europe Market Volume (Units) Analysis by Product Type, 2020-2035
  • Figure 106: Europe Market Value Share (%) and BPS Analysis by Product Type, 2025-2035
  • Figure 107: Europe Market Y-o-Y Growth (%) Projections by Product Type, 2025-2035
  • Figure 108: Europe Market Value (USD Million) Analysis by Channel, 2020-2035
  • Figure 109: Europe Market Volume (Units) Analysis by Channel, 2020-2035
  • Figure 110: Europe Market Value Share (%) and BPS Analysis by Channel, 2025-2035
  • Figure 111: Europe Market Y-o-Y Growth (%) Projections by Channel, 2025-2035
  • Figure 112: Europe Market Value (USD Million) Analysis by Claim, 2020-2035
  • Figure 113: Europe Market Volume (Units) Analysis by Claim, 2020-2035
  • Figure 114: Europe Market Value Share (%) and BPS Analysis by Claim, 2025-2035
  • Figure 115: Europe Market Y-o-Y Growth (%) Projections by Claim, 2025-2035
  • Figure 116: Europe Market Attractiveness by Function, 2025-2035
  • Figure 117: Europe Market Attractiveness by Product Type, 2025-2035
  • Figure 118: Europe Market Attractiveness by Channel, 2025-2035
  • Figure 119: Europe Market Attractiveness by Claim, 2025-2035
  • Figure 120: Europe Market Attractiveness by Country, 2025-2035
  • Figure 121: East Asia Market Value (USD Million) by Function, 2025-2035
  • Figure 122: East Asia Market Value (USD Million) by Product Type, 2025-2035
  • Figure 123: East Asia Market Value (USD Million) by Channel, 2025-2035
  • Figure 124: East Asia Market Value (USD Million) by Claim, 2025-2035
  • Figure 125: East Asia Market Value (USD Million) by Country, 2025-2035
  • Figure 126: East Asia Market Value (USD Million) Analysis by Country, 2020-2035
  • Figure 127: East Asia Market Volume (Units) Analysis by Country, 2020-2035
  • Figure 128: East Asia Market Value Share (%) and BPS Analysis by Country, 2025-2035
  • Figure 129: East Asia Market Y-o-Y Growth (%) Projections by Country, 2025-2035
  • Figure 130: East Asia Market Value (USD Million) Analysis by Function, 2020-2035
  • Figure 131: East Asia Market Volume (Units) Analysis by Function, 2020-2035
  • Figure 132: East Asia Market Value Share (%) and BPS Analysis by Function, 2025-2035
  • Figure 133: East Asia Market Y-o-Y Growth (%) Projections by Function, 2025-2035
  • Figure 134: East Asia Market Value (USD Million) Analysis by Product Type, 2020-2035
  • Figure 135: East Asia Market Volume (Units) Analysis by Product Type, 2020-2035
  • Figure 136: East Asia Market Value Share (%) and BPS Analysis by Product Type, 2025-2035
  • Figure 137: East Asia Market Y-o-Y Growth (%) Projections by Product Type, 2025-2035
  • Figure 138: East Asia Market Value (USD Million) Analysis by Channel, 2020-2035
  • Figure 139: East Asia Market Volume (Units) Analysis by Channel, 2020-2035
  • Figure 140: East Asia Market Value Share (%) and BPS Analysis by Channel, 2025-2035
  • Figure 141: East Asia Market Y-o-Y Growth (%) Projections by Channel, 2025-2035
  • Figure 142: East Asia Market Value (USD Million) Analysis by Claim, 2020-2035
  • Figure 143: East Asia Market Volume (Units) Analysis by Claim, 2020-2035
  • Figure 144: East Asia Market Value Share (%) and BPS Analysis by Claim, 2025-2035
  • Figure 145: East Asia Market Y-o-Y Growth (%) Projections by Claim, 2025-2035
  • Figure 146: East Asia Market Attractiveness by Function, 2025-2035
  • Figure 147: East Asia Market Attractiveness by Product Type, 2025-2035
  • Figure 148: East Asia Market Attractiveness by Channel, 2025-2035
  • Figure 149: East Asia Market Attractiveness by Claim, 2025-2035
  • Figure 150: East Asia Market Attractiveness by Country, 2025-2035
  • Figure 151: South Asia & Pacific Market Value (USD Million) by Function, 2025-2035
  • Figure 152: South Asia & Pacific Market Value (USD Million) by Product Type, 2025-2035
  • Figure 153: South Asia & Pacific Market Value (USD Million) by Channel, 2025-2035
  • Figure 154: South Asia & Pacific Market Value (USD Million) by Claim, 2025-2035
  • Figure 155: South Asia & Pacific Market Value (USD Million) by Country, 2025-2035
  • Figure 156: South Asia & Pacific Market Value (USD Million) Analysis by Country, 2020-2035
  • Figure 157: South Asia & Pacific Market Volume (Units) Analysis by Country, 2020-2035
  • Figure 158: South Asia & Pacific Market Value Share (%) and BPS Analysis by Country, 2025-2035
  • Figure 159: South Asia & Pacific Market Y-o-Y Growth (%) Projections by Country, 2025-2035
  • Figure 160: South Asia & Pacific Market Value (USD Million) Analysis by Function, 2020-2035
  • Figure 161: South Asia & Pacific Market Volume (Units) Analysis by Function, 2020-2035
  • Figure 162: South Asia & Pacific Market Value Share (%) and BPS Analysis by Function, 2025-2035
  • Figure 163: South Asia & Pacific Market Y-o-Y Growth (%) Projections by Function, 2025-2035
  • Figure 164: South Asia & Pacific Market Value (USD Million) Analysis by Product Type, 2020-2035
  • Figure 165: South Asia & Pacific Market Volume (Units) Analysis by Product Type, 2020-2035
  • Figure 166: South Asia & Pacific Market Value Share (%) and BPS Analysis by Product Type, 2025-2035
  • Figure 167: South Asia & Pacific Market Y-o-Y Growth (%) Projections by Product Type, 2025-2035
  • Figure 168: South Asia & Pacific Market Value (USD Million) Analysis by Channel, 2020-2035
  • Figure 169: South Asia & Pacific Market Volume (Units) Analysis by Channel, 2020-2035
  • Figure 170: South Asia & Pacific Market Value Share (%) and BPS Analysis by Channel, 2025-2035
  • Figure 171: South Asia & Pacific Market Y-o-Y Growth (%) Projections by Channel, 2025-2035
  • Figure 172: South Asia & Pacific Market Value (USD Million) Analysis by Claim, 2020-2035
  • Figure 173: South Asia & Pacific Market Volume (Units) Analysis by Claim, 2020-2035
  • Figure 174: South Asia & Pacific Market Value Share (%) and BPS Analysis by Claim, 2025-2035
  • Figure 175: South Asia & Pacific Market Y-o-Y Growth (%) Projections by Claim, 2025-2035
  • Figure 176: South Asia & Pacific Market Attractiveness by Function, 2025-2035
  • Figure 177: South Asia & Pacific Market Attractiveness by Product Type, 2025-2035
  • Figure 178: South Asia & Pacific Market Attractiveness by Channel, 2025-2035
  • Figure 179: South Asia & Pacific Market Attractiveness by Claim, 2025-2035
  • Figure 180: South Asia & Pacific Market Attractiveness by Country, 2025-2035
  • Figure 181: Middle East and Africa Market Value (USD Million) by Function, 2025-2035
  • Figure 182: Middle East and Africa Market Value (USD Million) by Product Type, 2025-2035
  • Figure 183: Middle East and Africa Market Value (USD Million) by Channel, 2025-2035
  • Figure 184: Middle East and Africa Market Value (USD Million) by Claim, 2025-2035
  • Figure 185: Middle East and Africa Market Value (USD Million) by Country, 2025-2035
  • Figure 186: Middle East and Africa Market Value (USD Million) Analysis by Country, 2020-2035
  • Figure 187: Middle East and Africa Market Volume (Units) Analysis by Country, 2020-2035
  • Figure 188: Middle East and Africa Market Value Share (%) and BPS Analysis by Country, 2025-2035
  • Figure 189: Middle East and Africa Market Y-o-Y Growth (%) Projections by Country, 2025-2035
  • Figure 190: Middle East and Africa Market Value (USD Million) Analysis by Function, 2020-2035
  • Figure 191: Middle East and Africa Market Volume (Units) Analysis by Function, 2020-2035
  • Figure 192: Middle East and Africa Market Value Share (%) and BPS Analysis by Function, 2025-2035
  • Figure 193: Middle East and Africa Market Y-o-Y Growth (%) Projections by Function, 2025-2035
  • Figure 194: Middle East and Africa Market Value (USD Million) Analysis by Product Type, 2020-2035
  • Figure 195: Middle East and Africa Market Volume (Units) Analysis by Product Type, 2020-2035
  • Figure 196: Middle East and Africa Market Value Share (%) and BPS Analysis by Product Type, 2025-2035
  • Figure 197: Middle East and Africa Market Y-o-Y Growth (%) Projections by Product Type, 2025-2035
  • Figure 198: Middle East and Africa Market Value (USD Million) Analysis by Channel, 2020-2035
  • Figure 199: Middle East and Africa Market Volume (Units) Analysis by Channel, 2020-2035
  • Figure 200: Middle East and Africa Market Value Share (%) and BPS Analysis by Channel, 2025-2035
  • Figure 201: Middle East and Africa Market Y-o-Y Growth (%) Projections by Channel, 2025-2035
  • Figure 202: Middle East and Africa Market Value (USD Million) Analysis by Claim, 2020-2035
  • Figure 203: Middle East and Africa Market Volume (Units) Analysis by Claim, 2020-2035
  • Figure 204: Middle East and Africa Market Value Share (%) and BPS Analysis by Claim, 2025-2035
  • Figure 205: Middle East and Africa Market Y-o-Y Growth (%) Projections by Claim, 2025-2035
  • Figure 206: Middle East and Africa Market Attractiveness by Function, 2025-2035
  • Figure 207: Middle East and Africa Market Attractiveness by Product Type, 2025-2035
  • Figure 208: Middle East and Africa Market Attractiveness by Channel, 2025-2035
  • Figure 209: Middle East and Africa Market Attractiveness by Claim, 2025-2035
  • Figure 210: Middle East and Africa Market Attractiveness by Country, 2025-2035

Frequently Asked Questions

How big is the global Tea Tree Oil Treatments Market in 2025?

The global Tea Tree Oil Treatments Market is estimated to be valued at USD 1,285.9 million in 2025.

What will be the size of the global Tea Tree Oil Treatments Market in 2035?

The market size for the global Tea Tree Oil Treatments Market is projected to reach USD 3,972.1 million by 2035.

How much will be the global Tea Tree Oil Treatments Market growth between 2025 and 2035?

The global Tea Tree Oil Treatments Market is expected to grow at a CAGR of 11.9% between 2025 and 2035.

What are the key product types in the global Tea Tree Oil Treatments Market?

The key product types in the global Tea Tree Oil Treatments Market are serums, creams/lotions, cleansers, and spot treatments.

Which function segment will contribute a significant share in the global Tea Tree Oil Treatments Market in 2025?

In terms of function, acne/blemish care is projected to command the largest share at 59.6% in 2025, equivalent to USD 762.6 million.

Explore Similar Insights

Future Market Insights

Tea Tree Oil Treatments Market

Chat With

MaRIA

Hi There, I am MaRIA, Your Market Research Intelligence Assistant. How may I help you?