Tea Infuser Market Size and Share Forecast Outlook 2025 to 2035

The tea infuser market is projected to grow from USD 6.1 billion in 2025 to USD 10.9 billion by 2035, registering a CAGR of 5.8% during the forecast period. Sales in 2024 reached USD 5.7 billion, reflecting growing consumer preference for premium, health-focused tea accessories. This growth is being driven by evolving consumer preferences toward healthier beverage options and the growing integration of tea rituals into modern wellness lifestyles. Increased demand for convenient and aesthetically appealing brewing tools has further stimulated interest in high-quality tea infusers.
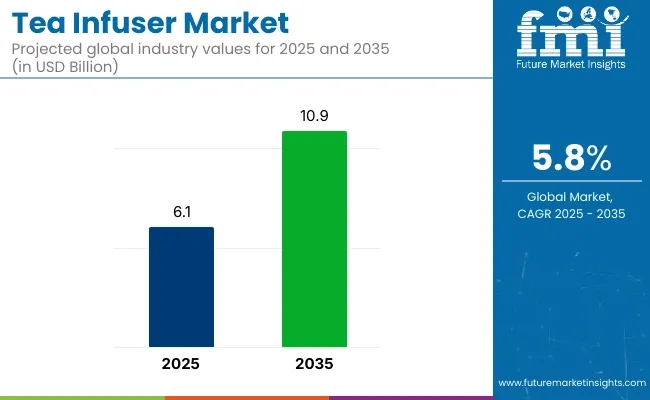
Tea Infuser Market

Metric Value
Industry Size (2025E) USD 6.1 billion
Industry Value (2035F) USD 10.9 billion
CAGR (2025 to 2035) 5.8%

Lake of the Woods Brewing Company (LOWBREWCO) has taken its innovation to a whole new scale literally. The company is proud to unveil its latest brewing advancement as Tannic Extraction & Aromatic Infusion System (T.E.A. Infuser), also known as a Giant Tea Pot, stationed at their new brewing facility on Valley Drive in Kenora, ON. This monumental piece of equipment is a key part of the production process for their newest release, Great Big Tea Hard Iced Tea, an authentic, real-brewed black tea alcoholic beverage.

The tea infuser market has increasingly aligned with sustainability values. Products made from biodegradable silicone and recyclable metals have been introduced to reduce environmental impact. Innovation has been evident in infusers featuring temperature-sensitive color changes, adjustable brewing baskets, and digital timers. Additionally, reusable infusers are being marketed as an eco-friendly alternative to disposable tea bags, positioning them as a sustainable lifestyle choice for tea consumers worldwide.

The launch of the T.E.A Infuser (Giant Tea Pot) and Great Big Tea Hard Iced Tea marks yet another bold step forward for LOWBREWCO. “We knew we wanted to create a hard iced tea that was truly brewed, not just flavoured,” said Taras Manzie, President and CEO of Lake of the Woods Brewing Company. “But in order to do that, we needed to think big-really big. It was quite an engineering feat to get this pot.”

Going forward, the tea infuser market is expected to benefit from ongoing product innovation, eco-conscious consumer behavior, and the premiumization of tea culture. Growth is likely to be accelerated in markets where artisanal and wellness-driven tea consumption is on the rise. Brands that emphasize ergonomic design, sustainable materials, and interactive user experiences are predicted to gain competitive advantage in this evolving landscape.

Analyzing Tea Infuser Market by Top Investment Segments

Metal Infusers Gain Popularity for Durability and Brewing Precision

Metal-based tea infusers, primarily made from stainless steel and aluminum, are projected to hold a 43.1% share of the tea infuser market in 2025, thanks to their long-lasting performance, ease of maintenance, and superior brewing control. Stainless steel, in particular, offers excellent corrosion resistance, heat stability, and flavor neutrality, making it ideal for daily tea preparation across home, commercial, and travel settings.
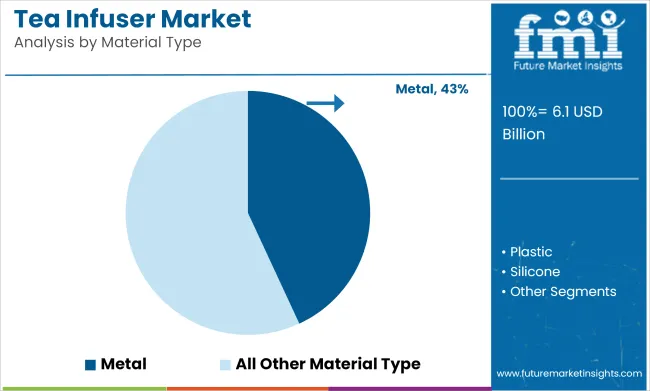
Tea Infuser Market Analysis By Material Type

Metal infusers are favored for their precision-engineered mesh or perforated designs, which allow optimal water flow while preventing fine tea particles from escaping into the cup. This results in a cleaner brew and enhances the sensory experience. Aluminum variants, often anodized for safety and aesthetic appeal, offer a lightweight yet durable alternative, especially for portable and compact infuser formats.

Additionally, metal infusers are dishwasher-safe, reusable, and resistant to staining-features that appeal to environmentally conscious consumers seeking alternatives to disposable tea bags. Many premium brands also offer elegant, minimalist designs in metallic finishes that elevate the tea-drinking ritual. As the global trend toward artisanal and loose-leaf tea consumption continues, metal tea infusers remain a trusted choice for tea enthusiasts and cafés alike, offering an ideal mix of function, form, and sustainability.

Retailers Sales Channel Projected to Lead Driven by Accessibility and Impulse Purchase

Retailers including hypermarkets, supermarkets, convenience stores, and specialty tea shops are anticipated to capture the largest distribution share in the tea infuser market by 2025, holding an estimated 37.5% market share. This dominance has been attributed to the immediate product availability, physical inspection benefits, and strong placement in both kitchenware and beverage aisles across major retail formats.
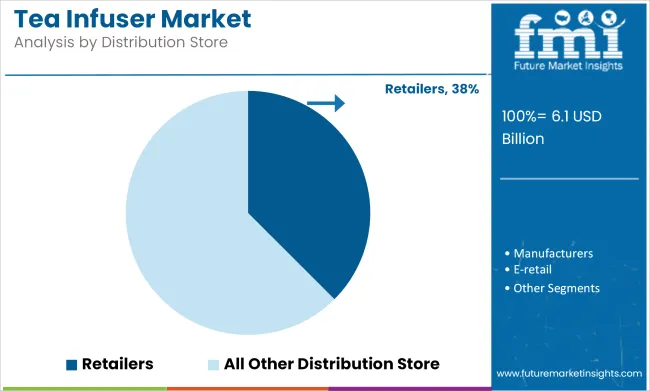
Tea Infuser Market Analysis By Distribution Store

Impulse purchases and cross-merchandising with tea products have driven high foot traffic sales, particularly in specialty stores and health-focused retail outlets where premium infusers are displayed alongside loose-leaf tea blends. Product demonstrations, bundled deals, and festive promotions have also contributed to a rise in retail-based purchases.

Retailers have offered a diverse range of infuser types-ranging from metal to silicone and novelty designs catering to gifting, seasonal collections, and household needs. The tangible shopping experience has appealed to consumers who prioritize material feel, size compatibility, and visual appeal before making a purchase.

Despite the growing rise of e-commerce, the trust and immediate gratification associated with in-store buying have ensured continued traction for retail channels. With increasing shelf space dedicated to tea and its accessories, and growing partnerships with artisanal tea brands, the retail segment is expected to remain a dominant force in global tea infuser distribution.

FMI Survey on the Tea Infuser Industry

Conventional and forward-looking investigations on the tea infuser manufacturing industry have been developed based on a broad analysis published by Future Industry Insights (FMI) on the tea infuser manufacturing industry.

One of the most intriguing things we found is that specialty teas, such as herbal and fruit infusions, are extremely popular. In this regard, manufacturers are launching newer and better products. Stakeholders emphasized that new tea infusers should be designed to enhance the consumer experience.

The study also focused on e-commerce sites for distributing tea infusers. The suppliers had a major jump in their Internet sales and ascribed the phenomenon to the convenience and broader reach afforded by web-based channels. Companies have been compelled to adapt to this trend, expanding their online presence and transitioning to consumer-to-business business models in order to reap the benefits of the emerging online industry.
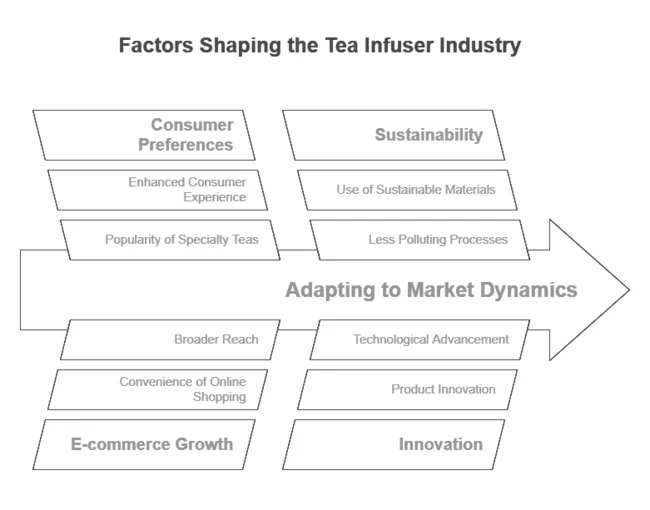
FMI Survey On The Tea Infuser Industry

Sustainability is increasingly becoming the top priority for stakeholders. With increasing awareness of environmental impact, there is a strong push for sustainable materials, there is intentional advocacy for sustainable materials and less polluting processes. Manufacturers are considering the use of biodegradable and recyclable material for tea infusers, owing to global sustainability initiatives and growing demand for green products amongst consumers.

As a result, the FMI study finds the tea infuser landscape to be a critical domain characterized by innovation, digitalization, and sustainability drives. The players are already tangentially addressing evolving consumer needs and the evolution of technology, getting themselves prepared to execute future needs seamlessly.

Industry Evolution

2020 to 2024 (Past Performance) 2025 to 2035 (Future Outlook)
The industry saw steady growth due to increasing demand for loose-leaf and herbal teas. Accelerated expansion drives the industry for premium, sustainable smart tea infusers.
By 2023, it accounted for around USD 5,300 million. Projected to rise from USD 6,142 million in 2025 to USD 10,998 million in 2035.
This is due to factors such as the shift from tea bags to loose-leaf tea, increasing awareness about health, and preference towards packaging products. This growth is attributed to an increase in demand for personalized, luxurious, and technologically integrated tea-infusing devices.
Growing Use of a BPA-free, reusable, and biodegradable tea infuser. Greater innovations in plastic-free, compostable, and premium sustainable materials.
Asia-Pacific leads the industry due to its strong tea culture, while North America and Europe see rising demand for specialty teas. Asia-Pacific continues to lead this trend, with demand for functional and wellness teas being stronger in North America and Europe.
Online sales surged due to convenience and wider product selection. E-commerce, including AI-based personal recommendations and subscription services, is driving this trend.

Government Regulations Impacting the Tea Infuser Industry

These include import and export regulations and quality standards for tea infusers. The rules vary from place to place, but they have a strong emphasis on curtailing plastic waste, maintaining food-grade safety standards, and encouraging eco-friendly alternatives. We outline below a country-wise summary of key regulations impacting the industry:

Country/Region Regulations Impacting the Tea Infuser Industry
United States Under 21 CFR regulations of the Food and Drug Administration, all materials that come into contact with food must meet safety standards for food contact. The Environmental Protection Agency (EPA) has introduced guidelines to reduce single-use plastics, encouraging manufacturers to adopt biodegradable and BPA-free materials for tea infusers.
European Union The EU single-use plastics directive bans certain plastic-based tea infusers to reduce environmental waste. REACH (Registration, Evaluation, Authorization, and Restriction of Chemicals) of the materials used for the food corresponds to hygiene standards, i.e., the materials are not toxic.
China Tea infuser materials, including plastic, silicone, and metal, are regulated by the National Food Safety Standards (GB 4806.7 to 2016) for food-contact products. Under its "Made in China 2025" sustainability strategy, the government has also advocated for environmentally friendly manufacturing.
India The guidelines of the FSSAI (Food Safety and Standards Authority of India) state that infusers made from stainless steel and silicone-based material have to meet strict standards for food-grade safety. There was also a recent ban on single-use plastics in India, which, in turn, affected the production of inexpensive plastic tea infusers.
Japan The Food Sanitation Act, however, applies to plastic and silicone tea accessories and has strict requirements to ensure all materials comply with rigorous heat-resistant and non-toxic standards. Japan is also promoting a sustainable bamboo and ceramic-based infuser.
Australia The Australian Packaging Covenant (APCO) and National Plastics Plan 2021 hope to phase out non-recyclable plastics in kitchenware by 2025, including tea infusers. The Food Standards Code (FSANZ) in Australia regulates the use of food-contact materials, including tea accessories.

Worldwide regulations are driving producers to enact sustainable and eco-sensitive materials like stainless steel, glass, bamboo, and biodegradable polymers. Countries with strict food-contact safety rules are also pushing innovation in heat-resistant and non-toxic infuser designs. Businesses seeking to grow in global industries must develop compliance systems for adapting to policies that will inevitably continue to change, especially in regard to green packaging approaches and plastic bans.

Country-Wise Analysis

United States

More importantly, a growing trend for specialty teas and the health benefits associated with them have enhanced the industry. Tea lovers are becoming more adventurous, leading to a demand for innovative tea infusers that enhance the brewing process. The sector itself leans towards durable and visually appealing infusers, with rising demand for materials such as stainless steel and silicone.

E-commerce platforms facilitate consumer access and thus promote the expansion of the industry, offering multiple types of tea infusers. To meet growing consumer demand for sustainability, reusable and eco-friendly infusers are being introduced.

United Kingdom

In the UK, tea is drunk so frequently that it is ingrained in the culture, and this makes its way into its tea infuser industry as well. Consumers overwhelmingly prefer high-end infusers that mirror their tea rituals. With the trend of artisanal and designer infusers increasing in the industry, People are beginning to care about how their infuser looks and how it functions. Fine china and stainless steel are popular materials, straddling the British balance between tradition and modernism. Additionally, specialty stores and online platforms have emerged as crucial distribution channels, providing consumers with a variety of infuser choices.

France

The cosmopolitan food culture in France has had a significant effect on its tea infuser industry. Deft infuser design further appeals to consumers, who appreciate sleek and stylish products capable of elevating the tea-making experience. As for the type of infuser, there's a strong interest in glass and porcelain infusers, objects that follow France's taste for art and refinement.

There is also growing popularity of organic and herbal teas in the industry, encouraging manufacturers to produce infusers that are suitable for these brewing types. The distribution of premium tea infusers is highly consolidated amongst boutique shops and high-end retailers.
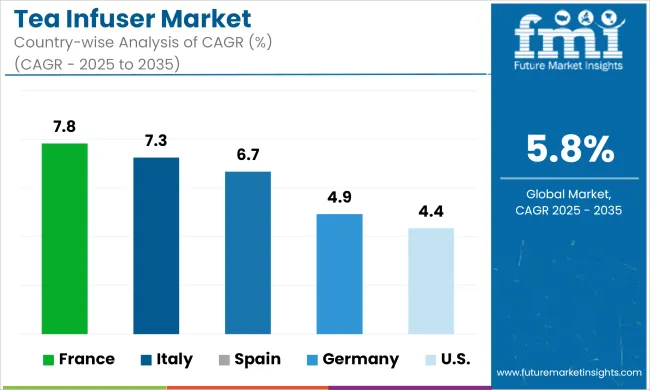
Tea Infuser Market Cagr Analysis By Country

Germany

The tea infuser industry in Germany is also pragmatic, and consumers here value functionality and durability above all else. Stainless steel infusers are especially popular because of their durability and low maintenance requirements. The industry has also welcomed new designs that are accommodating the burgeoning demand for loose-leaf and specialty teas. The growing awareness of environmental sustainability makes them a popular and reusable infuser. Consumers have access to a comprehensive selection of products through completely established online and offline retail channels.

Italy

So far, Italy is a coffee plant-dominated culture, but it has slowly increased its tea consumption, which has had an impact on the tea-infuser industry. The growing variety of tea types consumers are trying has created a demand for not just dual or trinity tea infusers, which offer the ability to steep multiple styles of tea at once, but an infuser with style as well.

Designs that marry Italian craftsmanship with contemporary functionality are especially appealing. Popular materials include ceramic and stainless steel infusers that display a harmony between long-standing tradition and modern tastes. Niche industry stores and online channels are becoming significant options for reaching Italian consumers, who are gradually changing their food preferences.

South Korea

A sub-framework of Korea's traditional tea culture in a modernized design sets the stage for the tea infuser industry. Consumers are partial to infusers who meld old with new sensibilities. The preference is heavy on simple designs made of glass and stainless steel. The growing popularity of e-commerce platforms has made them prominent distribution channels, with increasingly diverse and innovative infuser designs targeting tech-savvy consumers.

Japan

Japan's tea industry is heavily entrenched in tea ceremonies but has adapted to modern ways. Consumers appreciate infusion devices that maintain traditional aesthetics and modern convenience. Ceramics and bamboo are common materials that pay homage to Japan's natural world. Interest is also expanding to specialized infusers for different teas, including Matcha and Sencha. The distribution of tea infusers is well supported by both specialty tea shops and online retailers, catering to diverse consumer preferences.

China

China, being the birthplace of tea, has a very large and diverse tea infuser industry. While consumers cherish traditional tea-making instruments, contemporary infuser designs that fit busy lifestyles are also becoming increasingly popular. The most commonly used materials, such as porcelain, glass, and stainless steel, reflect a blend of tradition and innovation.

The industry has also witnessed a rise in portable and travel-friendly infusers, aligning with the dynamic lifestyles of younger consumers. Local brands, foreign brands, and international brands with different product variations occupy this industry.

Australia and New Zealand

A growing focus on health and wellness is also influencing the tea infuser industry in Australia and New Zealand. Consumers are also trying different herbal and specialty teas, both of which have created a demand for multipurpose, simple infusers." Stainless steel and silicone products are commonly used, as they are durable and simple to clean.

There is also a strong focus on sustainability in the industry as consumers look for eco-friendly and reusable infusers. E-commerce platforms and specialty health stores have emerged as critical distribution channels, granting consumers access to a wide variety of infuser designs.
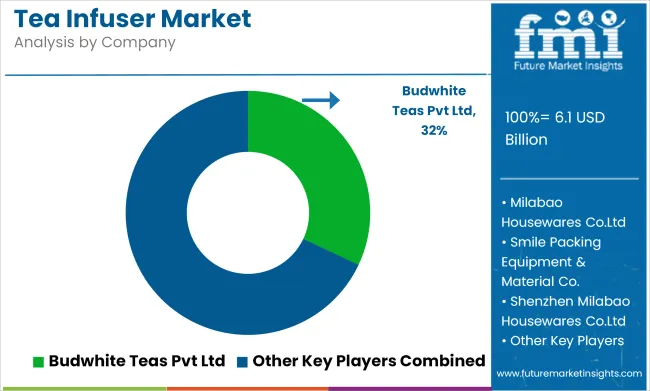
Industry Share Analysis

Tea Infuser Market Analysis By Company

Macro-economic Outlook

Tea infusers are categorized under the household kitchenware and beverage accessories segment, which forms part of the global consumer goods and lifestyle products industry. It is closely associated with macroeconomic variables, including disposable income levels, consumer spending behaviors, international trade, and raw material prices.

Economic Growth and Consumer Spending: Economic growth, especially in regions with rising disposable income, drives demand for these products. Spending, in turn, is driven by the consumer shift toward premium and specialty teas. There has been a brisk demand for good-quality brewing tools from countries with growing middle classes like China, India, and Brazil.

Prices and supply chains for raw materials: The production of tea infusers necessitates the use of stainless steel, silicone, glass, and plastic. Disruptions of the global supply chain, as have been seen in the past few years because of geopolitical conflicts and slowdowns related to the pandemic, have affected production costs and availability.

Sustainability Trend: With increasing environmental concerns and government regulations on the usage of plastic, the demand for eco-friendly and reusable fibers is growing, which in turn is making manufacturers adopt sustainable materials in products such as biodegradable plastics and stainless steel.

Key Developments

2024 was a year of dramatic consolidation and strategic realignment in the tea business with implications for the broader tea industry and, therefore, the tea infuser industry.TreeHouse Foods, Inc. has entered into a deal to acquire the private brand tea business of Harris Freeman & Co., Inc. in a transaction valued at USD 205 million to strengthen its private label offering. It seems that this purchase makes TreeHouse Foods a key player in the private label tea business, which could in turn affect the demand for tea accessories like infusers, as well.

Supreme Buys Historic Typhoo Tea for £10.2 Million Supreme has bought the traditional Typhoo Tea brand for £10.2 million, which is in line with its extensive product range. This acquisition aligns with Supreme’s diversification strategy to expand into the beverage segment. This will provide an opportunity for rebranding Typhoo Tea under new owners, which might play a role in the better consumption of tea among consumers and influence the tea infuser industry.

Planting Hope purchased from Argo Tea its managed food service agreements and university café licenses. This acquisition is expected to take Planting Hope's contract foodservice strategy to new levels, with new, cool tea products and accessories to be introduced to a growing audience.

These developments may be part of a general trend of consolidation and strategic diversification in the tea industry that may have implications for the tea industry overall and tea infuser manufacturers in particular. As tea is a favorite beverage, the demand for complementary products is largely at the nascent stage, as industry players start to incur new products like tea infusers in their portfolio, thereby capturing this opportunity.

Strategic Recommendations

Strong growth opportunities are prevalent in the tea infuser industry due to a variety of factors, such as increasing tea consumption, sustainability concerns, and product innovation. It has led consumers to seek eco-friendly and reusable infusers, paving a path for biodegradable materials like stainless steel, bamboo, and silicone. There is also more demand for high-tech options like temperature control, Bluetooth connectivity, and self-cleaning tea brews for the tech-savvy to drink.

Direct-to-consumer (DTC) sales buzz from e-commerce giants like Amazon and Shopify , as well as social media shop fronts, continue to drive the industry. Product additions that include tea and infuser bundles, product customization, and partnerships with luxury tea brands, hotels, and cafés give a lot of growth opportunities.

The companies are also innovation-orientated in the types of sustainable materials used and cross-develop into digital and emerging industries, in addition to multi-functional designs, tea-coffee hybrid infusers, and travel-friendly options. The companies are establishing additional business-to-business (B2B) partnerships with specialty tea merchants and hospitality businesses to broaden their industry reach.

New entrants in the tea infuser industry need to focus on a niche, innovate, and establish a strong brand. Instead of competing with commoditized offerings, startups can differentiate themselves based on eco-friendly materials, high-end craftsmanship, or smart technology integration. Targeting specific demographics, such as millennials, wellness seekers, or traditional tea drinkers, can also be used to strengthen industry positioning.

E-commerce and the digital industry are crucial for visibility, with sales being propelled by Amazon, Etsy, and DTC websites. Brand awareness can be enhanced through influencer collaborations on Instagram, TikTok, and YouTube. Competitive pricing, bundling infusers with loose-leaf teas or accessories, and strategic partnerships with tea brands, cafés, and subscription services will give new entrants industry momentum. Sustainability, smart features, and premium design will be the drivers of long-term success.

Key Players

  • Finum
  • Teavana
  • Adagio Teas
  • Forlife Design
  • OXO
  • Fred & Friends
  • House Again
  • Yoassi
  • LiveFresh
  • T2 Tea
  • Norpro
  • Breville
  • HIC Harold Import Co.
  • DAVIDsTEA
  • Zojirushi Corporation

Key Segmentation

By Material Type:

The industry is segmented into plastic (polyethylene terephthalate (PET), polypropylene (PP), polyethylene (PE) & polystyrene (PS)), metal (stainless steel, aluminum), silicone and fiber.

By Product Type:

It is bifurcated into a tea ball and a French press

By distribution:

Sector is fragmented into manufacturers (direct sales), distributors, retailers (hyper industries, super industries, convenience stores & specialty stores), and e-retail

By Region:

It is segmented into North America, Latin America, Western Europe, Eastern Europe, South Asia and Pacific, East Asia, and Middle East and Africa (MEA)

Table of Content

  1. Executive Summary
  2. Market Overview
  3. Market Background
  4. Global Market Analysis 2020 to 2024 and Forecast, 2025 to 2035
  5. Global Market Analysis 2020 to 2024 and Forecast 2025 to 2035, By Material Type
    • Plastic
      • Polyethylene Terephthalate (PET)
      • Polypropylene (PP)
      • Polyethylene (PE)
      • Polystyrene (PS)
    • Metal
      • Stainless Steel
      • Aluminum
    • Silicone
    • Fiber
  6. Global Market Analysis 2020 to 2024 and Forecast 2025 to 2035, By Product Type
    • Tea Ball
    • French Press
  7. Global Market Analysis 2020 to 2024 and Forecast 2025 to 2035, By Distribution Store
    • Manufacturers
    • Distributors
    • Retailers
      • Hypermarkets
      • Supermarkets
      • Convenience Stores
      • Specialty Stores
    • E-retail
  8. Global Market Analysis 2020 to 2024 and Forecast 2025 to 2035, By Region
    • North America
    • Latin America
    • Western Europe
    • Eastern Europe
    • South Asia and Pacific
    • East Asia
    • Middle East and Africa
  9. North America Market Analysis 2020 to 2024 and Forecast 2025 to 2035, By Country
  10. Latin America Market Analysis 2020 to 2024 and Forecast 2025 to 2035, By Country
  11. Western Europe Market Analysis 2020 to 2024 and Forecast 2025 to 2035, By Country
  12. Eastern Europe Market Analysis 2020 to 2024 and Forecast 2025 to 2035, By Country
  13. South Asia and Pacific Market Analysis 2020 to 2024 and Forecast 2025 to 2035, By Country
  14. East Asia Market Analysis 2020 to 2024 and Forecast 2025 to 2035, By Country
  15. Middle East and Africa Market Analysis 2020 to 2024 and Forecast 2025 to 2035, By Country
  16. Key Countries Market Analysis
  17. Market Structure Analysis
  18. Competition Analysis
    • Budwhite Teas Pvt Ltd
    • Soonway Industrial Co.Ltd
    • Milabao Housewares Co.Ltd
    • Smile Packing Equipment & Material Co.
    • Shenzhen Milabao Housewares Co.Ltd
    • Yueyang Smile Packing Equipment & Material Co. Limited
    • Loose Leaf and Strainer
    • TIELKA PTY LTD
    • Pukala Polska Sp. z o.o.
    • The Metropolitan Tea Company Ltd.
    • Teekanne GmbH & Co. KG
    • Semper Company Tea & More, SL.
  19. Assumptions & Acronyms Used
  20. Research Methodology

List of Tables

  • Table 1: Global Market Value (US$ Million) Forecast by Region, 2020 to 2035
  • Table 2: Global Market Volume (Units) Forecast by Region, 2020 to 2035
  • Table 3: Global Market Value (US$ Million) Forecast by Material Type, 2020 to 2035
  • Table 4: Global Market Volume (Units) Forecast by Material Type, 2020 to 2035
  • Table 5: Global Market Value (US$ Million) Forecast by Product Type, 2020 to 2035
  • Table 6: Global Market Volume (Units) Forecast by Product Type, 2020 to 2035
  • Table 7: Global Market Value (US$ Million) Forecast by Distribution Store, 2020 to 2035
  • Table 8: Global Market Volume (Units) Forecast by Distribution Store, 2020 to 2035
  • Table 9: North America Market Value (US$ Million) Forecast by Country, 2020 to 2035
  • Table 10: North America Market Volume (Units) Forecast by Country, 2020 to 2035
  • Table 11: North America Market Value (US$ Million) Forecast by Material Type, 2020 to 2035
  • Table 12: North America Market Volume (Units) Forecast by Material Type, 2020 to 2035
  • Table 13: North America Market Value (US$ Million) Forecast by Product Type, 2020 to 2035
  • Table 14: North America Market Volume (Units) Forecast by Product Type, 2020 to 2035
  • Table 15: North America Market Value (US$ Million) Forecast by Distribution Store, 2020 to 2035
  • Table 16: North America Market Volume (Units) Forecast by Distribution Store, 2020 to 2035
  • Table 17: Latin America Market Value (US$ Million) Forecast by Country, 2020 to 2035
  • Table 18: Latin America Market Volume (Units) Forecast by Country, 2020 to 2035
  • Table 19: Latin America Market Value (US$ Million) Forecast by Material Type, 2020 to 2035
  • Table 20: Latin America Market Volume (Units) Forecast by Material Type, 2020 to 2035
  • Table 21: Latin America Market Value (US$ Million) Forecast by Product Type, 2020 to 2035
  • Table 22: Latin America Market Volume (Units) Forecast by Product Type, 2020 to 2035
  • Table 23: Latin America Market Value (US$ Million) Forecast by Distribution Store, 2020 to 2035
  • Table 24: Latin America Market Volume (Units) Forecast by Distribution Store, 2020 to 2035
  • Table 25: Western Europe Market Value (US$ Million) Forecast by Country, 2020 to 2035
  • Table 26: Western Europe Market Volume (Units) Forecast by Country, 2020 to 2035
  • Table 27: Western Europe Market Value (US$ Million) Forecast by Material Type, 2020 to 2035
  • Table 28: Western Europe Market Volume (Units) Forecast by Material Type, 2020 to 2035
  • Table 29: Western Europe Market Value (US$ Million) Forecast by Product Type, 2020 to 2035
  • Table 30: Western Europe Market Volume (Units) Forecast by Product Type, 2020 to 2035
  • Table 31: Western Europe Market Value (US$ Million) Forecast by Distribution Store, 2020 to 2035
  • Table 32: Western Europe Market Volume (Units) Forecast by Distribution Store, 2020 to 2035
  • Table 33: Eastern Europe Market Value (US$ Million) Forecast by Country, 2020 to 2035
  • Table 34: Eastern Europe Market Volume (Units) Forecast by Country, 2020 to 2035
  • Table 35: Eastern Europe Market Value (US$ Million) Forecast by Material Type, 2020 to 2035
  • Table 36: Eastern Europe Market Volume (Units) Forecast by Material Type, 2020 to 2035
  • Table 37: Eastern Europe Market Value (US$ Million) Forecast by Product Type, 2020 to 2035
  • Table 38: Eastern Europe Market Volume (Units) Forecast by Product Type, 2020 to 2035
  • Table 39: Eastern Europe Market Value (US$ Million) Forecast by Distribution Store, 2020 to 2035
  • Table 40: Eastern Europe Market Volume (Units) Forecast by Distribution Store, 2020 to 2035
  • Table 41: South Asia and Pacific Market Value (US$ Million) Forecast by Country, 2020 to 2035
  • Table 42: South Asia and Pacific Market Volume (Units) Forecast by Country, 2020 to 2035
  • Table 43: South Asia and Pacific Market Value (US$ Million) Forecast by Material Type, 2020 to 2035
  • Table 44: South Asia and Pacific Market Volume (Units) Forecast by Material Type, 2020 to 2035
  • Table 45: South Asia and Pacific Market Value (US$ Million) Forecast by Product Type, 2020 to 2035
  • Table 46: South Asia and Pacific Market Volume (Units) Forecast by Product Type, 2020 to 2035
  • Table 47: South Asia and Pacific Market Value (US$ Million) Forecast by Distribution Store, 2020 to 2035
  • Table 48: South Asia and Pacific Market Volume (Units) Forecast by Distribution Store, 2020 to 2035
  • Table 49: East Asia Market Value (US$ Million) Forecast by Country, 2020 to 2035
  • Table 50: East Asia Market Volume (Units) Forecast by Country, 2020 to 2035
  • Table 51: East Asia Market Value (US$ Million) Forecast by Material Type, 2020 to 2035
  • Table 52: East Asia Market Volume (Units) Forecast by Material Type, 2020 to 2035
  • Table 53: East Asia Market Value (US$ Million) Forecast by Product Type, 2020 to 2035
  • Table 54: East Asia Market Volume (Units) Forecast by Product Type, 2020 to 2035
  • Table 55: East Asia Market Value (US$ Million) Forecast by Distribution Store, 2020 to 2035
  • Table 56: East Asia Market Volume (Units) Forecast by Distribution Store, 2020 to 2035
  • Table 57: Middle East and Africa Market Value (US$ Million) Forecast by Country, 2020 to 2035
  • Table 58: Middle East and Africa Market Volume (Units) Forecast by Country, 2020 to 2035
  • Table 59: Middle East and Africa Market Value (US$ Million) Forecast by Material Type, 2020 to 2035
  • Table 60: Middle East and Africa Market Volume (Units) Forecast by Material Type, 2020 to 2035
  • Table 61: Middle East and Africa Market Value (US$ Million) Forecast by Product Type, 2020 to 2035
  • Table 62: Middle East and Africa Market Volume (Units) Forecast by Product Type, 2020 to 2035
  • Table 63: Middle East and Africa Market Value (US$ Million) Forecast by Distribution Store, 2020 to 2035
  • Table 64: Middle East and Africa Market Volume (Units) Forecast by Distribution Store, 2020 to 2035

List of Figures

  • Figure 1: Global Market Value (US$ Million) by Material Type, 2025 to 2035
  • Figure 2: Global Market Value (US$ Million) by Product Type, 2025 to 2035
  • Figure 3: Global Market Value (US$ Million) by Distribution Store, 2025 to 2035
  • Figure 4: Global Market Value (US$ Million) by Region, 2025 to 2035
  • Figure 5: Global Market Value (US$ Million) Analysis by Region, 2020 to 2035
  • Figure 6: Global Market Volume (Units) Analysis by Region, 2020 to 2035
  • Figure 7: Global Market Value Share (%) and BPS Analysis by Region, 2025 to 2035
  • Figure 8: Global Market Y-o-Y Growth (%) Projections by Region, 2025 to 2035
  • Figure 9: Global Market Value (US$ Million) Analysis by Material Type, 2020 to 2035
  • Figure 10: Global Market Volume (Units) Analysis by Material Type, 2020 to 2035
  • Figure 11: Global Market Value Share (%) and BPS Analysis by Material Type, 2025 to 2035
  • Figure 12: Global Market Y-o-Y Growth (%) Projections by Material Type, 2025 to 2035
  • Figure 13: Global Market Value (US$ Million) Analysis by Product Type, 2020 to 2035
  • Figure 14: Global Market Volume (Units) Analysis by Product Type, 2020 to 2035
  • Figure 15: Global Market Value Share (%) and BPS Analysis by Product Type, 2025 to 2035
  • Figure 16: Global Market Y-o-Y Growth (%) Projections by Product Type, 2025 to 2035
  • Figure 17: Global Market Value (US$ Million) Analysis by Distribution Store, 2020 to 2035
  • Figure 18: Global Market Volume (Units) Analysis by Distribution Store, 2020 to 2035
  • Figure 19: Global Market Value Share (%) and BPS Analysis by Distribution Store, 2025 to 2035
  • Figure 20: Global Market Y-o-Y Growth (%) Projections by Distribution Store, 2025 to 2035
  • Figure 21: Global Market Attractiveness by Material Type, 2025 to 2035
  • Figure 22: Global Market Attractiveness by Product Type, 2025 to 2035
  • Figure 23: Global Market Attractiveness by Distribution Store, 2025 to 2035
  • Figure 24: Global Market Attractiveness by Region, 2025 to 2035
  • Figure 25: North America Market Value (US$ Million) by Material Type, 2025 to 2035
  • Figure 26: North America Market Value (US$ Million) by Product Type, 2025 to 2035
  • Figure 27: North America Market Value (US$ Million) by Distribution Store, 2025 to 2035
  • Figure 28: North America Market Value (US$ Million) by Country, 2025 to 2035
  • Figure 29: North America Market Value (US$ Million) Analysis by Country, 2020 to 2035
  • Figure 30: North America Market Volume (Units) Analysis by Country, 2020 to 2035
  • Figure 31: North America Market Value Share (%) and BPS Analysis by Country, 2025 to 2035
  • Figure 32: North America Market Y-o-Y Growth (%) Projections by Country, 2025 to 2035
  • Figure 33: North America Market Value (US$ Million) Analysis by Material Type, 2020 to 2035
  • Figure 34: North America Market Volume (Units) Analysis by Material Type, 2020 to 2035
  • Figure 35: North America Market Value Share (%) and BPS Analysis by Material Type, 2025 to 2035
  • Figure 36: North America Market Y-o-Y Growth (%) Projections by Material Type, 2025 to 2035
  • Figure 37: North America Market Value (US$ Million) Analysis by Product Type, 2020 to 2035
  • Figure 38: North America Market Volume (Units) Analysis by Product Type, 2020 to 2035
  • Figure 39: North America Market Value Share (%) and BPS Analysis by Product Type, 2025 to 2035
  • Figure 40: North America Market Y-o-Y Growth (%) Projections by Product Type, 2025 to 2035
  • Figure 41: North America Market Value (US$ Million) Analysis by Distribution Store, 2020 to 2035
  • Figure 42: North America Market Volume (Units) Analysis by Distribution Store, 2020 to 2035
  • Figure 43: North America Market Value Share (%) and BPS Analysis by Distribution Store, 2025 to 2035
  • Figure 44: North America Market Y-o-Y Growth (%) Projections by Distribution Store, 2025 to 2035
  • Figure 45: North America Market Attractiveness by Material Type, 2025 to 2035
  • Figure 46: North America Market Attractiveness by Product Type, 2025 to 2035
  • Figure 47: North America Market Attractiveness by Distribution Store, 2025 to 2035
  • Figure 48: North America Market Attractiveness by Country, 2025 to 2035
  • Figure 49: Latin America Market Value (US$ Million) by Material Type, 2025 to 2035
  • Figure 50: Latin America Market Value (US$ Million) by Product Type, 2025 to 2035
  • Figure 51: Latin America Market Value (US$ Million) by Distribution Store, 2025 to 2035
  • Figure 52: Latin America Market Value (US$ Million) by Country, 2025 to 2035
  • Figure 53: Latin America Market Value (US$ Million) Analysis by Country, 2020 to 2035
  • Figure 54: Latin America Market Volume (Units) Analysis by Country, 2020 to 2035
  • Figure 55: Latin America Market Value Share (%) and BPS Analysis by Country, 2025 to 2035
  • Figure 56: Latin America Market Y-o-Y Growth (%) Projections by Country, 2025 to 2035
  • Figure 57: Latin America Market Value (US$ Million) Analysis by Material Type, 2020 to 2035
  • Figure 58: Latin America Market Volume (Units) Analysis by Material Type, 2020 to 2035
  • Figure 59: Latin America Market Value Share (%) and BPS Analysis by Material Type, 2025 to 2035
  • Figure 60: Latin America Market Y-o-Y Growth (%) Projections by Material Type, 2025 to 2035
  • Figure 61: Latin America Market Value (US$ Million) Analysis by Product Type, 2020 to 2035
  • Figure 62: Latin America Market Volume (Units) Analysis by Product Type, 2020 to 2035
  • Figure 63: Latin America Market Value Share (%) and BPS Analysis by Product Type, 2025 to 2035
  • Figure 64: Latin America Market Y-o-Y Growth (%) Projections by Product Type, 2025 to 2035
  • Figure 65: Latin America Market Value (US$ Million) Analysis by Distribution Store, 2020 to 2035
  • Figure 66: Latin America Market Volume (Units) Analysis by Distribution Store, 2020 to 2035
  • Figure 67: Latin America Market Value Share (%) and BPS Analysis by Distribution Store, 2025 to 2035
  • Figure 68: Latin America Market Y-o-Y Growth (%) Projections by Distribution Store, 2025 to 2035
  • Figure 69: Latin America Market Attractiveness by Material Type, 2025 to 2035
  • Figure 70: Latin America Market Attractiveness by Product Type, 2025 to 2035
  • Figure 71: Latin America Market Attractiveness by Distribution Store, 2025 to 2035
  • Figure 72: Latin America Market Attractiveness by Country, 2025 to 2035
  • Figure 73: Western Europe Market Value (US$ Million) by Material Type, 2025 to 2035
  • Figure 74: Western Europe Market Value (US$ Million) by Product Type, 2025 to 2035
  • Figure 75: Western Europe Market Value (US$ Million) by Distribution Store, 2025 to 2035
  • Figure 76: Western Europe Market Value (US$ Million) by Country, 2025 to 2035
  • Figure 77: Western Europe Market Value (US$ Million) Analysis by Country, 2020 to 2035
  • Figure 78: Western Europe Market Volume (Units) Analysis by Country, 2020 to 2035
  • Figure 79: Western Europe Market Value Share (%) and BPS Analysis by Country, 2025 to 2035
  • Figure 80: Western Europe Market Y-o-Y Growth (%) Projections by Country, 2025 to 2035
  • Figure 81: Western Europe Market Value (US$ Million) Analysis by Material Type, 2020 to 2035
  • Figure 82: Western Europe Market Volume (Units) Analysis by Material Type, 2020 to 2035
  • Figure 83: Western Europe Market Value Share (%) and BPS Analysis by Material Type, 2025 to 2035
  • Figure 84: Western Europe Market Y-o-Y Growth (%) Projections by Material Type, 2025 to 2035
  • Figure 85: Western Europe Market Value (US$ Million) Analysis by Product Type, 2020 to 2035
  • Figure 86: Western Europe Market Volume (Units) Analysis by Product Type, 2020 to 2035
  • Figure 87: Western Europe Market Value Share (%) and BPS Analysis by Product Type, 2025 to 2035
  • Figure 88: Western Europe Market Y-o-Y Growth (%) Projections by Product Type, 2025 to 2035
  • Figure 89: Western Europe Market Value (US$ Million) Analysis by Distribution Store, 2020 to 2035
  • Figure 90: Western Europe Market Volume (Units) Analysis by Distribution Store, 2020 to 2035
  • Figure 91: Western Europe Market Value Share (%) and BPS Analysis by Distribution Store, 2025 to 2035
  • Figure 92: Western Europe Market Y-o-Y Growth (%) Projections by Distribution Store, 2025 to 2035
  • Figure 93: Western Europe Market Attractiveness by Material Type, 2025 to 2035
  • Figure 94: Western Europe Market Attractiveness by Product Type, 2025 to 2035
  • Figure 95: Western Europe Market Attractiveness by Distribution Store, 2025 to 2035
  • Figure 96: Western Europe Market Attractiveness by Country, 2025 to 2035
  • Figure 97: Eastern Europe Market Value (US$ Million) by Material Type, 2025 to 2035
  • Figure 98: Eastern Europe Market Value (US$ Million) by Product Type, 2025 to 2035
  • Figure 99: Eastern Europe Market Value (US$ Million) by Distribution Store, 2025 to 2035
  • Figure 100: Eastern Europe Market Value (US$ Million) by Country, 2025 to 2035
  • Figure 101: Eastern Europe Market Value (US$ Million) Analysis by Country, 2020 to 2035
  • Figure 102: Eastern Europe Market Volume (Units) Analysis by Country, 2020 to 2035
  • Figure 103: Eastern Europe Market Value Share (%) and BPS Analysis by Country, 2025 to 2035
  • Figure 104: Eastern Europe Market Y-o-Y Growth (%) Projections by Country, 2025 to 2035
  • Figure 105: Eastern Europe Market Value (US$ Million) Analysis by Material Type, 2020 to 2035
  • Figure 106: Eastern Europe Market Volume (Units) Analysis by Material Type, 2020 to 2035
  • Figure 107: Eastern Europe Market Value Share (%) and BPS Analysis by Material Type, 2025 to 2035
  • Figure 108: Eastern Europe Market Y-o-Y Growth (%) Projections by Material Type, 2025 to 2035
  • Figure 109: Eastern Europe Market Value (US$ Million) Analysis by Product Type, 2020 to 2035
  • Figure 110: Eastern Europe Market Volume (Units) Analysis by Product Type, 2020 to 2035
  • Figure 111: Eastern Europe Market Value Share (%) and BPS Analysis by Product Type, 2025 to 2035
  • Figure 112: Eastern Europe Market Y-o-Y Growth (%) Projections by Product Type, 2025 to 2035
  • Figure 113: Eastern Europe Market Value (US$ Million) Analysis by Distribution Store, 2020 to 2035
  • Figure 114: Eastern Europe Market Volume (Units) Analysis by Distribution Store, 2020 to 2035
  • Figure 115: Eastern Europe Market Value Share (%) and BPS Analysis by Distribution Store, 2025 to 2035
  • Figure 116: Eastern Europe Market Y-o-Y Growth (%) Projections by Distribution Store, 2025 to 2035
  • Figure 117: Eastern Europe Market Attractiveness by Material Type, 2025 to 2035
  • Figure 118: Eastern Europe Market Attractiveness by Product Type, 2025 to 2035
  • Figure 119: Eastern Europe Market Attractiveness by Distribution Store, 2025 to 2035
  • Figure 120: Eastern Europe Market Attractiveness by Country, 2025 to 2035
  • Figure 121: South Asia and Pacific Market Value (US$ Million) by Material Type, 2025 to 2035
  • Figure 122: South Asia and Pacific Market Value (US$ Million) by Product Type, 2025 to 2035
  • Figure 123: South Asia and Pacific Market Value (US$ Million) by Distribution Store, 2025 to 2035
  • Figure 124: South Asia and Pacific Market Value (US$ Million) by Country, 2025 to 2035
  • Figure 125: South Asia and Pacific Market Value (US$ Million) Analysis by Country, 2020 to 2035
  • Figure 126: South Asia and Pacific Market Volume (Units) Analysis by Country, 2020 to 2035
  • Figure 127: South Asia and Pacific Market Value Share (%) and BPS Analysis by Country, 2025 to 2035
  • Figure 128: South Asia and Pacific Market Y-o-Y Growth (%) Projections by Country, 2025 to 2035
  • Figure 129: South Asia and Pacific Market Value (US$ Million) Analysis by Material Type, 2020 to 2035
  • Figure 130: South Asia and Pacific Market Volume (Units) Analysis by Material Type, 2020 to 2035
  • Figure 131: South Asia and Pacific Market Value Share (%) and BPS Analysis by Material Type, 2025 to 2035
  • Figure 132: South Asia and Pacific Market Y-o-Y Growth (%) Projections by Material Type, 2025 to 2035
  • Figure 133: South Asia and Pacific Market Value (US$ Million) Analysis by Product Type, 2020 to 2035
  • Figure 134: South Asia and Pacific Market Volume (Units) Analysis by Product Type, 2020 to 2035
  • Figure 135: South Asia and Pacific Market Value Share (%) and BPS Analysis by Product Type, 2025 to 2035
  • Figure 136: South Asia and Pacific Market Y-o-Y Growth (%) Projections by Product Type, 2025 to 2035
  • Figure 137: South Asia and Pacific Market Value (US$ Million) Analysis by Distribution Store, 2020 to 2035
  • Figure 138: South Asia and Pacific Market Volume (Units) Analysis by Distribution Store, 2020 to 2035
  • Figure 139: South Asia and Pacific Market Value Share (%) and BPS Analysis by Distribution Store, 2025 to 2035
  • Figure 140: South Asia and Pacific Market Y-o-Y Growth (%) Projections by Distribution Store, 2025 to 2035
  • Figure 141: South Asia and Pacific Market Attractiveness by Material Type, 2025 to 2035
  • Figure 142: South Asia and Pacific Market Attractiveness by Product Type, 2025 to 2035
  • Figure 143: South Asia and Pacific Market Attractiveness by Distribution Store, 2025 to 2035
  • Figure 144: South Asia and Pacific Market Attractiveness by Country, 2025 to 2035
  • Figure 145: East Asia Market Value (US$ Million) by Material Type, 2025 to 2035
  • Figure 146: East Asia Market Value (US$ Million) by Product Type, 2025 to 2035
  • Figure 147: East Asia Market Value (US$ Million) by Distribution Store, 2025 to 2035
  • Figure 148: East Asia Market Value (US$ Million) by Country, 2025 to 2035
  • Figure 149: East Asia Market Value (US$ Million) Analysis by Country, 2020 to 2035
  • Figure 150: East Asia Market Volume (Units) Analysis by Country, 2020 to 2035
  • Figure 151: East Asia Market Value Share (%) and BPS Analysis by Country, 2025 to 2035
  • Figure 152: East Asia Market Y-o-Y Growth (%) Projections by Country, 2025 to 2035
  • Figure 153: East Asia Market Value (US$ Million) Analysis by Material Type, 2020 to 2035
  • Figure 154: East Asia Market Volume (Units) Analysis by Material Type, 2020 to 2035
  • Figure 155: East Asia Market Value Share (%) and BPS Analysis by Material Type, 2025 to 2035
  • Figure 156: East Asia Market Y-o-Y Growth (%) Projections by Material Type, 2025 to 2035
  • Figure 157: East Asia Market Value (US$ Million) Analysis by Product Type, 2020 to 2035
  • Figure 158: East Asia Market Volume (Units) Analysis by Product Type, 2020 to 2035
  • Figure 159: East Asia Market Value Share (%) and BPS Analysis by Product Type, 2025 to 2035
  • Figure 160: East Asia Market Y-o-Y Growth (%) Projections by Product Type, 2025 to 2035
  • Figure 161: East Asia Market Value (US$ Million) Analysis by Distribution Store, 2020 to 2035
  • Figure 162: East Asia Market Volume (Units) Analysis by Distribution Store, 2020 to 2035
  • Figure 163: East Asia Market Value Share (%) and BPS Analysis by Distribution Store, 2025 to 2035
  • Figure 164: East Asia Market Y-o-Y Growth (%) Projections by Distribution Store, 2025 to 2035
  • Figure 165: East Asia Market Attractiveness by Material Type, 2025 to 2035
  • Figure 166: East Asia Market Attractiveness by Product Type, 2025 to 2035
  • Figure 167: East Asia Market Attractiveness by Distribution Store, 2025 to 2035
  • Figure 168: East Asia Market Attractiveness by Country, 2025 to 2035
  • Figure 169: Middle East and Africa Market Value (US$ Million) by Material Type, 2025 to 2035
  • Figure 170: Middle East and Africa Market Value (US$ Million) by Product Type, 2025 to 2035
  • Figure 171: Middle East and Africa Market Value (US$ Million) by Distribution Store, 2025 to 2035
  • Figure 172: Middle East and Africa Market Value (US$ Million) by Country, 2025 to 2035
  • Figure 173: Middle East and Africa Market Value (US$ Million) Analysis by Country, 2020 to 2035
  • Figure 174: Middle East and Africa Market Volume (Units) Analysis by Country, 2020 to 2035
  • Figure 175: Middle East and Africa Market Value Share (%) and BPS Analysis by Country, 2025 to 2035
  • Figure 176: Middle East and Africa Market Y-o-Y Growth (%) Projections by Country, 2025 to 2035
  • Figure 177: Middle East and Africa Market Value (US$ Million) Analysis by Material Type, 2020 to 2035
  • Figure 178: Middle East and Africa Market Volume (Units) Analysis by Material Type, 2020 to 2035
  • Figure 179: Middle East and Africa Market Value Share (%) and BPS Analysis by Material Type, 2025 to 2035
  • Figure 180: Middle East and Africa Market Y-o-Y Growth (%) Projections by Material Type, 2025 to 2035
  • Figure 181: Middle East and Africa Market Value (US$ Million) Analysis by Product Type, 2020 to 2035
  • Figure 182: Middle East and Africa Market Volume (Units) Analysis by Product Type, 2020 to 2035
  • Figure 183: Middle East and Africa Market Value Share (%) and BPS Analysis by Product Type, 2025 to 2035
  • Figure 184: Middle East and Africa Market Y-o-Y Growth (%) Projections by Product Type, 2025 to 2035
  • Figure 185: Middle East and Africa Market Value (US$ Million) Analysis by Distribution Store, 2020 to 2035
  • Figure 186: Middle East and Africa Market Volume (Units) Analysis by Distribution Store, 2020 to 2035
  • Figure 187: Middle East and Africa Market Value Share (%) and BPS Analysis by Distribution Store, 2025 to 2035
  • Figure 188: Middle East and Africa Market Y-o-Y Growth (%) Projections by Distribution Store, 2025 to 2035
  • Figure 189: Middle East and Africa Market Attractiveness by Material Type, 2025 to 2035
  • Figure 190: Middle East and Africa Market Attractiveness by Product Type, 2025 to 2035
  • Figure 191: Middle East and Africa Market Attractiveness by Distribution Store, 2025 to 2035
  • Figure 192: Middle East and Africa Market Attractiveness by Country, 2025 to 2035

Frequently Asked Questions

What is the tea infuser industry demand ?

The industry is driven by increasing tea consumption, growing sustainability concerns, and product innovations.

What are the materials most commonly used for tea infusers?

Stainless steel, silicone, bamboo, and biodegradable plastics.

What advances are smart tea infusers bringing to the industry?

Convenience is maximized with temperature control, Bluetooth  connectivity, and self-cleaning features.

Where do most consumers buy these infusers?

Internet retailers like Amazon, specialty tea shops, grocery stores, and  home goods retailers.

Are there any new developments in tea infuser designs?

Hybrid tea-coffee infusers, which can be user-programmable or designed with luxury features, are now available.

Explore Similar Insights

Future Market Insights

Tea Infuser Market