Reports

- Global Locations -

Headquarters

Future Market Insights, Inc.

Christiana Corporate, 200
Continental Drive, Suite 401,
Newark, Delaware - 19713,
United States

T: +1-845-579-5705

Americas

Future Market Insights, Inc.

616 Corporate Way, Suite 2-9018,
Valley Cottage, NY 10989, United States

T: +1-347-918-3531

MEA

Future Market Insights

1602-6 Jumeirah Bay X2 Tower, Plot No: JLT-PH2-X2A,
Jumeirah Lakes Towers, Dubai,
United Arab Emirates

Europe

Future Market Insights

3rd Floor, 207 Regent Street,
W1B 3HH London
United Kingdom

T: + 44 (0) 20 8123 9659
D: +44 (0) 20 3287 4268

Asia Pacific

Future Market Insights

IndiaLand Global Tech Park, Unit UG-1, Behind Grand HighStreet, Phase 1, Hinjawadi, MH, Pune – 411057, India

Tea Packing Machine Market Outlook (2023 to 2033)

The global tea packing machine market is set to enjoy a valuation of US$ 858.46 million in 2023 and is expected to record a CAGR of 5.8% between 2023 and 2033, totaling around US$ 1,508.61 million by 2033. Rising consumption of various teas, along with the adoption of advanced packaging machines driving demand for tea packing machines in the market.

Based on the machine type, the form-fill-seal equipment segment is projected to remain the most lucrative, creating an incremental opportunity of US$ 199.4 million between 2023 and 2033. The reason behind this is efficient sealing and product protection by these machines.

Emerging trends reveal that rapid penetration of automation across industries may boost tea packing machine sales during the next ten years, with the overall market creating an absolute incremental growth opportunity of US$ 606.7 million.

Tea packing machines are designed for packaging various teas, including green, black, herbal, and scented tea. These machines tend to fully complete weighing, filling, bag making, and sealing. Over the years, the growing need for improving productivity and the rising consumption of tea has prompted manufacturers to employ tea packaging machine types like form-fill-seal equipment, filling & dosing equipment, cartooning equipment, case packing, sealers, and wrapping and bundling equipment.

These machines help businesses to increase overall productivity, reduce costs, enhance safety for workers, and preserve the quality of packed tea. Demand is especially high for automatic tea packaging machines that fill based on weight and pack the bag automatically.

The rising popularity of these automatic tea packaging machines, along with a surge in new startups dealing with the tea business, is expected to boost the growth of the global tea packing machine market. Similarly, increasing consumption of green tea and several other herbal teas to improve health and prevent diseases is likely to expand the market size.

Tea Packing Machine Industry (From 2018 to 2022)

Attribute Details
CAGR 4.5%
Market Size - 2018 US$ 661.78 million
Market Size - 2022 US$ 789.18 million

Tea Packing Machine Industry (From 2023 to 2033)

Attribute Details
CAGR 5.8%
Market Size – 2023 US$ 858.46 million
Market Size - 2033 US$ 1,508.61 million

Don't pay for what you don't need

Customize your report by selecting specific countries or regions and save 30%!

From 2018 to 2022 Tea Packing Machine Outlook Compared Between 2023 and 2033 Forecast

The global tea packing machine market witnessed an HCAGR of 4.5% during 2018 and 2022, reaching US$ 789.18 million in 2022. With manufacturers' growing adoption of various tea packing machine types, the overall demand is slated to increase at 5.8% CAGR between 2023 and 2033.

Packing is a significant source of value addition in the tea industry. The tea packing machine market consists of different machines such as form fill-seal equipment, filling & dosing equipment, cartoning equipment, etc.

The chance of errors and mistakes is high in manual packing. In addition, it is also expensive and time-consuming. Compared to it, tea packing machines can quickly pack many tea leaves into sachets, packets, etc.

These machines ensure that the taste of the tea is preserved consistently and the natural characteristics of the tea are maintained. Tea packing machines are important in efficiently packing and sealing the packages to safeguard and sustain tea.

The rise in the export of tea worldwide, the growing need for increasing productivity, and the increasing tea consumption is expected to propel the tea packing machine market growth during the forecast period.

Adaptable Tea Packing Machines Set the Trend

Growing Demand for the Lightweight Tea Packaging Boosting Tea Packing Machine Market Growth

Tea packing machines are manufactured to produce lightweight packs, which end users can easily transport and use. One-time tea packets have increased the consumption of tea worldwide.

Tea packing machines are constructed and arranged in an accessible way, which makes operation easy. Automation of the device helps in preparing lightweight packing with consistency.

Tea is a favorite beverage in several countries. One of the factors of increased consumption is the easy availability of different packed tea products. Thus, the demand for lightweight tea packaging may continue to boost the tea packing machine market.

Surging Demand for Tea Packing that Maintains the Freshness and Aroma of the Tea Fueling Adoption of Tea Packing Machines

Tea packing plays an important role in the demand for tea. Tea packing helps in maintaining the freshness and fragrance of the tea. If the freshness is lost due to improper packing, it affects the tea's taste while consumed.

The tea packing machine manufacturers are focusing on tea packing to protect the tea leaves from light and air. When the machines pack, it ensures that the product is sealed efficiently and helps reduce the chances of errors.

Ismail Sutaria
Ismail Sutaria

Principal Consultant

Talk to Analyst

Find your sweet spots for generating winning opportunities in this market.

Category-wise Outlook

Segment Machine Type
Segment Name Form Fill-seal Equipment
Details CAGR - 6.1%, Share - 31%
Segment Application
Segment Name Tea Pouches
Details CAGR - 7.0%

Machine-Type Tea Packing Machines Poised for Majority Market Hold

Demand for Form Fill-seal Equipment to Remain High in the Global Tea Machine Market

Based on the machine type, the form-fill-seal equipment segment holds a significant share of the global tea-packing machine market. The targeted segment is projected to hold around 31% of the market share in 2023 and expand at 6.1% CAGR throughout the forecast period.

Form fill-seal equipment forms a package, stuffs the product inside, and seals it. The seal can be done vertically or horizontally. The tea leaves must be kept in the seal packed as the aroma and freshness are very important.

Form fill-seal equipment has a substantial share in the machine segment as it eliminates human error. It helps in increasing the efficiency and quality of the process. Thus, due to added advantages, as compared to other machine types of tea packing machines, the demand for form-fill-seal equipment is very high in the global market.

Tea Pouches to Contribute Most to the Global Tea Packing Machine Market in 2023 & Beyond

Tea pouches have a considerable market share in the application segment in the tea packing machine market. They are projected to have exponential growth of 2.1 times compared to the current sales during the forecast period.

Tea pouch packaging is the ideal and best packaging format for tea packing due to its higher flexibility. Tea pouches are the most flexible and space-saving solution and help in logistics and supply chains.

Tea pouch packaging is considered the most cost-efficient tea packing, as the material for the tea pouches is extremely inexpensive. Moreover, with one of the most flexible options, pouches are also an attractive and sustainable solution. Due to various benefits, the tea packing machine has the most end application of pouches. FMI predicts the tea pouches segment to record a 7.0% CAGR during the forecast period.

Regional Outlook

The Catalysts for Heightened Demand of Packing Machines in Germany

Rising Consumption of Various Teas Creating Demand for Tea Packing Machines in Germany

Attribute Details
Market CAGR (From 2023 to 2033) 3.9%
Market Size - 2033 US$ 89.15 million

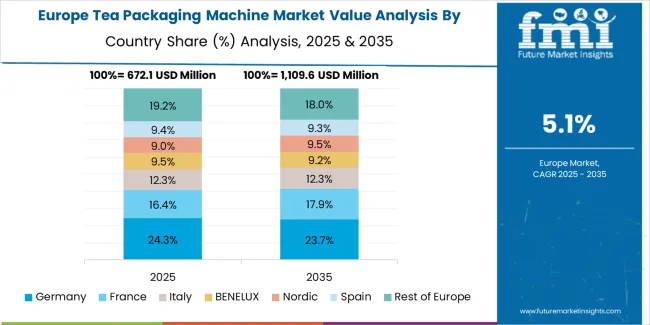
Germany’s tea specialties are popular worldwide and are supplied to more than 108 countries due to their high quality. According to The German Tea Association, the demand for tea grew in 2020. The per capita tea consumption was recorded as 28 liters and around 19,200 tons of black & green tea were consumed. In comparison, the demand for herbal and fruit infusions was seen growing to 42 liters per capita consumption in the year 2020.

This rising demand for tea is to boost the sales of tea packing machines across the country during the forecast period.

As per FMI, Germany’s tea packing machine market is projected to develop at 3.9% CAGR between 2023 and 2033, advancing a valuation of around US$ 89.15 million by 2033.

Rise in Tea Export Driving Growth in the Indian Market

Attribute Details
Market CAGR (From 2023 to 2033) 5.4%
Market - Incremental Opportunity US$ 49.64 million

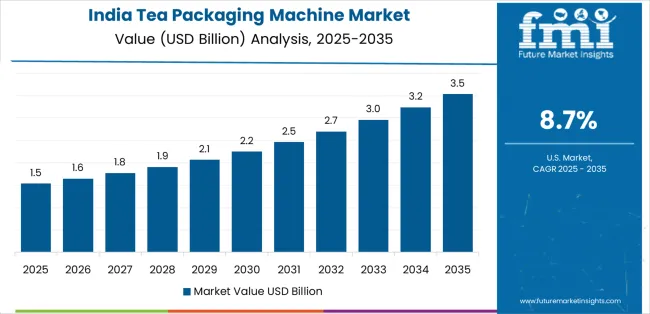
As per FMI, the Indian tea packing machine market is anticipated to expand at a CAGR of 5.4% during the forecast period, creating an incremental opportunity of US$ 49.64 million by 2033. Increasing production and consumption of tea, the rise in tea export, and the growing adoption of advanced packaging machinery by tea manufacturers are some factors propelling demand for tea packing machines in India.

According to the data provided by the Indian Tea Association, the production of tea was 1,329 million Kgs in 2021 compared to 1,209 million Kgs in 2015.

India is among the top 5 tea exporters in the world, accounting for about 10% of the total exports. The total value of tea exports from India reached around 687.9 million, as per the India Brand Equity Foundation (IBEF). Black tea is the most exported tea type, which makes up around 96% of the total exports.

The tea packing machine manufacturers use tea packing machines to properly pack various types of teas, improve their shelf life, and preserve their quality. These machines help them to increase productivity and reduce labor costs. The rising production and consumption of teas and an increase in the tea export business may propel tea packing machine market growth in India during the assessment period.

Get the data you need at a Fraction of the cost

Personalize your report by choosing insights you need
and save 40%!

Competitive Landscape

Key tea packing machine manufacturers are focusing on increasing their sales and revenues by expanding their capacities to cater to the growing demand.

They have adopted various organic and inorganic strategies such as new product launches, product price reduction, new production facilities, partnerships, mergers, acquisitions, and collaborations to expand their global footprint and gain a competitive edge in the tea packing machine market.

IMA, Xiamen Sengong Packing, and Universal Pack are the Harbingers of Innovative Tea Packaging Technology

IMA is a trusted partner with the most efficient solutions and the deepest understanding of the actual demands due to decades of experience in tea packaging technologies and the broadest coverage of the tea and beverage industries. With rising investments in research and development, new product development has been at the heart of the IMA agenda. The company has deployed more than 2500 IMA teabag packaging equipment.

IMA is dedicated to offering manufacturers new and advanced tea packing solutions to help them package tea, preserve its qualities, and improve overall productivity.

  • For instance, in May 2021, a brand-new, environmentally friendly CT11 teabag packaging machine was developed by IMA. The new device can pack 200 tetrahedral or pillow bags per minute with thread and tag, complete with a sealed outer envelope and final carton. The project's leitmotif and driving force has been ‘sustainable packaging’ since its start. The CT11 uses all biodegradable materials, including the cardboard box and filter.

Xiamen Sengong Packing Equipment Co., Ltd is a renowned automatic vertical packing machinery producer based in Xiamen, southeastern China, with over 18 years of experience in machine design, research, development, manufacturing, sales, and service. The company's primary products are inner and outer tea packaging machines, granules packing machines, and special product packing machines with excellent quality, efficiency, sturdiness, safety, environmental friendliness, and energy savings. The devices are frequently utilized in the tea, pharmaceutical, food, chemical, hardware, and electronics sectors.

  • For instance, in March 2020, the company shipped the C25 Tagging Machine and the C21DX Pyramid Tea Bag Packing Machine to Korea. Similarly, in August 2021, the C21DX Chamomile Pyramid Tea Bag with Outer Envelope Machine was delivered to Kazakhstan by the company.

Another manufacturer and provider of tea packaging machinery is Universal Pack. The company entered the market of automated sachet machines in 1965. In these 50 years, the firm has generated unique solutions for a booming market, leaving a concrete impact by developing the most effective tea packaging technologies and becoming the leading maker of automatic vertical sachet machines among the top companies in the packaging industry.

The company's primary and secondary tea packaging machines and lines can make sachets that are sealed on all four sides, shaped stick-packs, boxes from the flat blank, and pre-glued cartons.

  • For instance, in February 2021, Universal Pack introduced sustainable tea packaging and recyclable materials. Sustainable packaging reduces a product's carbon impact by up to 33%.

Prominent Tea Packing Machine Manufacturers

  • I.M.A. Industria Macchine Automatiche S.P.A.
  • Xiamen Sengong Packing Equipment Co. Ltd.
  • Acma S.P.A.
  • Omag Srl
  • Teepack Spezialmaschinen Gmbh & Company Kg
  • Unitek Packaging Systems Private Limited
  • Avm Packaging Systems
  • P. Pack Solutions
  • Vista Technopack Machines
  • Synda Pack
  • Universal Pack S.R.L.
  • Dopack
  • Hangzhou Youngsun Intelligent Equipment Co., Ltd
  • Nichrome Packaging Solutions.
  • Nasa Corporation
  • Omori Europe
  • Zirve International.
  • Pavel Blažek, Balicí Stroje S. R. O.
  • Dph International Gmbh
  • Spack Machine

Novel Breakthroughs

Company Robotics
Strategy Sewtec Collaborates with Tetley Tea
Details In 2019, Robotics specialist Sewtec launched a new packaging machine specially designed for the owners of Tetley Tea. Using the new automated system, The Tetley brand can pack over 2,000 tea bags every minute.
Company Tata Consumer Products
Strategy Tata Consumer Products Launches 16-Acre Tea Packaging Plant
Details In July 2021, Tata Consumer Products inaugurated its tea packaging plant in the Gopalpur industrial park. This plant may help the company to scale its supply chain capabilities to meet the growing consumer demand. It is the considerable tea packaging plant for the company, spread across 16 acres.
Company Dorset Tea United Kingdom
Strategy Dorset Tea UK Launches Environmentally Friendly Packaging
Details In March 2021, Dorset Tea United Kingdom announced the launch of the new 100% sustainable packaging. The company removed the gold lettering from the outer packaging to make it 100% recyclable. This may reduce the company’s carbon footprint and allow customers to use sustainable packaged tea.

Key Segments

By Automation:

  • Automatic
  • Semi-Automatic
  • Manual

By Machine Type:

  • Form Fill-seal Equipment
  • Filling & Dosing Equipment
  • Cartoning Equipment
  • Case Packing and Sealers
  • Wrapping and Bundling Equipment
  • Palletizers

By Application:

  • Pouches
  • Bags
  • Stick Pack
  • Sachets
  • Bottles & Jars
  • Containers & Boxes
  • Cans

By Region:

  • North America
  • Latin America
  • Europe
  • South Asia
  • East Asia
  • The Middle East & Africa
  • Oceania

Frequently Asked Questions

What is the market valuation expected for 2033?

The market is estimated to reach US$ 1,508.61 million by 2033.

What is the projected CAGR for the market from 2023 to 2033?

The market is expected to record a CAGR of 5.8% until 2033.

What was the market size in 2022?

The market predicted million growth in 2022. US$ 789.18

Which material type contributes to the growth of the market?

By 2023, form-fill-seal equipment will expand at a CAGR of 6.1%.

How much CAGR is expected for Germany?

Germany is slated to expand by 3.9% CAGR through 2033.

Table of Content

1. Executive Summary

    1.1. Global Market Outlook

    1.2. Demand-side Trends

    1.3. Supply-side Trends

    1.4. Technology Roadmap Analysis

    1.5. Analysis and Recommendations

2. Market Overview

    2.1. Market Coverage / Taxonomy

    2.2. Market Definition / Scope / Limitations

3. Market Background

    3.1. Market Dynamics

        3.1.1. Drivers

        3.1.2. Restraints

        3.1.3. Opportunity

        3.1.4. Trends

    3.2. Scenario Forecast

        3.2.1. Demand in Optimistic Scenario

        3.2.2. Demand in Likely Scenario

        3.2.3. Demand in Conservative Scenario

    3.3. Opportunity Map Analysis

    3.4. Product Life Cycle Analysis

    3.5. Supply Chain Analysis

        3.5.1. Supply Side Participants and their Roles

            3.5.1.1. Producers

            3.5.1.2. Mid-Level Participants (Traders/ Agents/ Brokers)

            3.5.1.3. Wholesalers and Distributors

        3.5.2. Value Added and Value Created at Node in the Supply Chain

        3.5.3. List of Raw Material Suppliers

        3.5.4. List of Existing and Potential Buyer’s

    3.6. Investment Feasibility Matrix

    3.7. Value Chain Analysis

        3.7.1. Profit Margin Analysis

        3.7.2. Wholesalers and Distributors

        3.7.3. Retailers

    3.8. PESTLE and Porter’s Analysis

    3.9. Regulatory Landscape

        3.9.1. By Key Regions

        3.9.2. By Key Countries

    3.10. Regional Parent Market Outlook

    3.11. Production and Consumption Statistics

    3.12. Import and Export Statistics

4. Global Market Analysis 2018 to 2022 and Forecast, 2023 to 2033

    4.1. Historical Market Size Value (US$ Million) & Volume (Units) Analysis, 2018 to 2022

    4.2. Current and Future Market Size Value (US$ Million) & Volume (Units) Projections, 2023 to 2033

        4.2.1. Y-o-Y Growth Trend Analysis

        4.2.2. Absolute $ Opportunity Analysis

5. Global Market Analysis 2018 to 2022 and Forecast 2023 to 2033, By Automation

    5.1. Introduction / Key Findings

    5.2. Historical Market Size Value (US$ Million) & Volume (Units) Analysis By Automation, 2018 to 2022

    5.3. Current and Future Market Size Value (US$ Million) & Volume (Units) Analysis and Forecast By Automation, 2023 to 2033

        5.3.1. Automatic

        5.3.2. Semi-automatic

        5.3.3. Manual

    5.4. Y-o-Y Growth Trend Analysis By Automation, 2018 to 2022

    5.5. Absolute $ Opportunity Analysis By Automation, 2023 to 2033

6. Global Market Analysis 2018 to 2022 and Forecast 2023 to 2033, By Machine Type

    6.1. Introduction / Key Findings

    6.2. Historical Market Size Value (US$ Million) & Volume (Units) Analysis By Machine Type, 2018 to 2022

    6.3. Current and Future Market Size Value (US$ Million) & Volume (Units) Analysis and Forecast By Machine Type, 2023 to 2033

        6.3.1. Form Fill-seal Equipment

        6.3.2. Filling & Dosing Equipment

        6.3.3. Cartoning Equipment

        6.3.4. Case Packing and Sealers

        6.3.5. Wrapping and Bundling Equipment

        6.3.6. Palletizers

    6.4. Y-o-Y Growth Trend Analysis By Machine Type, 2018 to 2022

    6.5. Absolute $ Opportunity Analysis By Machine Type, 2023 to 2033

7. Global Market Analysis 2018 to 2022 and Forecast 2023 to 2033, By Application

    7.1. Introduction / Key Findings

    7.2. Historical Market Size Value (US$ Million) & Volume (Units) Analysis By Application, 2018 to 2022

    7.3. Current and Future Market Size Value (US$ Million) & Volume (Units) Analysis and Forecast By Application, 2023 to 2033

        7.3.1. Pouches

        7.3.2. Bags

        7.3.3. Stick Pack

        7.3.4. Sachets

        7.3.5. Bottles & Jars

        7.3.6. Containers & Boxes

        7.3.7. Cans

    7.4. Y-o-Y Growth Trend Analysis By Application, 2018 to 2022

    7.5. Absolute $ Opportunity Analysis By Application, 2023 to 2033

8. Global Market Analysis 2018 to 2022 and Forecast 2023 to 2033, By Region

    8.1. Introduction

    8.2. Historical Market Size Value (US$ Million) & Volume (Units) Analysis By Region, 2018 to 2022

    8.3. Current Market Size Value (US$ Million) & Volume (Units) Analysis and Forecast By Region, 2023 to 2033

        8.3.1. North America

        8.3.2. Latin America

        8.3.3. Western Europe

        8.3.4. Eastern Europe

        8.3.5. South Asia and Pacific

        8.3.6. East Asia

        8.3.7. Middle East and Africa

    8.4. Market Attractiveness Analysis By Region

9. North America Market Analysis 2018 to 2022 and Forecast 2023 to 2033, By Country

    9.1. Historical Market Size Value (US$ Million) & Volume (Units) Trend Analysis By Market Taxonomy, 2018 to 2022

    9.2. Market Size Value (US$ Million) & Volume (Units) Forecast By Market Taxonomy, 2023 to 2033

        9.2.1. By Country

            9.2.1.1. USA

            9.2.1.2. Canada

        9.2.2. By Automation

        9.2.3. By Machine Type

        9.2.4. By Application

    9.3. Market Attractiveness Analysis

        9.3.1. By Country

        9.3.2. By Automation

        9.3.3. By Machine Type

        9.3.4. By Application

    9.4. Key Takeaways

10. Latin America Market Analysis 2018 to 2022 and Forecast 2023 to 2033, By Country

    10.1. Historical Market Size Value (US$ Million) & Volume (Units) Trend Analysis By Market Taxonomy, 2018 to 2022

    10.2. Market Size Value (US$ Million) & Volume (Units) Forecast By Market Taxonomy, 2023 to 2033

        10.2.1. By Country

            10.2.1.1. Brazil

            10.2.1.2. Mexico

            10.2.1.3. Rest of Latin America

        10.2.2. By Automation

        10.2.3. By Machine Type

        10.2.4. By Application

    10.3. Market Attractiveness Analysis

        10.3.1. By Country

        10.3.2. By Automation

        10.3.3. By Machine Type

        10.3.4. By Application

    10.4. Key Takeaways

11. Western Europe Market Analysis 2018 to 2022 and Forecast 2023 to 2033, By Country

    11.1. Historical Market Size Value (US$ Million) & Volume (Units) Trend Analysis By Market Taxonomy, 2018 to 2022

    11.2. Market Size Value (US$ Million) & Volume (Units) Forecast By Market Taxonomy, 2023 to 2033

        11.2.1. By Country

            11.2.1.1. Germany

            11.2.1.2. UK

            11.2.1.3. France

            11.2.1.4. Spain

            11.2.1.5. Italy

            11.2.1.6. Rest of Western Europe

        11.2.2. By Automation

        11.2.3. By Machine Type

        11.2.4. By Application

    11.3. Market Attractiveness Analysis

        11.3.1. By Country

        11.3.2. By Automation

        11.3.3. By Machine Type

        11.3.4. By Application

    11.4. Key Takeaways

12. Eastern Europe Market Analysis 2018 to 2022 and Forecast 2023 to 2033, By Country

    12.1. Historical Market Size Value (US$ Million) & Volume (Units) Trend Analysis By Market Taxonomy, 2018 to 2022

    12.2. Market Size Value (US$ Million) & Volume (Units) Forecast By Market Taxonomy, 2023 to 2033

        12.2.1. By Country

            12.2.1.1. Poland

            12.2.1.2. Russia

            12.2.1.3. Czech Republic

            12.2.1.4. Romania

            12.2.1.5. Rest of Eastern Europe

        12.2.2. By Automation

        12.2.3. By Machine Type

        12.2.4. By Application

    12.3. Market Attractiveness Analysis

        12.3.1. By Country

        12.3.2. By Automation

        12.3.3. By Machine Type

        12.3.4. By Application

    12.4. Key Takeaways

13. South Asia and Pacific Market Analysis 2018 to 2022 and Forecast 2023 to 2033, By Country

    13.1. Historical Market Size Value (US$ Million) & Volume (Units) Trend Analysis By Market Taxonomy, 2018 to 2022

    13.2. Market Size Value (US$ Million) & Volume (Units) Forecast By Market Taxonomy, 2023 to 2033

        13.2.1. By Country

            13.2.1.1. India

            13.2.1.2. Bangladesh

            13.2.1.3. Australia

            13.2.1.4. New Zealand

            13.2.1.5. Rest of South Asia and Pacific

        13.2.2. By Automation

        13.2.3. By Machine Type

        13.2.4. By Application

    13.3. Market Attractiveness Analysis

        13.3.1. By Country

        13.3.2. By Automation

        13.3.3. By Machine Type

        13.3.4. By Application

    13.4. Key Takeaways

14. East Asia Market Analysis 2018 to 2022 and Forecast 2023 to 2033, By Country

    14.1. Historical Market Size Value (US$ Million) & Volume (Units) Trend Analysis By Market Taxonomy, 2018 to 2022

    14.2. Market Size Value (US$ Million) & Volume (Units) Forecast By Market Taxonomy, 2023 to 2033

        14.2.1. By Country

            14.2.1.1. China

            14.2.1.2. Japan

            14.2.1.3. South Korea

        14.2.2. By Automation

        14.2.3. By Machine Type

        14.2.4. By Application

    14.3. Market Attractiveness Analysis

        14.3.1. By Country

        14.3.2. By Automation

        14.3.3. By Machine Type

        14.3.4. By Application

    14.4. Key Takeaways

15. Middle East and Africa Market Analysis 2018 to 2022 and Forecast 2023 to 2033, By Country

    15.1. Historical Market Size Value (US$ Million) & Volume (Units) Trend Analysis By Market Taxonomy, 2018 to 2022

    15.2. Market Size Value (US$ Million) & Volume (Units) Forecast By Market Taxonomy, 2023 to 2033

        15.2.1. By Country

            15.2.1.1. GCC Countries

            15.2.1.2. South Africa

            15.2.1.3. Israel

            15.2.1.4. Rest of MEA

        15.2.2. By Automation

        15.2.3. By Machine Type

        15.2.4. By Application

    15.3. Market Attractiveness Analysis

        15.3.1. By Country

        15.3.2. By Automation

        15.3.3. By Machine Type

        15.3.4. By Application

    15.4. Key Takeaways

16. Key Countries Market Analysis

    16.1. USA

        16.1.1. Pricing Analysis

        16.1.2. Market Share Analysis, 2022

            16.1.2.1. By Automation

            16.1.2.2. By Machine Type

            16.1.2.3. By Application

    16.2. Canada

        16.2.1. Pricing Analysis

        16.2.2. Market Share Analysis, 2022

            16.2.2.1. By Automation

            16.2.2.2. By Machine Type

            16.2.2.3. By Application

    16.3. Brazil

        16.3.1. Pricing Analysis

        16.3.2. Market Share Analysis, 2022

            16.3.2.1. By Automation

            16.3.2.2. By Machine Type

            16.3.2.3. By Application

    16.4. Mexico

        16.4.1. Pricing Analysis

        16.4.2. Market Share Analysis, 2022

            16.4.2.1. By Automation

            16.4.2.2. By Machine Type

            16.4.2.3. By Application

    16.5. Germany

        16.5.1. Pricing Analysis

        16.5.2. Market Share Analysis, 2022

            16.5.2.1. By Automation

            16.5.2.2. By Machine Type

            16.5.2.3. By Application

    16.6. UK

        16.6.1. Pricing Analysis

        16.6.2. Market Share Analysis, 2022

            16.6.2.1. By Automation

            16.6.2.2. By Machine Type

            16.6.2.3. By Application

    16.7. France

        16.7.1. Pricing Analysis

        16.7.2. Market Share Analysis, 2022

            16.7.2.1. By Automation

            16.7.2.2. By Machine Type

            16.7.2.3. By Application

    16.8. Spain

        16.8.1. Pricing Analysis

        16.8.2. Market Share Analysis, 2022

            16.8.2.1. By Automation

            16.8.2.2. By Machine Type

            16.8.2.3. By Application

    16.9. Italy

        16.9.1. Pricing Analysis

        16.9.2. Market Share Analysis, 2022

            16.9.2.1. By Automation

            16.9.2.2. By Machine Type

            16.9.2.3. By Application

    16.10. Poland

        16.10.1. Pricing Analysis

        16.10.2. Market Share Analysis, 2022

            16.10.2.1. By Automation

            16.10.2.2. By Machine Type

            16.10.2.3. By Application

    16.11. Russia

        16.11.1. Pricing Analysis

        16.11.2. Market Share Analysis, 2022

            16.11.2.1. By Automation

            16.11.2.2. By Machine Type

            16.11.2.3. By Application

    16.12. Czech Republic

        16.12.1. Pricing Analysis

        16.12.2. Market Share Analysis, 2022

            16.12.2.1. By Automation

            16.12.2.2. By Machine Type

            16.12.2.3. By Application

    16.13. Romania

        16.13.1. Pricing Analysis

        16.13.2. Market Share Analysis, 2022

            16.13.2.1. By Automation

            16.13.2.2. By Machine Type

            16.13.2.3. By Application

    16.14. India

        16.14.1. Pricing Analysis

        16.14.2. Market Share Analysis, 2022

            16.14.2.1. By Automation

            16.14.2.2. By Machine Type

            16.14.2.3. By Application

    16.15. Bangladesh

        16.15.1. Pricing Analysis

        16.15.2. Market Share Analysis, 2022

            16.15.2.1. By Automation

            16.15.2.2. By Machine Type

            16.15.2.3. By Application

    16.16. Australia

        16.16.1. Pricing Analysis

        16.16.2. Market Share Analysis, 2022

            16.16.2.1. By Automation

            16.16.2.2. By Machine Type

            16.16.2.3. By Application

    16.17. New Zealand

        16.17.1. Pricing Analysis

        16.17.2. Market Share Analysis, 2022

            16.17.2.1. By Automation

            16.17.2.2. By Machine Type

            16.17.2.3. By Application

    16.18. China

        16.18.1. Pricing Analysis

        16.18.2. Market Share Analysis, 2022

            16.18.2.1. By Automation

            16.18.2.2. By Machine Type

            16.18.2.3. By Application

    16.19. Japan

        16.19.1. Pricing Analysis

        16.19.2. Market Share Analysis, 2022

            16.19.2.1. By Automation

            16.19.2.2. By Machine Type

            16.19.2.3. By Application

    16.20. South Korea

        16.20.1. Pricing Analysis

        16.20.2. Market Share Analysis, 2022

            16.20.2.1. By Automation

            16.20.2.2. By Machine Type

            16.20.2.3. By Application

    16.21. GCC Countries

        16.21.1. Pricing Analysis

        16.21.2. Market Share Analysis, 2022

            16.21.2.1. By Automation

            16.21.2.2. By Machine Type

            16.21.2.3. By Application

    16.22. South Africa

        16.22.1. Pricing Analysis

        16.22.2. Market Share Analysis, 2022

            16.22.2.1. By Automation

            16.22.2.2. By Machine Type

            16.22.2.3. By Application

    16.23. Israel

        16.23.1. Pricing Analysis

        16.23.2. Market Share Analysis, 2022

            16.23.2.1. By Automation

            16.23.2.2. By Machine Type

            16.23.2.3. By Application

17. Market Structure Analysis

    17.1. Competition Dashboard

    17.2. Competition Benchmarking

    17.3. Market Share Analysis of Top Players

        17.3.1. By Regional

        17.3.2. By Automation

        17.3.3. By Machine Type

        17.3.4. By Application

18. Competition Analysis

    18.1. Competition Deep Dive

        18.1.1. I.M.A. INDUSTRIA MACCHINE AUTOMATICHE S.P.A.

            18.1.1.1. Overview

            18.1.1.2. Product Portfolio

            18.1.1.3. Profitability by Market Segments

            18.1.1.4. Sales Footprint

            18.1.1.5. Strategy Overview

                18.1.1.5.1. Marketing Strategy

                18.1.1.5.2. Product Strategy

                18.1.1.5.3. Channel Strategy

        18.1.2. Xiamen Sengong Packing Equipment Co. Ltd.

            18.1.2.1. Overview

            18.1.2.2. Product Portfolio

            18.1.2.3. Profitability by Market Segments

            18.1.2.4. Sales Footprint

            18.1.2.5. Strategy Overview

                18.1.2.5.1. Marketing Strategy

                18.1.2.5.2. Product Strategy

                18.1.2.5.3. Channel Strategy

        18.1.3. ACMA S.p.A.

            18.1.3.1. Overview

            18.1.3.2. Product Portfolio

            18.1.3.3. Profitability by Market Segments

            18.1.3.4. Sales Footprint

            18.1.3.5. Strategy Overview

                18.1.3.5.1. Marketing Strategy

                18.1.3.5.2. Product Strategy

                18.1.3.5.3. Channel Strategy

        18.1.4. Omag srl

            18.1.4.1. Overview

            18.1.4.2. Product Portfolio

            18.1.4.3. Profitability by Market Segments

            18.1.4.4. Sales Footprint

            18.1.4.5. Strategy Overview

                18.1.4.5.1. Marketing Strategy

                18.1.4.5.2. Product Strategy

                18.1.4.5.3. Channel Strategy

        18.1.5. Teepack Spezialmaschinen GmbH & Company KG

            18.1.5.1. Overview

            18.1.5.2. Product Portfolio

            18.1.5.3. Profitability by Market Segments

            18.1.5.4. Sales Footprint

            18.1.5.5. Strategy Overview

                18.1.5.5.1. Marketing Strategy

                18.1.5.5.2. Product Strategy

                18.1.5.5.3. Channel Strategy

        18.1.6. Value (US$ Million) & Volume (Units)ek Packaging Systems Private Limited

            18.1.6.1. Overview

            18.1.6.2. Product Portfolio

            18.1.6.3. Profitability by Market Segments

            18.1.6.4. Sales Footprint

            18.1.6.5. Strategy Overview

                18.1.6.5.1. Marketing Strategy

                18.1.6.5.2. Product Strategy

                18.1.6.5.3. Channel Strategy

        18.1.7. AVM Packaging Systems

            18.1.7.1. Overview

            18.1.7.2. Product Portfolio

            18.1.7.3. Profitability by Market Segments

            18.1.7.4. Sales Footprint

            18.1.7.5. Strategy Overview

                18.1.7.5.1. Marketing Strategy

                18.1.7.5.2. Product Strategy

                18.1.7.5.3. Channel Strategy

        18.1.8. A. P. Pack Solutions

            18.1.8.1. Overview

            18.1.8.2. Product Portfolio

            18.1.8.3. Profitability by Market Segments

            18.1.8.4. Sales Footprint

            18.1.8.5. Strategy Overview

                18.1.8.5.1. Marketing Strategy

                18.1.8.5.2. Product Strategy

                18.1.8.5.3. Channel Strategy

        18.1.9. Vista Technopack Machines

            18.1.9.1. Overview

            18.1.9.2. Product Portfolio

            18.1.9.3. Profitability by Market Segments

            18.1.9.4. Sales Footprint

            18.1.9.5. Strategy Overview

                18.1.9.5.1. Marketing Strategy

                18.1.9.5.2. Product Strategy

                18.1.9.5.3. Channel Strategy

        18.1.10. Synda Pack

            18.1.10.1. Overview

            18.1.10.2. Product Portfolio

            18.1.10.3. Profitability by Market Segments

            18.1.10.4. Sales Footprint

            18.1.10.5. Strategy Overview

                18.1.10.5.1. Marketing Strategy

                18.1.10.5.2. Product Strategy

                18.1.10.5.3. Channel Strategy

        18.1.11. Universal Pack S.r.l.

            18.1.11.1. Overview

            18.1.11.2. Product Portfolio

            18.1.11.3. Profitability by Market Segments

            18.1.11.4. Sales Footprint

            18.1.11.5. Strategy Overview

                18.1.11.5.1. Marketing Strategy

                18.1.11.5.2. Product Strategy

                18.1.11.5.3. Channel Strategy

        18.1.12. Dopack

            18.1.12.1. Overview

            18.1.12.2. Product Portfolio

            18.1.12.3. Profitability by Market Segments

            18.1.12.4. Sales Footprint

            18.1.12.5. Strategy Overview

                18.1.12.5.1. Marketing Strategy

                18.1.12.5.2. Product Strategy

                18.1.12.5.3. Channel Strategy

        18.1.13. HANGZHOU YOUNGSUN INTELLIGENT EQUIPMENT CO., LTD

            18.1.13.1. Overview

            18.1.13.2. Product Portfolio

            18.1.13.3. Profitability by Market Segments

            18.1.13.4. Sales Footprint

            18.1.13.5. Strategy Overview

                18.1.13.5.1. Marketing Strategy

                18.1.13.5.2. Product Strategy

                18.1.13.5.3. Channel Strategy

        18.1.14. Nichrome Packaging Solutions.

            18.1.14.1. Overview

            18.1.14.2. Product Portfolio

            18.1.14.3. Profitability by Market Segments

            18.1.14.4. Sales Footprint

            18.1.14.5. Strategy Overview

                18.1.14.5.1. Marketing Strategy

                18.1.14.5.2. Product Strategy

                18.1.14.5.3. Channel Strategy

        18.1.15. Nasa Corporation

            18.1.15.1. Overview

            18.1.15.2. Product Portfolio

            18.1.15.3. Profitability by Market Segments

            18.1.15.4. Sales Footprint

            18.1.15.5. Strategy Overview

                18.1.15.5.1. Marketing Strategy

                18.1.15.5.2. Product Strategy

                18.1.15.5.3. Channel Strategy

        18.1.16. Omori Europe

            18.1.16.1. Overview

            18.1.16.2. Product Portfolio

            18.1.16.3. Profitability by Market Segments

            18.1.16.4. Sales Footprint

            18.1.16.5. Strategy Overview

                18.1.16.5.1. Marketing Strategy

                18.1.16.5.2. Product Strategy

                18.1.16.5.3. Channel Strategy

        18.1.17. Zirve International.

            18.1.17.1. Overview

            18.1.17.2. Product Portfolio

            18.1.17.3. Profitability by Market Segments

            18.1.17.4. Sales Footprint

            18.1.17.5. Strategy Overview

                18.1.17.5.1. Marketing Strategy

                18.1.17.5.2. Product Strategy

                18.1.17.5.3. Channel Strategy

        18.1.18. Pavel Blažek, balicí stroje s. r. o.

            18.1.18.1. Overview

            18.1.18.2. Product Portfolio

            18.1.18.3. Profitability by Market Segments

            18.1.18.4. Sales Footprint

            18.1.18.5. Strategy Overview

                18.1.18.5.1. Marketing Strategy

                18.1.18.5.2. Product Strategy

                18.1.18.5.3. Channel Strategy

        18.1.19. dph International GmbH

            18.1.19.1. Overview

            18.1.19.2. Product Portfolio

            18.1.19.3. Profitability by Market Segments

            18.1.19.4. Sales Footprint

            18.1.19.5. Strategy Overview

                18.1.19.5.1. Marketing Strategy

                18.1.19.5.2. Product Strategy

                18.1.19.5.3. Channel Strategy

        18.1.20. Spack Machine

            18.1.20.1. Overview

            18.1.20.2. Product Portfolio

            18.1.20.3. Profitability by Market Segments

            18.1.20.4. Sales Footprint

            18.1.20.5. Strategy Overview

                18.1.20.5.1. Marketing Strategy

                18.1.20.5.2. Product Strategy

                18.1.20.5.3. Channel Strategy

19. Assumptions & Acronyms Used

20. Research Methodology

List of Tables

Table 1: Global Market Value (US$ Million) Forecast by Region, 2018 to 2033

Table 2: Global Market Volume (Units) Forecast by Region, 2018 to 2033

Table 3: Global Market Value (US$ Million) Forecast by Automation, 2018 to 2033

Table 4: Global Market Volume (Units) Forecast by Automation, 2018 to 2033

Table 5: Global Market Value (US$ Million) Forecast by Machine Type, 2018 to 2033

Table 6: Global Market Volume (Units) Forecast by Machine Type, 2018 to 2033

Table 7: Global Market Value (US$ Million) Forecast by Application, 2018 to 2033

Table 8: Global Market Volume (Units) Forecast by Application, 2018 to 2033

Table 9: North America Market Value (US$ Million) Forecast by Country, 2018 to 2033

Table 10: North America Market Volume (Units) Forecast by Country, 2018 to 2033

Table 11: North America Market Value (US$ Million) Forecast by Automation, 2018 to 2033

Table 12: North America Market Volume (Units) Forecast by Automation, 2018 to 2033

Table 13: North America Market Value (US$ Million) Forecast by Machine Type, 2018 to 2033

Table 14: North America Market Volume (Units) Forecast by Machine Type, 2018 to 2033

Table 15: North America Market Value (US$ Million) Forecast by Application, 2018 to 2033

Table 16: North America Market Volume (Units) Forecast by Application, 2018 to 2033

Table 17: Latin America Market Value (US$ Million) Forecast by Country, 2018 to 2033

Table 18: Latin America Market Volume (Units) Forecast by Country, 2018 to 2033

Table 19: Latin America Market Value (US$ Million) Forecast by Automation, 2018 to 2033

Table 20: Latin America Market Volume (Units) Forecast by Automation, 2018 to 2033

Table 21: Latin America Market Value (US$ Million) Forecast by Machine Type, 2018 to 2033

Table 22: Latin America Market Volume (Units) Forecast by Machine Type, 2018 to 2033

Table 23: Latin America Market Value (US$ Million) Forecast by Application, 2018 to 2033

Table 24: Latin America Market Volume (Units) Forecast by Application, 2018 to 2033

Table 25: Western Europe Market Value (US$ Million) Forecast by Country, 2018 to 2033

Table 26: Western Europe Market Volume (Units) Forecast by Country, 2018 to 2033

Table 27: Western Europe Market Value (US$ Million) Forecast by Automation, 2018 to 2033

Table 28: Western Europe Market Volume (Units) Forecast by Automation, 2018 to 2033

Table 29: Western Europe Market Value (US$ Million) Forecast by Machine Type, 2018 to 2033

Table 30: Western Europe Market Volume (Units) Forecast by Machine Type, 2018 to 2033

Table 31: Western Europe Market Value (US$ Million) Forecast by Application, 2018 to 2033

Table 32: Western Europe Market Volume (Units) Forecast by Application, 2018 to 2033

Table 33: Eastern Europe Market Value (US$ Million) Forecast by Country, 2018 to 2033

Table 34: Eastern Europe Market Volume (Units) Forecast by Country, 2018 to 2033

Table 35: Eastern Europe Market Value (US$ Million) Forecast by Automation, 2018 to 2033

Table 36: Eastern Europe Market Volume (Units) Forecast by Automation, 2018 to 2033

Table 37: Eastern Europe Market Value (US$ Million) Forecast by Machine Type, 2018 to 2033

Table 38: Eastern Europe Market Volume (Units) Forecast by Machine Type, 2018 to 2033

Table 39: Eastern Europe Market Value (US$ Million) Forecast by Application, 2018 to 2033

Table 40: Eastern Europe Market Volume (Units) Forecast by Application, 2018 to 2033

Table 41: South Asia and Pacific Market Value (US$ Million) Forecast by Country, 2018 to 2033

Table 42: South Asia and Pacific Market Volume (Units) Forecast by Country, 2018 to 2033

Table 43: South Asia and Pacific Market Value (US$ Million) Forecast by Automation, 2018 to 2033

Table 44: South Asia and Pacific Market Volume (Units) Forecast by Automation, 2018 to 2033

Table 45: South Asia and Pacific Market Value (US$ Million) Forecast by Machine Type, 2018 to 2033

Table 46: South Asia and Pacific Market Volume (Units) Forecast by Machine Type, 2018 to 2033

Table 47: South Asia and Pacific Market Value (US$ Million) Forecast by Application, 2018 to 2033

Table 48: South Asia and Pacific Market Volume (Units) Forecast by Application, 2018 to 2033

Table 49: East Asia Market Value (US$ Million) Forecast by Country, 2018 to 2033

Table 50: East Asia Market Volume (Units) Forecast by Country, 2018 to 2033

Table 51: East Asia Market Value (US$ Million) Forecast by Automation, 2018 to 2033

Table 52: East Asia Market Volume (Units) Forecast by Automation, 2018 to 2033

Table 53: East Asia Market Value (US$ Million) Forecast by Machine Type, 2018 to 2033

Table 54: East Asia Market Volume (Units) Forecast by Machine Type, 2018 to 2033

Table 55: East Asia Market Value (US$ Million) Forecast by Application, 2018 to 2033

Table 56: East Asia Market Volume (Units) Forecast by Application, 2018 to 2033

Table 57: Middle East and Africa Market Value (US$ Million) Forecast by Country, 2018 to 2033

Table 58: Middle East and Africa Market Volume (Units) Forecast by Country, 2018 to 2033

Table 59: Middle East and Africa Market Value (US$ Million) Forecast by Automation, 2018 to 2033

Table 60: Middle East and Africa Market Volume (Units) Forecast by Automation, 2018 to 2033

Table 61: Middle East and Africa Market Value (US$ Million) Forecast by Machine Type, 2018 to 2033

Table 62: Middle East and Africa Market Volume (Units) Forecast by Machine Type, 2018 to 2033

Table 63: Middle East and Africa Market Value (US$ Million) Forecast by Application, 2018 to 2033

Table 64: Middle East and Africa Market Volume (Units) Forecast by Application, 2018 to 2033

List of Charts

Figure 1: Global Market Value (US$ Million) by Automation, 2023 to 2033

Figure 2: Global Market Value (US$ Million) by Machine Type, 2023 to 2033

Figure 3: Global Market Value (US$ Million) by Application, 2023 to 2033

Figure 4: Global Market Value (US$ Million) by Region, 2023 to 2033

Figure 5: Global Market Value (US$ Million) Analysis by Region, 2018 to 2033

Figure 6: Global Market Volume (Units) Analysis by Region, 2018 to 2033

Figure 7: Global Market Value Share (%) and BPS Analysis by Region, 2023 to 2033

Figure 8: Global Market Y-o-Y Growth (%) Projections by Region, 2023 to 2033

Figure 9: Global Market Value (US$ Million) Analysis by Automation, 2018 to 2033

Figure 10: Global Market Volume (Units) Analysis by Automation, 2018 to 2033

Figure 11: Global Market Value Share (%) and BPS Analysis by Automation, 2023 to 2033

Figure 12: Global Market Y-o-Y Growth (%) Projections by Automation, 2023 to 2033

Figure 13: Global Market Value (US$ Million) Analysis by Machine Type, 2018 to 2033

Figure 14: Global Market Volume (Units) Analysis by Machine Type, 2018 to 2033

Figure 15: Global Market Value Share (%) and BPS Analysis by Machine Type, 2023 to 2033

Figure 16: Global Market Y-o-Y Growth (%) Projections by Machine Type, 2023 to 2033

Figure 17: Global Market Value (US$ Million) Analysis by Application, 2018 to 2033

Figure 18: Global Market Volume (Units) Analysis by Application, 2018 to 2033

Figure 19: Global Market Value Share (%) and BPS Analysis by Application, 2023 to 2033

Figure 20: Global Market Y-o-Y Growth (%) Projections by Application, 2023 to 2033

Figure 21: Global Market Attractiveness by Automation, 2023 to 2033

Figure 22: Global Market Attractiveness by Machine Type, 2023 to 2033

Figure 23: Global Market Attractiveness by Application, 2023 to 2033

Figure 24: Global Market Attractiveness by Region, 2023 to 2033

Figure 25: North America Market Value (US$ Million) by Automation, 2023 to 2033

Figure 26: North America Market Value (US$ Million) by Machine Type, 2023 to 2033

Figure 27: North America Market Value (US$ Million) by Application, 2023 to 2033

Figure 28: North America Market Value (US$ Million) by Country, 2023 to 2033

Figure 29: North America Market Value (US$ Million) Analysis by Country, 2018 to 2033

Figure 30: North America Market Volume (Units) Analysis by Country, 2018 to 2033

Figure 31: North America Market Value Share (%) and BPS Analysis by Country, 2023 to 2033

Figure 32: North America Market Y-o-Y Growth (%) Projections by Country, 2023 to 2033

Figure 33: North America Market Value (US$ Million) Analysis by Automation, 2018 to 2033

Figure 34: North America Market Volume (Units) Analysis by Automation, 2018 to 2033

Figure 35: North America Market Value Share (%) and BPS Analysis by Automation, 2023 to 2033

Figure 36: North America Market Y-o-Y Growth (%) Projections by Automation, 2023 to 2033

Figure 37: North America Market Value (US$ Million) Analysis by Machine Type, 2018 to 2033

Figure 38: North America Market Volume (Units) Analysis by Machine Type, 2018 to 2033

Figure 39: North America Market Value Share (%) and BPS Analysis by Machine Type, 2023 to 2033

Figure 40: North America Market Y-o-Y Growth (%) Projections by Machine Type, 2023 to 2033

Figure 41: North America Market Value (US$ Million) Analysis by Application, 2018 to 2033

Figure 42: North America Market Volume (Units) Analysis by Application, 2018 to 2033

Figure 43: North America Market Value Share (%) and BPS Analysis by Application, 2023 to 2033

Figure 44: North America Market Y-o-Y Growth (%) Projections by Application, 2023 to 2033

Figure 45: North America Market Attractiveness by Automation, 2023 to 2033

Figure 46: North America Market Attractiveness by Machine Type, 2023 to 2033

Figure 47: North America Market Attractiveness by Application, 2023 to 2033

Figure 48: North America Market Attractiveness by Country, 2023 to 2033

Figure 49: Latin America Market Value (US$ Million) by Automation, 2023 to 2033

Figure 50: Latin America Market Value (US$ Million) by Machine Type, 2023 to 2033

Figure 51: Latin America Market Value (US$ Million) by Application, 2023 to 2033

Figure 52: Latin America Market Value (US$ Million) by Country, 2023 to 2033

Figure 53: Latin America Market Value (US$ Million) Analysis by Country, 2018 to 2033

Figure 54: Latin America Market Volume (Units) Analysis by Country, 2018 to 2033

Figure 55: Latin America Market Value Share (%) and BPS Analysis by Country, 2023 to 2033

Figure 56: Latin America Market Y-o-Y Growth (%) Projections by Country, 2023 to 2033

Figure 57: Latin America Market Value (US$ Million) Analysis by Automation, 2018 to 2033

Figure 58: Latin America Market Volume (Units) Analysis by Automation, 2018 to 2033

Figure 59: Latin America Market Value Share (%) and BPS Analysis by Automation, 2023 to 2033

Figure 60: Latin America Market Y-o-Y Growth (%) Projections by Automation, 2023 to 2033

Figure 61: Latin America Market Value (US$ Million) Analysis by Machine Type, 2018 to 2033

Figure 62: Latin America Market Volume (Units) Analysis by Machine Type, 2018 to 2033

Figure 63: Latin America Market Value Share (%) and BPS Analysis by Machine Type, 2023 to 2033

Figure 64: Latin America Market Y-o-Y Growth (%) Projections by Machine Type, 2023 to 2033

Figure 65: Latin America Market Value (US$ Million) Analysis by Application, 2018 to 2033

Figure 66: Latin America Market Volume (Units) Analysis by Application, 2018 to 2033

Figure 67: Latin America Market Value Share (%) and BPS Analysis by Application, 2023 to 2033

Figure 68: Latin America Market Y-o-Y Growth (%) Projections by Application, 2023 to 2033

Figure 69: Latin America Market Attractiveness by Automation, 2023 to 2033

Figure 70: Latin America Market Attractiveness by Machine Type, 2023 to 2033

Figure 71: Latin America Market Attractiveness by Application, 2023 to 2033

Figure 72: Latin America Market Attractiveness by Country, 2023 to 2033

Figure 73: Western Europe Market Value (US$ Million) by Automation, 2023 to 2033

Figure 74: Western Europe Market Value (US$ Million) by Machine Type, 2023 to 2033

Figure 75: Western Europe Market Value (US$ Million) by Application, 2023 to 2033

Figure 76: Western Europe Market Value (US$ Million) by Country, 2023 to 2033

Figure 77: Western Europe Market Value (US$ Million) Analysis by Country, 2018 to 2033

Figure 78: Western Europe Market Volume (Units) Analysis by Country, 2018 to 2033

Figure 79: Western Europe Market Value Share (%) and BPS Analysis by Country, 2023 to 2033

Figure 80: Western Europe Market Y-o-Y Growth (%) Projections by Country, 2023 to 2033

Figure 81: Western Europe Market Value (US$ Million) Analysis by Automation, 2018 to 2033

Figure 82: Western Europe Market Volume (Units) Analysis by Automation, 2018 to 2033

Figure 83: Western Europe Market Value Share (%) and BPS Analysis by Automation, 2023 to 2033

Figure 84: Western Europe Market Y-o-Y Growth (%) Projections by Automation, 2023 to 2033

Figure 85: Western Europe Market Value (US$ Million) Analysis by Machine Type, 2018 to 2033

Figure 86: Western Europe Market Volume (Units) Analysis by Machine Type, 2018 to 2033

Figure 87: Western Europe Market Value Share (%) and BPS Analysis by Machine Type, 2023 to 2033

Figure 88: Western Europe Market Y-o-Y Growth (%) Projections by Machine Type, 2023 to 2033

Figure 89: Western Europe Market Value (US$ Million) Analysis by Application, 2018 to 2033

Figure 90: Western Europe Market Volume (Units) Analysis by Application, 2018 to 2033

Figure 91: Western Europe Market Value Share (%) and BPS Analysis by Application, 2023 to 2033

Figure 92: Western Europe Market Y-o-Y Growth (%) Projections by Application, 2023 to 2033

Figure 93: Western Europe Market Attractiveness by Automation, 2023 to 2033

Figure 94: Western Europe Market Attractiveness by Machine Type, 2023 to 2033

Figure 95: Western Europe Market Attractiveness by Application, 2023 to 2033

Figure 96: Western Europe Market Attractiveness by Country, 2023 to 2033

Figure 97: Eastern Europe Market Value (US$ Million) by Automation, 2023 to 2033

Figure 98: Eastern Europe Market Value (US$ Million) by Machine Type, 2023 to 2033

Figure 99: Eastern Europe Market Value (US$ Million) by Application, 2023 to 2033

Figure 100: Eastern Europe Market Value (US$ Million) by Country, 2023 to 2033

Figure 101: Eastern Europe Market Value (US$ Million) Analysis by Country, 2018 to 2033

Figure 102: Eastern Europe Market Volume (Units) Analysis by Country, 2018 to 2033

Figure 103: Eastern Europe Market Value Share (%) and BPS Analysis by Country, 2023 to 2033

Figure 104: Eastern Europe Market Y-o-Y Growth (%) Projections by Country, 2023 to 2033

Figure 105: Eastern Europe Market Value (US$ Million) Analysis by Automation, 2018 to 2033

Figure 106: Eastern Europe Market Volume (Units) Analysis by Automation, 2018 to 2033

Figure 107: Eastern Europe Market Value Share (%) and BPS Analysis by Automation, 2023 to 2033

Figure 108: Eastern Europe Market Y-o-Y Growth (%) Projections by Automation, 2023 to 2033

Figure 109: Eastern Europe Market Value (US$ Million) Analysis by Machine Type, 2018 to 2033

Figure 110: Eastern Europe Market Volume (Units) Analysis by Machine Type, 2018 to 2033

Figure 111: Eastern Europe Market Value Share (%) and BPS Analysis by Machine Type, 2023 to 2033

Figure 112: Eastern Europe Market Y-o-Y Growth (%) Projections by Machine Type, 2023 to 2033

Figure 113: Eastern Europe Market Value (US$ Million) Analysis by Application, 2018 to 2033

Figure 114: Eastern Europe Market Volume (Units) Analysis by Application, 2018 to 2033

Figure 115: Eastern Europe Market Value Share (%) and BPS Analysis by Application, 2023 to 2033

Figure 116: Eastern Europe Market Y-o-Y Growth (%) Projections by Application, 2023 to 2033

Figure 117: Eastern Europe Market Attractiveness by Automation, 2023 to 2033

Figure 118: Eastern Europe Market Attractiveness by Machine Type, 2023 to 2033

Figure 119: Eastern Europe Market Attractiveness by Application, 2023 to 2033

Figure 120: Eastern Europe Market Attractiveness by Country, 2023 to 2033

Figure 121: South Asia and Pacific Market Value (US$ Million) by Automation, 2023 to 2033

Figure 122: South Asia and Pacific Market Value (US$ Million) by Machine Type, 2023 to 2033

Figure 123: South Asia and Pacific Market Value (US$ Million) by Application, 2023 to 2033

Figure 124: South Asia and Pacific Market Value (US$ Million) by Country, 2023 to 2033

Figure 125: South Asia and Pacific Market Value (US$ Million) Analysis by Country, 2018 to 2033

Figure 126: South Asia and Pacific Market Volume (Units) Analysis by Country, 2018 to 2033

Figure 127: South Asia and Pacific Market Value Share (%) and BPS Analysis by Country, 2023 to 2033

Figure 128: South Asia and Pacific Market Y-o-Y Growth (%) Projections by Country, 2023 to 2033

Figure 129: South Asia and Pacific Market Value (US$ Million) Analysis by Automation, 2018 to 2033

Figure 130: South Asia and Pacific Market Volume (Units) Analysis by Automation, 2018 to 2033

Figure 131: South Asia and Pacific Market Value Share (%) and BPS Analysis by Automation, 2023 to 2033

Figure 132: South Asia and Pacific Market Y-o-Y Growth (%) Projections by Automation, 2023 to 2033

Figure 133: South Asia and Pacific Market Value (US$ Million) Analysis by Machine Type, 2018 to 2033

Figure 134: South Asia and Pacific Market Volume (Units) Analysis by Machine Type, 2018 to 2033

Figure 135: South Asia and Pacific Market Value Share (%) and BPS Analysis by Machine Type, 2023 to 2033

Figure 136: South Asia and Pacific Market Y-o-Y Growth (%) Projections by Machine Type, 2023 to 2033

Figure 137: South Asia and Pacific Market Value (US$ Million) Analysis by Application, 2018 to 2033

Figure 138: South Asia and Pacific Market Volume (Units) Analysis by Application, 2018 to 2033

Figure 139: South Asia and Pacific Market Value Share (%) and BPS Analysis by Application, 2023 to 2033

Figure 140: South Asia and Pacific Market Y-o-Y Growth (%) Projections by Application, 2023 to 2033

Figure 141: South Asia and Pacific Market Attractiveness by Automation, 2023 to 2033

Figure 142: South Asia and Pacific Market Attractiveness by Machine Type, 2023 to 2033

Figure 143: South Asia and Pacific Market Attractiveness by Application, 2023 to 2033

Figure 144: South Asia and Pacific Market Attractiveness by Country, 2023 to 2033

Figure 145: East Asia Market Value (US$ Million) by Automation, 2023 to 2033

Figure 146: East Asia Market Value (US$ Million) by Machine Type, 2023 to 2033

Figure 147: East Asia Market Value (US$ Million) by Application, 2023 to 2033

Figure 148: East Asia Market Value (US$ Million) by Country, 2023 to 2033

Figure 149: East Asia Market Value (US$ Million) Analysis by Country, 2018 to 2033

Figure 150: East Asia Market Volume (Units) Analysis by Country, 2018 to 2033

Figure 151: East Asia Market Value Share (%) and BPS Analysis by Country, 2023 to 2033

Figure 152: East Asia Market Y-o-Y Growth (%) Projections by Country, 2023 to 2033

Figure 153: East Asia Market Value (US$ Million) Analysis by Automation, 2018 to 2033

Figure 154: East Asia Market Volume (Units) Analysis by Automation, 2018 to 2033

Figure 155: East Asia Market Value Share (%) and BPS Analysis by Automation, 2023 to 2033

Figure 156: East Asia Market Y-o-Y Growth (%) Projections by Automation, 2023 to 2033

Figure 157: East Asia Market Value (US$ Million) Analysis by Machine Type, 2018 to 2033

Figure 158: East Asia Market Volume (Units) Analysis by Machine Type, 2018 to 2033

Figure 159: East Asia Market Value Share (%) and BPS Analysis by Machine Type, 2023 to 2033

Figure 160: East Asia Market Y-o-Y Growth (%) Projections by Machine Type, 2023 to 2033

Figure 161: East Asia Market Value (US$ Million) Analysis by Application, 2018 to 2033

Figure 162: East Asia Market Volume (Units) Analysis by Application, 2018 to 2033

Figure 163: East Asia Market Value Share (%) and BPS Analysis by Application, 2023 to 2033

Figure 164: East Asia Market Y-o-Y Growth (%) Projections by Application, 2023 to 2033

Figure 165: East Asia Market Attractiveness by Automation, 2023 to 2033

Figure 166: East Asia Market Attractiveness by Machine Type, 2023 to 2033

Figure 167: East Asia Market Attractiveness by Application, 2023 to 2033

Figure 168: East Asia Market Attractiveness by Country, 2023 to 2033

Figure 169: Middle East and Africa Market Value (US$ Million) by Automation, 2023 to 2033

Figure 170: Middle East and Africa Market Value (US$ Million) by Machine Type, 2023 to 2033

Figure 171: Middle East and Africa Market Value (US$ Million) by Application, 2023 to 2033

Figure 172: Middle East and Africa Market Value (US$ Million) by Country, 2023 to 2033

Figure 173: Middle East and Africa Market Value (US$ Million) Analysis by Country, 2018 to 2033

Figure 174: Middle East and Africa Market Volume (Units) Analysis by Country, 2018 to 2033

Figure 175: Middle East and Africa Market Value Share (%) and BPS Analysis by Country, 2023 to 2033

Figure 176: Middle East and Africa Market Y-o-Y Growth (%) Projections by Country, 2023 to 2033

Figure 177: Middle East and Africa Market Value (US$ Million) Analysis by Automation, 2018 to 2033

Figure 178: Middle East and Africa Market Volume (Units) Analysis by Automation, 2018 to 2033

Figure 179: Middle East and Africa Market Value Share (%) and BPS Analysis by Automation, 2023 to 2033

Figure 180: Middle East and Africa Market Y-o-Y Growth (%) Projections by Automation, 2023 to 2033

Figure 181: Middle East and Africa Market Value (US$ Million) Analysis by Machine Type, 2018 to 2033

Figure 182: Middle East and Africa Market Volume (Units) Analysis by Machine Type, 2018 to 2033

Figure 183: Middle East and Africa Market Value Share (%) and BPS Analysis by Machine Type, 2023 to 2033

Figure 184: Middle East and Africa Market Y-o-Y Growth (%) Projections by Machine Type, 2023 to 2033

Figure 185: Middle East and Africa Market Value (US$ Million) Analysis by Application, 2018 to 2033

Figure 186: Middle East and Africa Market Volume (Units) Analysis by Application, 2018 to 2033

Figure 187: Middle East and Africa Market Value Share (%) and BPS Analysis by Application, 2023 to 2033

Figure 188: Middle East and Africa Market Y-o-Y Growth (%) Projections by Application, 2023 to 2033

Figure 189: Middle East and Africa Market Attractiveness by Automation, 2023 to 2033

Figure 190: Middle East and Africa Market Attractiveness by Machine Type, 2023 to 2033

Figure 191: Middle East and Africa Market Attractiveness by Application, 2023 to 2033

Figure 192: Middle East and Africa Market Attractiveness by Country, 2023 to 2033

Recommendations

Packaging

Beverage Packaging Market

Published : October 2023

Packaging

Powder Packing Machine Market

Published : July 2022

Explore Packaging Insights

View Reports

Tea Packing Machine Market