Reports

- Global Locations -

Headquarters

Future Market Insights, Inc.

Christiana Corporate, 200
Continental Drive, Suite 401,
Newark, Delaware - 19713,
United States

T: +1-845-579-5705

Americas

Future Market Insights, Inc.

616 Corporate Way, Suite 2-9018,
Valley Cottage, NY 10989, United States

T: +1-347-918-3531

MEA

Future Market Insights

1602-6 Jumeirah Bay X2 Tower, Plot No: JLT-PH2-X2A,
Jumeirah Lakes Towers, Dubai,
United Arab Emirates

Europe

Future Market Insights

3rd Floor, 207 Regent Street,
W1B 3HH London
United Kingdom

T: + 44 (0) 20 8123 9659
D: +44 (0) 20 3287 4268

Asia Pacific

Future Market Insights

IndiaLand Global Tech Park, Unit UG-1, Behind Grand HighStreet, Phase 1, Hinjawadi, MH, Pune – 411057, India

Customer Journey Mapping Software Market Outlook (2022 to 2032)

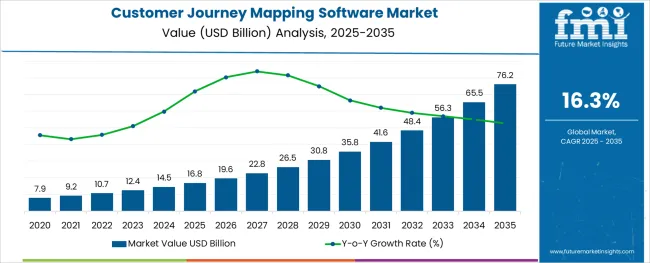
[305 Pages Report] The customer journey mapping software market is anticipated to document a CAGR of 16.3% during the period of 2022 to 2032. The market is anticipated to reach US$ 48.5 Billion in 2032, from US$ 10.7 Billion in 2022.

The global customer journey mapping software market is primarily driven by the increasing adoption of journey mapping software by all types of enterprises., which is an essential factor propelling the market growth during the analysis period.

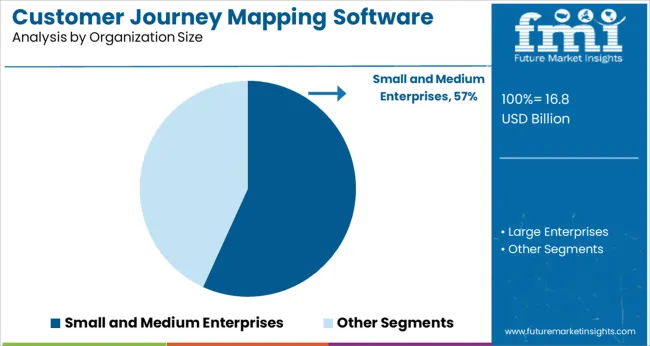
Customer journey mapping is just as essential for SME enterprises as it is for larger companies. Customer prospects are changing for all businesses, regardless of size - customers demand an Omni-channel methodology for customer service, marketing, and sales.

Attributes Details
Customer Journey Mapping Software Market CAGR (2022 to 2032) 16.3%
Customer Journey Mapping Software Market (2022) US$ 10.7 Billion
Customer Journey Mapping Software Market (2032) US$ 48.5 Billion

Don't pay for what you don't need

Customize your report by selecting specific countries or regions and save 30%!

Prominent Customer Journey Mapping Software Market Drivers

Increasing adoption of Journey Mapping Software will boost the market growth

The global customer journey-mapping software market is primarily driven by the increasing adoption of journey-mapping software by all types of enterprises. There is augmenting demand for lead conversion amongst enterprises point of interaction between customers and business needs to be increased.

By using customer journey mapping software, the rate of conversion, as well as the profit, will develop, thus leading conversion amongst enterprises will foster the growth of the industry. The customer journey mapping software is one such program, which aligns the organization’s goals and objectives with its customer. This is also anticipated to boost the market growth over the analysis period.

Further, businesses are more reliant on extending their tools and platforms on the cloud, and the adoption of cloud-based platforms has been developed over the past years, owing to factors such as ease of deployment, cost-effectiveness, flexibility, and increased productivity.

Customer Journey Mapping Software Market

The market players are offering dedicated cloud-based customer journey mapping software. This will significantly intensify the growth of the Customer Journey Mapping Software Market during the forecast period.

How Are Advancements In Digitalization Expected To Fuel Market Growth?

The advancement in digital technology has led businesses to rethink their business model around their customers, the rate of adoption of smart devices has increased over the years and the customer experience model is also changing. Companies are adopting digital technologies to stay ahead of their competitors. Digital transformation will force companies to find solutions that will transform their business instead of the old ways of working.

Customer journey mapping provides companies with efficient mapping techniques by analyzing customer journeys, which is expected to provide new opportunities for customer journey mapping software provider companies. Thus, digital transformation will accelerate the growth of the customer journey mapping software market in the forthcoming years.

For instance, CRMs are considered one form of customer journey mapping tool because they help companies keep track of their customers through various touchpoints including email interaction history and contact center conversations among others.

Sudip Saha
Sudip Saha

Principal Consultant

Talk to Analyst

Find your sweet spots for generating winning opportunities in this market.

Key Challenges Affecting The Customer Journey Mapping Software Market Growth

Difficulty in quantifying Customer Experience ROI

All organizations want to measure and manage their efforts with numbers. Quantifying the ROI of customer experience is the toughest challenge for CX leaders, but it is most important for brands to justify financial results. Organizations across industries struggle to connect customer behavior and journeys to business-critical KPIs, such as revenue, churn, and cost to serve.

The organization faces an inability to measure the impact of CX on business outcomes, which makes it difficult to secure a CX budget. Organizations that are challenged to quantify the ROI of CX initiatives report stagnant budgets or small decreases. Without resources, CX leaders cannot invest in the technology necessary to effectively measure and improve customer experience. Investing in CX brings a strong return on investment.

The key is using data to prove the ROI of CX. Investing in customer experience builds a powerful lifeline between customers and the company. A large amount of structured and unstructured databases require significant resources, such as money, time, and employees, to analyze. This creates issues that block the optimum ROI from customer journey analytics.

Data Security and Privacy Concerns

Security threats are projected to grow even further in the future. In the past four years, the financial impact of cybercrimes has increased by nearly 78%, and the time it takes to resolve cyberattacks has doubled. There are privacy concerns that are faced by many businesses.

The data stored on the cloud is at risk, which in turn is expected to restrain the growth of the global Customer Journey Mapping Software Market. Data breaches are frequent theft faced by various organizations. These threats are hijacking, insider threats, malware injection, and insecure APIs.

Key Trends For Customer Journey Mapping Software Market

How Does the Focus on Virtual Touchpoints Propel Market Growth?

The emergence of technologies such as artificial intelligence (AI) is expected to create enormous revenue growth opportunities for the customer journey mapping market to provide a convenient, intelligent, and informed customer experience at any point along the customer journey. This will lead to re-structure customer experiences and end-to-end customer journey patterns that are unified around personal information.

In addition, with the proliferation of machine learning capabilities in behavioral analytics, the new generation of data unification tools will make the daunting task of data synchronization cost-efficient, fast, and relatively pain-free. In-the-moment engagement models will lead the customer journey analytics SaaS platforms to deliver comprehensive real-time touchpoint integration with minimal investment.

Cross-channel journey analytics with the launch of advanced applications such as chatbots, virtual assistants, and others, is further expected to boost the growth of the market in the near future.

Rise in demand for Real-Time Customer Journey Mapping for generating Actionable Insights

In today’s digital and big data era, data can be structured or unstructured, and most of it resides outside enterprises. Thus, it has become crucial to have a platform that can be used to integrate various customer information.

Currently, enterprises need a comprehensive customer journey analytics platform that can collect a high volume of customer data in real-time to provide meaningful insights. This can assimilate data, structure, refine, provide the exploratory capability, identify and evaluate various patterns, and help make insight-based decisions faster.

Customer journey mapping offers layers that enable users to explore data in understanding customer needs and project trends and draw valuable insights using known analysis methods, such as sales and marketing optimization, cost optimization, risk management, and social network analysis.

The latest data and analytics tools are projected to provide growth opportunities to analyze data for the benefit of customers and the market. They help in making changes in internal processes and developing the product and service model.

Get the data you need at a Fraction of the cost

Personalize your report by choosing insights you need
and save 40%!

Comparative Analysis Of The Adjacent Customer Journey Mapping Software Market

Customer Journey Mapping Software Market:

Attributes Customer Journey Mapping Software Market
CAGR (2022 to 2032) 16.3%
Market Value (2032) US$ 48.5 Billion
Growth Factor The rise in the adoption of cloud-based products and services by SMEs across the globe is expected to fuel market growth.
Opportunity Increasing focus on improving data quality and security of customer data has created an opportunity for new providers to enter the market with innovative solutions, which are driving competition among established players as well.
Key Trends A strong focus on customer experience is boosting demand for Customer Journey Mapping.

Customer Journey Analytics Software Market:

Attributes Customer Journey Analytics Software Market
CAGR (2022 to 2032) 20.3%
Market Value (2032) US$ 42.0 Billion
Growth Factor The adoption of advanced analytics solutions to leverage the increasing customer data and reduce customer churn rate.
Opportunity A higher focus on better customer engagement strategies through omnichannel.
Key Trends The growing need to provide seamless customer experience is expected to fuel market growth.

Customer-to-Customer (C2C) Community Marketing Software Market:

Attributes Customer-to-Customer (C2C) Community Marketing Software Market
CAGR (2022 to 2032) 6.2%
Market Value (2032) US$ 2.8 Billion
Growth Factor By building online communities for customers organizations are able to promote brand loyalty, which subsequently helps to retain customers and increase the goodwill of the brand which is a major factor driving the customer-to-customer (C2C) community marketing software market.
Opportunity C2C solutions help organizations to map customer behavior, which is fueling the adoption of customer-to-customer (C2C) community marketing software.
Key Trends C2C solutions offer features such as community building, branding distribution, member onboarding, event management, promotion, and analytics.

Category Wise Analysis For Customer Journey Mapping Software Market

Which Enterprise Type dominates the growth of the Customer Journey Mapping Software Market?

Large Enterprises segment to witness considerable CAGR for the market growth

The large enterprise's segment of the customer journey mapping software market accounts for the highest CAGR of 15.8% during the forecast period, attributed to the increasing demand, particularly from this segment.

Customer experience journey mapping software helps large enterprises understand a customer’s full experience using effective visualizations. It also helps to improve and intensify the full customer experience by generating a visualization of every customer touchpoint.

By Offering, which segment is expected to represent the highest CAGR?

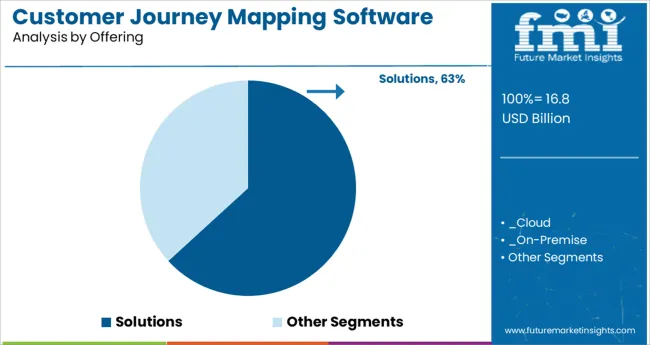
The solutions segment is likely to be the highest CAGR holder for the market growth

The solutions segment of the customer journey mapping software market is expected to grow at the highest CAGR of 16.0% during the forecast period. Under the solutions segment, cloud-based deployment of customer journey mapping software will dominate the market over the forecast period, as the cloud technology provides better flexibility, a high degree of security, and a level of control and it is also a cost-effective solution.

Cloud deployment helps businesses to accomplish cross-channel communication with their customers, enabling them to send information via emails, text messages, push alerts, in-app, and web notifications, as well as on-site warnings. It can also be used to share online and offline reviews as well as feedback reports with customers.
Region Wise Analysis For Customer Journey Mapping Software Market

How Opportunistic will the Market for Customer Journey Mapping Software be across North America?

Adoption of new technology to Widen the Scope of the market in North America

North America is expected to dominate the customer journey mapping software market, owing to the immediate adoption of new and emerging technologies and the presence of significant market players in the region.

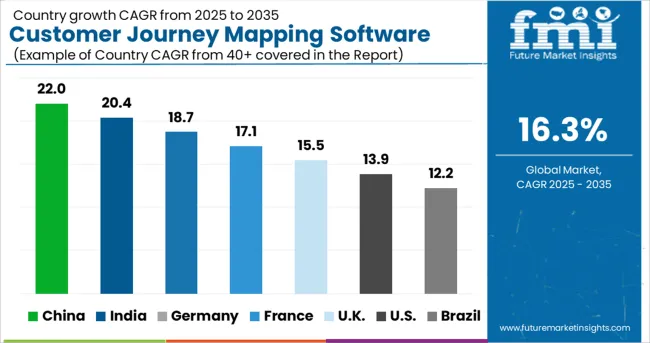
The USA is expected to hold a significant position in the global customer journey mapping software market, experiencing a CAGR of 16.1% during the forecast period.

Will Asia-Pacific Emerge as an Attractive Customer Journey Mapping Software Market?

Customer Journey Mapping Software Market in China to Witness Better Growth Opportunities

The Asia Pacific region is expected to grow at the highest CAGR during the forecast period, owing to the growing adoption of customer journey mapping software. The growing awareness for enhancing customer experience in key countries, such as China, India, and Japan, is expected to fuel the adoption of customer journey analytics solutions and services.

In addition, the commercialization of AI and ML technology, giving rise to increased customer data, and the need for further advancements to leverage its benefits to the maximum are expected to drive the adoption of the customer journey mapping software market in the region. China is expected to represent the highest CAGR of 15.7% in the customer journey mapping software market during the forecast period.
Who are the Key Competitors in the Customer Journey Mapping Software Market?

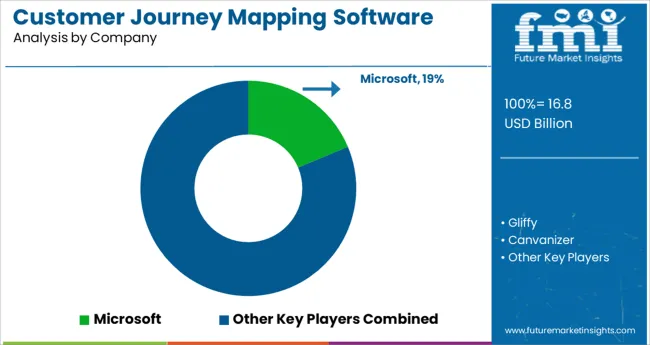
Microsoft, Gliffy, Canvanizer, Xmind, OmniGraffle, Smaply, Touchpoint, IBM, Smartlook, UXPressia, Piwik PRO, and Custellence, among others are the top companies in the global customer journey mapping software market.

With a sizable customer journey mapping software market share, these main firms are concentrating on growing their consumer base into new countries. These businesses are making use of strategic collaboration initiatives to grow their market share and profits.

Mid-size and smaller businesses, on the other hand, are expanding their market presence by gaining new contracts and entering new markets, thanks to technical developments and product innovations.

Recent Developments

  • In January 2021, NICE introduced new integrated features between NICE inContact CXone and Microsoft Teams in January 2021, enabling real-time recording and compatibility with a variety of connected applications. Customers will be able to secure every interaction utilizing global, carrier-grade voice services as a result of the deployment of new capabilities.
  • In December 2020, Genesys launched Genesys Digital, a new business segment, which will focus on enabling businesses to keep up with customers’ growing preferences for digital involvement throughout the customer experience, whether through webchat for an inquiry, SMS appointment scheduling, or chatbot support.
  • In November 2020, NICE and NTT Data Germany signed a strategic cooperation with CXone, and the alliance intends to improve customer experience and accelerate cloud transformations. NTT DATA will sell and support the full NICE product suite in the EMEA region, including CXone, NICE Nexidia Analytics, and NICE Robotic Automation, as a strategic partner.
  • In November 2020, SAP finalized the acquisition of Emarsys, an omnichannel customer engagement platform supplier. The SAP Customer Experience portfolio includes Emarsys products. SAP will be able to engage customers and deliver hyper-personalized, omnichannel engagements in real-time thanks to the addition of Emarsys products to the SAP Customer Experience portfolio.

By Key Players

  • Microsoft
  • Gliffy
  • Canvanizer
  • Xmind
  • OmniGraffle
  • Smaply
  • Touchpoint
  • IBM
  • Smartlook
  • UXPressia
  • Piwik PRO
  • Custellence

Key Segments Covered In The Customer Journey Mapping Software Industry Analysis

By Offering:

  • Solutions
    • Cloud
    • On-Premise
  • Services

By Organization Size:

  • Small and Medium Enterprises
  • Large Enterprises

By End User:

  • BFSI
  • Retail and Consumer Goods
  • Media and Entertainment
  • Healthcare and Pharmaceutical
  • Automotive
  • IT and Telecommunication
  • Travel and Hospitality
  • Education
  • Other End Users

By Platform:

  • Web-based
  • App-based

By Region:

  • North America
  • Latin America
  • Europe
  • Asia Pacific
  • Middle East and Africa

Frequently Asked Questions

What was the market value for customer journey mapping software in 2021?

As of 2021, the market for customer journey mapping software was valued at US$ 9.1 Billion, as per FMI

At what value did the customer journey mapping software market close in 2022?

By 2022 end, sales of customer journey mapping software closed at a value of US$ 10.7 Billion

What was the last 6 years value CAGR for customer journey mapping software?

From 2015 to 2021, customer journey mapping software demand expanded at a CAGR of 17.8%

What is the projected forecast CAGR for the customer journey mapping software industry from 2022 to 2032?

From 2022 to 2032, customer journey mapping software sales are expected to flourish at a CAGR of 16.3%

According to FMI, what is the anticipated market value for customer journey mapping software in 2032?

By 2032, the market value of customer journey mapping software is expected to reach US$ 48.5 Billion.

At what percentage will customer journey mapping software demand accelerate across the USA?

From 2022 to 2032, customer journey mapping software demand in the USA is expected to surge at a CAGR of 16.1%

By organization size, which category ranks first with regard to customer journey mapping software?

By enterprise size, the large enterprise category constitutes the bulk of market share with a CAGR of 15.8%.

By offering, which category ranks first with regard to customer journey mapping software?

By offering, the solutions category is expected to dominate the market with a CAGR of 16.0%.

Table of Content

1. Executive Summary | Customer Journey Mapping Software Market

    1.1. Global Market Outlook

    1.2. Summary of Statistics

    1.3. Key Market Characteristics & Attributes

    1.4. FMI Analysis and Recommendations

2. Market Overview

    2.1. Market Coverage

    2.2. Market Definition

3. Market Risks and Trends Assessment 

    3.1. Risk Assessment

        3.1.1. COVID-19 Crisis and Impact on Customer Journey Mapping Software

        3.1.2. COVID-19 Impact Benchmark with Previous Crisis

        3.1.3. Impact on Market Value (US$ Million)

        3.1.4. Assessment by Key Countries

        3.1.5. Assessment by Key Market Segments

        3.1.6. Action Points and Recommendation for Suppliers

    3.2. Key Trends Impacting the Market

    3.3. Formulation and Product Development Trends

4. Market Background 

    4.1. Market, by Key Countries

    4.2. Market Opportunity Assessment (US$ Million)

        4.2.1. Total Available Market

        4.2.2. Serviceable Addressable Market

        4.2.3. Serviceable Obtainable Market

    4.3. Market Scenario Forecast

        4.3.1. Demand in Optimistic Scenario

        4.3.2. Demand in Likely Scenario

        4.3.3. Demand in Conservative Scenario

    4.4. Investment Feasibility Analysis

        4.4.1. Investment in Established Markets

            4.4.1.1. In Short Term

            4.4.1.2. In Long Term

        4.4.2. Investment in Emerging Markets

            4.4.2.1. In Short Term

            4.4.2.2. In Long Term

    4.5. Forecast Factors - Relevance & Impact

        4.5.1. Top Companies Historical Growth

        4.5.2. Growth in Automation, By Country

        4.5.3. Adoption Rate, By Country

    4.6. Market Dynamics

        4.6.1. Market Driving Factors and Impact Assessment

        4.6.2. Prominent Market Challenges and Impact Assessment

        4.6.3. Market Opportunities

        4.6.4. Prominent Trends in the Global Market & Their Impact Assessment

5. Key Success Factors 

    5.1. Manufacturers’ Focus on Low Penetration High Growth Markets

    5.2. Banking on with Segments High Incremental Opportunity

    5.3. Peer Benchmarking

6. Global Market Demand Analysis 2015 to 2021 and Forecast, 2022 to 2032

    6.1. Historical Market Analysis, 2015 to 2021

    6.2. Current and Future Market Projections, 2022 to 2032

    6.3. Y-o-Y Growth Trend Analysis

7. Global Market Value Analysis 2015 to 2021 and Forecast, 2022 to 2032

    7.1. Historical Market Value (US$ Million) Analysis, 2015 to 2021

    7.2. Current and Future Market Value (US$ Million) Projections, 2022 to 2032

        7.2.1. Y-o-Y Growth Trend Analysis

        7.2.2. Absolute $ Opportunity Analysis

8. Global Market Analysis 2015 to 2021 and Forecast 2022 to 2032, By Offering

    8.1. Introduction / Key Findings

    8.2. Historical Market Size (US$ Million) Analysis By Offering, 2015 to 2021

    8.3. Current and Future Market Size (US$ Million) Analysis and Forecast By Offering, 2022 to 2032

        8.3.1. Solutions

            8.3.1.1. Cloud

            8.3.1.2. On-Premise

        8.3.2. Services

    8.4. Market Attractiveness Analysis By Offering

9. Global Market Analysis 2015 to 2021 and Forecast 2022 to 2032, By Organization Size

    9.1. Introduction / Key Findings

    9.2. Historical Market Size (US$ Million) Analysis By Organization Size, 2015 to 2021

    9.3. Current and Future Market Size (US$ Million) Analysis and Forecast By Organization Size, 2022 to 2032

        9.3.1. Small and Medium Enterprises

        9.3.2. Large Enterprises

    9.4. Market Attractiveness Analysis By Organization Size

10. Global Market Analysis 2015 to 2021 and Forecast 2022 to 2032, By End-User

    10.1. Introduction / Key Findings

    10.2. Historical Market Size (US$ Million) Analysis By End-User, 2015 to 2021

    10.3. Current and Future Market Size (US$ Million) Analysis and Forecast By End-User, 2022 to 2032

        10.3.1. BFSI

        10.3.2. Retail and Consumer Goods

        10.3.3. Media and Entertainment

        10.3.4. Healthcare and Pharmaceutical

        10.3.5. Automotive

        10.3.6. IT and Telecommunication

        10.3.7. Travel and Hospitality

        10.3.8. Education

        10.3.9. Others

    10.4. Market Attractiveness Analysis By End-User

11. Global Market Analysis 2015 to 2021 and Forecast 2022 to 2032, By Platform

    11.1. Introduction / Key Findings

    11.2. Historical Market Size (US$ Million) Analysis By Platform, 2015 to 2021

    11.3. Current and Future Market Size (US$ Million) Analysis and Forecast By Platform, 2022 to 2032

        11.3.1. Web-based

        11.3.2. App-based

    11.4. Market Attractiveness Analysis By Platform

12. Global Market Analysis 2015 to 2021 and Forecast 2022 to 2032, By Region

    12.1. Introduction

    12.2. Historical Market Size (US$ Million) Analysis By Region, 2015 to 2021

    12.3. Current Market Size (US$ Million) & Analysis and Forecast By Region, 2022 to 2032

        12.3.1. North America

        12.3.2. Latin America

        12.3.3. Europe

        12.3.4. Asia Pacific

        12.3.5. Middle East and Africa (MEA)

    12.4. Market Attractiveness Analysis By Region

13. North America Market Analysis 2015 to 2021 and Forecast 2022 to 2032

    13.1. Introduction

    13.2. Pricing Analysis

    13.3. Historical Market Value (US$ Million) Trend Analysis By Market Taxonomy, 2015 to 2021

    13.4. Market Value (US$ Million) & Forecast By Market Taxonomy, 2022 to 2032

        13.4.1. By Country

            13.4.1.1. United States of America

            13.4.1.2. Canada

            13.4.1.3. Rest of North America

        13.4.2. By Offering

        13.4.3. By Organization Size

        13.4.4. By Platform

        13.4.5. By End-User

    13.5. Market Attractiveness Analysis

        13.5.1. By Country

        13.5.2. By Offering

        13.5.3. By Organization Size

        13.5.4. By Platform

        13.5.5. By End-User

14. Latin America Market Analysis 2015 to 2021 and Forecast 2022 to 2032

    14.1. Introduction

    14.2. Pricing Analysis

    14.3. Historical Market Value (US$ Million) Trend Analysis By Market Taxonomy, 2015 to 2021

    14.4. Market Value (US$ Million) & Forecast By Market Taxonomy, 2022 to 2032

        14.4.1. By Country

            14.4.1.1. Brazil

            14.4.1.2. Mexico

            14.4.1.3. Rest of Latin America

        14.4.2. By Offering

        14.4.3. By Organization Size

        14.4.4. By Platform

        14.4.5. By End-User

    14.5. Market Attractiveness Analysis

        14.5.1. By Country

        14.5.2. By Offering

        14.5.3. By Organization Size

        14.5.4. By Platform

        14.5.5. By End-User

15. Europe Market Analysis 2015 to 2021 and Forecast 2022 to 2032

    15.1. Introduction

    15.2. Pricing Analysis

    15.3. Historical Market Value (US$ Million) Trend Analysis By Market Taxonomy, 2015 to 2021

    15.4. Market Value (US$ Million) & Forecast By Market Taxonomy, 2022 to 2032

        15.4.1. By Country

            15.4.1.1. Germany

            15.4.1.2. France

            15.4.1.3. United Kingdom

            15.4.1.4. Italy

            15.4.1.5. Benelux

            15.4.1.6. Nordic Countries

            15.4.1.7. Rest of Europe

        15.4.2. By Offering

        15.4.3. By Organization Size

        15.4.4. By Platform

        15.4.5. By End-User

    15.5. Market Attractiveness Analysis

        15.5.1. By Country

        15.5.2. By Offering

        15.5.3. By Organization Size

        15.5.4. By Platform

        15.5.5. By End-User

16. Asia Pacific Market Analysis 2015 to 2021 and Forecast 2022 to 2032

    16.1. Introduction

    16.2. Pricing Analysis

    16.3. Historical Market Value (US$ Million) Trend Analysis By Market Taxonomy, 2015 to 2021

    16.4. Market Value (US$ Million) & Forecast By Market Taxonomy, 2022 to 2032

        16.4.1. By Country

            16.4.1.1. China

            16.4.1.2. Japan

            16.4.1.3. South Korea

            16.4.1.4. Rest of Asia Pacific

        16.4.2. By Offering

        16.4.3. By Organization Size

        16.4.4. By Platform

        16.4.5. By End-User

    16.5. Market Attractiveness Analysis

        16.5.1. By Country

        16.5.2. By Offering

        16.5.3. By Organization Size

        16.5.4. By Platform

        16.5.5. By End-User

17. Middle East and Africa Market Analysis 2015 to 2021 and Forecast 2022 to 2032

    17.1. Introduction

    17.2. Pricing Analysis

    17.3. Historical Market Value (US$ Million) Trend Analysis By Market Taxonomy, 2015 to 2021

    17.4. Market Value (US$ Million) & Forecast By Market Taxonomy, 2022 to 2032

        17.4.1. By Country

            17.4.1.1. GCC Countries

            17.4.1.2. South Africa

            17.4.1.3. Turkey

            17.4.1.4. Rest of Middle East and Africa

        17.4.2. By Offering

        17.4.3. By Organization Size

        17.4.4. By Platform

        17.4.5. By End-User

    17.5. Market Attractiveness Analysis

        17.5.1. By Country

        17.5.2. By Offering

        17.5.3. By Organization Size

        17.5.4. By Platform

        17.5.5. By End-User

18. Key Countries Market Analysis 2015 to 2021 and Forecast 2022 to 2032

    18.1. Introduction

        18.1.1. Market Value Proportion Analysis, By Key Countries

        18.1.2. Global Vs. Country Growth Comparison

    18.2. US Market Analysis

        18.2.1. Value Proportion Analysis by Market Taxonomy

        18.2.2. Value Analysis and Forecast by Market Taxonomy, 2015 to 2032

            18.2.2.1. By Offering

            18.2.2.2. By Organization Size

            18.2.2.3. By Platform

            18.2.2.4. By End-User

    18.3. Canada Market Analysis

        18.3.1. Value Proportion Analysis by Market Taxonomy

        18.3.2. Value Analysis and Forecast by Market Taxonomy, 2015 to 2032

            18.3.2.1. By Offering

            18.3.2.2. By Organization Size

            18.3.2.3. By Platform

            18.3.2.4. By End-User

    18.4. Mexico Market Analysis

        18.4.1. Value Proportion Analysis by Market Taxonomy

        18.4.2. Value Analysis and Forecast by Market Taxonomy, 2015 to 2032

            18.4.2.1. By Offering

            18.4.2.2. By Organization Size

            18.4.2.3. By Platform

            18.4.2.4. By End-User

    18.5. Brazil Market Analysis

        18.5.1. Value Proportion Analysis by Market Taxonomy

        18.5.2. Value Analysis and Forecast by Market Taxonomy, 2015 to 2032

            18.5.2.1. By Offering

            18.5.2.2. By Organization Size

            18.5.2.3. By Platform

            18.5.2.4. By End-User

    18.6. Germany Market Analysis

        18.6.1. Value Proportion Analysis by Market Taxonomy

        18.6.2. Value Analysis and Forecast by Market Taxonomy, 2015 to 2032

            18.6.2.1. By Offering

            18.6.2.2. By Organization Size

            18.6.2.3. By Platform

            18.6.2.4. By End-User

    18.7. France Market Analysis

        18.7.1. Value Proportion Analysis by Market Taxonomy

        18.7.2. Value Analysis and Forecast by Market Taxonomy, 2015 to 2032

            18.7.2.1. By Offering

            18.7.2.2. By Organization Size

            18.7.2.3. By Platform

            18.7.2.4. By End-User

    18.8. Italy Market Analysis

        18.8.1. Value Proportion Analysis by Market Taxonomy

        18.8.2. Value Analysis and Forecast by Market Taxonomy, 2015 to 2032

            18.8.2.1. By Offering

            18.8.2.2. By Organization Size

            18.8.2.3. By Platform

            18.8.2.4. By End-User

    18.9. BENELUX Market Analysis

        18.9.1. Value Proportion Analysis by Market Taxonomy

        18.9.2. Value Analysis and Forecast by Market Taxonomy, 2015 to 2032

            18.9.2.1. By Offering

            18.9.2.2. By Organization Size

            18.9.2.3. By Platform

            18.9.2.4. By End-User

    18.10. UK Market Analysis

        18.10.1. Value Proportion Analysis by Market Taxonomy

        18.10.2. Value Analysis and Forecast by Market Taxonomy, 2015 to 2032

            18.10.2.1. By Offering

            18.10.2.2. By Organization Size

            18.10.2.3. By Platform

            18.10.2.4. By End-User

    18.11. Nordic Countries Market Analysis

        18.11.1. Value Proportion Analysis by Market Taxonomy

        18.11.2. Value Analysis and Forecast by Market Taxonomy, 2015 to 2032

            18.11.2.1. By Offering

            18.11.2.2. By Organization Size

            18.11.2.3. By Platform

            18.11.2.4. By End-User

    18.12. China Market Analysis

        18.12.1. Value Proportion Analysis by Market Taxonomy

        18.12.2. Value Analysis and Forecast by Market Taxonomy, 2015 to 2032

            18.12.2.1. By Offering

            18.12.2.2. By Organization Size

            18.12.2.3. By Platform

            18.12.2.4. By End-User

    18.13. Japan Market Analysis

        18.13.1. Value Proportion Analysis by Market Taxonomy

        18.13.2. Value Analysis and Forecast by Market Taxonomy, 2015 to 2032

            18.13.2.1. By Offering

            18.13.2.2. By Organization Size

            18.13.2.3. By Platform

            18.13.2.4. By End-User

    18.14. South Korea Market Analysis

        18.14.1. Value Proportion Analysis by Market Taxonomy

        18.14.2. Value Analysis and Forecast by Market Taxonomy, 2015 to 2032

            18.14.2.1. By Offering

            18.14.2.2. By Organization Size

            18.14.2.3. By Platform

            18.14.2.4. By End-User

    18.15. GCC Countries Market Analysis

        18.15.1. Value Proportion Analysis by Market Taxonomy

        18.15.2. Value Analysis and Forecast by Market Taxonomy, 2015 to 2032

            18.15.2.1. By Offering

            18.15.2.2. By Organization Size

            18.15.2.3. By Platform

            18.15.2.4. By End-User

    18.16. South Africa Market Analysis

        18.16.1. Value Proportion Analysis by Market Taxonomy

        18.16.2. Value Analysis and Forecast by Market Taxonomy, 2015 to 2032

            18.16.2.1. By Offering

            18.16.2.2. By Organization Size

            18.16.2.3. By Platform

            18.16.2.4. By End-User

    18.17. Turkey Market Analysis

        18.17.1. Value Proportion Analysis by Market Taxonomy

        18.17.2. Value Analysis and Forecast by Market Taxonomy, 2015 to 2032

            18.17.2.1. By Offering

            18.17.2.2. By Organization Size

            18.17.2.3. By Platform

            18.17.2.4. By End-User

        18.17.3. Competition Landscape and Player Concentration in the Country

19. Market Structure Analysis

    19.1. Market Analysis by Tier of Companies

    19.2. Market Concentration

    19.3. Market Share Analysis of Top Players

    19.4. Market Presence Analysis

        19.4.1. By Regional Footprint of Players

        19.4.2. Product Footprint by Players

20. Competition Analysis

    20.1. Competition Dashboard

    20.2. Competition Benchmarking

    20.3. Competition Deep Dive

        20.3.1. Acquia Inc.

            20.3.1.1. Overview

            20.3.1.2. Product Portfolio

            20.3.1.3. Sales Footprint

            20.3.1.4. Strategy Overview

        20.3.2. Adobe

            20.3.2.1. Overview

            20.3.2.2. Product Portfolio

            20.3.2.3. Sales Footprint

            20.3.2.4. Strategy Overview

        20.3.3. Cemantica

            20.3.3.1. Overview

            20.3.3.2. Product Portfolio

            20.3.3.3. Sales Footprint

            20.3.3.4. Strategy Overview

        20.3.4. Genpact

            20.3.4.1. Overview

            20.3.4.2. Product Portfolio

            20.3.4.3. Sales Footprint

            20.3.4.4. Strategy Overview

        20.3.5. Smaply

            20.3.5.1. Overview

            20.3.5.2. Product Portfolio

            20.3.5.3. Sales Footprint

            20.3.5.4. Strategy Overview

        20.3.6. UXPressia

            20.3.6.1. Overview

            20.3.6.2. Product Portfolio

            20.3.6.3. Sales Footprint

            20.3.6.4. Strategy Overview

        20.3.7. WebEngage

            20.3.7.1. Overview

            20.3.7.2. Product Portfolio

            20.3.7.3. Sales Footprint

            20.3.7.4. Strategy Overview

21. Assumptions and Acronyms Used

22. Research Methodology

List of Tables

Table 01: Global Market Value (US$ Million), By Offering, 2015 to 2021

Table 02: Global Market Value (US$ Million), By Offering, 2022 to 2032

Table 03: Global Market Value (US$ Million), By Organization Size, 2015 to 2021

Table 04: Global Market Value (US$ Million), By Organization Size, 2022 to 2032

Table 05: Global Market Value (US$ Million), By End-User, 2015 to 2021

Table 06: Global Market Value (US$ Million), By End-User, 2022 to 2032

Table 07: Global Market Value (US$ Million), By Platform, 2015 to 2021

Table 08: Global Market Value (US$ Million), By Platform, 2022 to 2032

Table 09: Global Market, By Region, 2015 to 2021

Table 10: Global Market, By Region, 2022 to 2032

Table 11: North America Market Value (US$ Million), By Offering, 2015 to 2021

Table 12: North America Market Value (US$ Million), By Offering, 2022 to 2032

Table 13: North America Market Value (US$ Million), By Organization Size, 2015 to 2021

Table 14: North America Market Value (US$ Million), By Organization Size, 2022 to 2032

Table 15: North America Market Value (US$ Million), By End-User, 2015 to 2021

Table 16: North America Market Value (US$ Million), By End-User, 2022 to 2032

Table 17: North America Market Value (US$ Million), By Platform, 2015 to 2021

Table 18: North America Market Value (US$ Million), By Platform, 2022 to 2032

Table 19: North America Market, By Country, 2015 to 2021

Table 20: North America Market, By Country, 2022 to 2032

Table 21: Latin America Market Value (US$ Million), By Offering, 2015 to 2021

Table 22: Latin America Market Value (US$ Million), By Offering, 2022 to 2032

Table 23: Latin America Market Value (US$ Million), By Organization Size, 2015 to 2021

Table 24: Latin America Market Value (US$ Million), By Organization Size, 2022 to 2032

Table 25: Latin America Market Value (US$ Million), By End-User, 2015 to 2021

Table 26: Latin America Market Value (US$ Million), By End-User, 2022 to 2032

Table 27: Latin America Market Value (US$ Million), By Platform, 2015 to 2021

Table 28: Latin America Market Value (US$ Million), By Platform, 2022 to 2032

Table 29: Latin America Market, By Country, 2015 to 2021

Table 30: Latin America Market, By Country, 2022 to 2032

Table 31: Europe Market Value (US$ Million), By Offering, 2015 to 2021

Table 32: Europe Market Value (US$ Million), By Offering, 2022 to 2032

Table 33: Europe Market Value (US$ Million), By Organization Size, 2015 to 2021

Table 34: Europe Market Value (US$ Million), By Organization Size, 2022 to 2032

Table 35: Europe Market Value (US$ Million), By End-User, 2015 to 2021

Table 36: Europe Market Value (US$ Million), By End-User, 2022 to 2032

Table 37: Europe Market Value (US$ Million), By Platform, 2015 to 2021

Table 38: Europe Market Value (US$ Million), By Platform, 2022 to 2032

Table 39: Europe Market, By Country, 2015 to 2021

Table 40: Europe Market, By Country, 2022 to 2032

Table 41: Asia Pacific Market Value (US$ Million), By Offering, 2015 to 2021

Table 42: Asia Pacific Market Value (US$ Million), By Offering, 2022 to 2032

Table 43: Asia Pacific Market Value (US$ Million), By Organization Size, 2015 to 2021

Table 44: Asia Pacific Market Value (US$ Million), By Organization Size, 2022 to 2032

Table 45: Asia Pacific Market Value (US$ Million), By End-User, 2015 to 2021

Table 46: Asia Pacific Market Value (US$ Million), By End-User, 2022 to 2032

Table 47: Asia Pacific Market Value (US$ Million), By Platform, 2015 to 2021

Table 48: Asia Pacific Market Value (US$ Million), By Platform, 2022 to 2032

Table 49: Asia Pacific Market, By Country, 2015 to 2021

Table 50: Asia Pacific Market, By Country, 2022 to 2032

Table 51: MEA Market Value (US$ Million), By Offering, 2015 to 2021

Table 52: MEA Market Value (US$ Million), By Offering, 2022 to 2032

Table 53: MEA Market Value (US$ Million), By Organization Size, 2015 to 2021

Table 54: MEA Market Value (US$ Million), By Organization Size, 2022 to 2032

Table 55: MEA Market Value (US$ Million), By End-User, 2015 to 2021

Table 56: MEA Market Value (US$ Million), By End-User, 2022 to 2032

Table 57: MEA Market Value (US$ Million), By Platform, 2015 to 2021

Table 58: MEA Market Value (US$ Million), By Platform, 2022 to 2032

Table 59: MEA Market, By Country, 2015 to 2021

Table 60: MEA Market, By Country, 2022 to 2032

List of Charts

Figure 01: Global Market Value (US$ Million) and Year-on-Year Growth, 2015 to 2032

Figure 02: Global Market Absolute $ Historical Gain (2015 to 2021) and Opportunity (2022 to 2032), US$ Million

Figure 03: Global Market Share, By Offering, 2022 & 2032

Figure 04: Global Market Y-o-Y Growth Projections, By Offering - 2022 to 2032

Figure 05: Global Market Attractiveness Index, By Offering - 2022 to 2032

Figure 06: Global Market Share, By Organization Size, 2022 & 2032

Figure 07: Global Market Y-o-Y Growth Projections, By Organization Size - 2022 to 2032

Figure 08: Global Market Attractiveness Index, By Organization Size - 2022 to 2032

Figure 09: Global Market Share, By Platform, 2022 & 2032

Figure 10: Global Market Y-o-Y Growth Projections, By Platform - 2022 to 2032

Figure 11: Global Market Attractiveness Index, By Platform - 2022 to 2032

Figure 12: Global Market Share, By End-User, 2022 & 2032

Figure 13: Global Market Y-o-Y Growth Projections, By End-User - 2022 to 2032

Figure 14: Global Market Attractiveness Index, By End-User - 2022 to 2032

Figure 15: Global Market Share, By Region, 2022 & 2032

Figure 16: Global Market Y-o-Y Growth Projections, By Region - 2022 to 2032

Figure 17: Global Market Attractiveness Index, By Region - 2022 to 2032

Figure 18: North America Market Value (US$ Million) and Year-on-Year Growth, 2015 to 2032

Figure 19: North America Market Absolute $ Opportunity Historical (2015 to 2021) and Forecast Period (2022 to 2032), US$ Million

Figure 20: North America Market Share, By Offering, 2022 & 2032

Figure 21: North America Market Y-o-Y Growth Projections, By Offering - 2022 to 2032

Figure 22: North America Market Attractiveness Index, By Offering - 2022 to 2032

Figure 23: North America Market Share, By Organization Size, 2022 & 2032

Figure 24: North America Market Y-o-Y Growth Projections, By Organization Size - 2022 to 2032

Figure 25: North America Market Attractiveness Index, By Organization Size - 2022 to 2032

Figure 26: North America Market Share, By Platform, 2022 & 2032

Figure 27: North America Market Y-o-Y Growth Projections, By Platform - 2022 to 2032

Figure 28: North America Market Attractiveness Index, By Platform - 2022 to 2032

Figure 29: North America Market Share, By End-User, 2022 & 2032

Figure 30: North America Market Y-o-Y Growth Projections, By End-User - 2022 to 2032

Figure 31: North America Market Attractiveness Index, By End-User - 2022 to 2032

Figure 32: North America Market Share, By Country, 2022 & 2032

Figure 33: North America Market Y-o-Y Growth Projections, By Country - 2022 to 2032

Figure 34: North America Market Attractiveness Index, By Country - 2022 to 2032

Figure 35: Latin America Market Value (US$ Million) and Year-on-Year Growth, 2015 to 2032

Figure 36: Latin America Market Absolute $ Opportunity Historical (2015 to 2021) and Forecast Period (2022 to 2032), US$ Million

Figure 37: Latin America Market Share, By Offering, 2022 & 2032

Figure 38: Latin America Market Y-o-Y Growth Projections, By Offering - 2022 to 2032

Figure 39: Latin America Market Attractiveness Index, By Offering - 2022 to 2032

Figure 40: Latin America Market Share, By Organization Size, 2022 & 2032

Figure 41: Latin America Market Y-o-Y Growth Projections, By Organization Size - 2022 to 2032

Figure 42: Latin America Market Attractiveness Index, By Organization Size - 2022 to 2032

Figure 43: Latin America Market Share, By Platform, 2022 & 2032

Figure 44: Latin America Market Y-o-Y Growth Projections, By Platform - 2022 to 2032

Figure 45: Latin America Market Attractiveness Index, By Platform - 2022 to 2032

Figure 46: Latin America Market Share, By End-User, 2022 & 2032

Figure 47: Latin America Market Y-o-Y Growth Projections, By End-User - 2022 to 2032

Figure 48: Latin America Market Attractiveness Index, By End-User - 2022 to 2032

Figure 49: Latin America Market Share, By Country, 2022 & 2032

Figure 50: Latin America Market Y-o-Y Growth Projections, By Country - 2022 to 2032

Figure 51: Latin America Market Attractiveness Index, By Country - 2022 to 2032

Figure 52: Europe Market Value (US$ Million) and Year-on-Year Growth, 2015 to 2032

Figure 53: Europe Market Absolute $ Opportunity Historical (2015 to 2021) and Forecast Period (2022 to 2032), US$ Million

Figure 54: Europe Market Share, By Offering, 2022 & 2032

Figure 55: Europe Market Y-o-Y Growth Projections, By Offering - 2022 to 2032

Figure 56: Europe Market Attractiveness Index, By Offering - 2022 to 2032

Figure 57: Europe Market Share, By Organization Size, 2022 & 2032

Figure 58: Europe Market Y-o-Y Growth Projections, By Organization Size - 2022 to 2032

Figure 59: Europe Market Attractiveness Index, By Organization Size - 2022 to 2032

Figure 60: Europe Market Share, By Platform, 2022 & 2032

Figure 61: Europe Market Y-o-Y Growth Projections, By Platform - 2022 to 2032

Figure 62: Europe Market Attractiveness Index, By Platform - 2022 to 2032

Figure 63: Europe Market Share, By End-User, 2022 & 2032

Figure 64: Europe Market Y-o-Y Growth Projections, By End-User - 2022 to 2032

Figure 65: Europe Market Attractiveness Index, By End-User - 2022 to 2032

Figure 66: Europe Market Share, By Country, 2022 & 2032

Figure 67: Europe Market Y-o-Y Growth Projections, By Country - 2022 to 2032

Figure 68: Europe Market Attractiveness Index, By Country - 2022 to 2032

Figure 69: MEA Market Value (US$ Million) and Year-on-Year Growth, 2015 to 2032

Figure 70: MEA Market Absolute $ Opportunity Historical (2015 to 2021) and Forecast Period (2022 to 2032), US$ Million

Figure 71: MEA Market Share, By Offering, 2022 & 2032

Figure 72: MEA Market Y-o-Y Growth Projections, By Offering - 2022 to 2032

Figure 73: MEA Market Attractiveness Index, By Offering - 2022 to 2032

Figure 74: MEA Market Share, By Organization Size, 2022 & 2032

Figure 75: MEA Market Y-o-Y Growth Projections, By Organization Size - 2022 to 2032

Figure 76: MEA Market Attractiveness Index, By Organization Size - 2022 to 2032

Figure 77: MEA Market Share, By Platform, 2022 & 2032

Figure 78: MEA Market Y-o-Y Growth Projections, By Platform - 2022 to 2032

Figure 79: MEA Market Attractiveness Index, By Platform - 2022 to 2032

Figure 80: MEA Market Share, By End-User, 2022 & 2032

Figure 81: MEA Market Y-o-Y Growth Projections, By End-User - 2022 to 2032

Figure 82: MEA Market Attractiveness Index, By End-User - 2022 to 2032

Figure 83: MEA Market Share, By Country, 2022 & 2032

Figure 84: MEA Market Y-o-Y Growth Projections, By Country - 2022 to 2032

Figure 85: MEA Market Attractiveness Index, By Country - 2022 to 2032

Figure 86: Asia Pacific Market Value (US$ Million) and Year-on-Year Growth, 2015 to 2032

Figure 87: Asia Pacific Market Absolute $ Opportunity Historical (2015 to 2021) and Forecast Period (2022 to 2032), US$ Million

Figure 88: Asia Pacific Market Share, By Offering, 2022 & 2032

Figure 89: Asia Pacific Market Y-o-Y Growth Projections, By Offering - 2022 to 2032

Figure 90: Asia Pacific Market Attractiveness Index, By Offering - 2022 to 2032

Figure 91: Asia Pacific Market Share, By Organization Size, 2022 & 2032

Figure 92: Asia Pacific Market Y-o-Y Growth Projections, By Organization Size - 2022 to 2032

Figure 93: Asia Pacific Market Attractiveness Index, By Organization Size - 2022 to 2032

Figure 94: Asia Pacific Market Share, By Platform, 2022 & 2032

Figure 95: Asia Pacific Market Y-o-Y Growth Projections, By Platform - 2022 to 2032

Figure 96: Asia Pacific Market Attractiveness Index, By Platform - 2022 to 2032

Figure 97: Asia Pacific Market Share, By End-User, 2022 & 2032

Figure 98: Asia Pacific Market Y-o-Y Growth Projections, By End-User - 2022 to 2032

Figure 99: Asia Pacific Market Attractiveness Index, By End-User - 2022 to 2032

Figure 100: Asia Pacific Market Share, By Country, 2022 & 2032

Figure 101: Asia Pacific Market Y-o-Y Growth Projections, By Country - 2022 to 2032

Figure 102: Asia Pacific Market Attractiveness Index, By Country - 2022 to 2032

Recommendations

Technology

Video Streaming Software Market

Published : April 2024

Technology

Metrology Software Market

Published : June 2023

Technology

MEA Enterprise Software Market

Published : September 2022

Technology

Russian IT Software and Services Market

Published : December 2014

Explore Technology Insights

View Reports

Customer Journey Mapping Software Market