Reports

- Global Locations -

Headquarters

Future Market Insights, Inc.

Christiana Corporate, 200
Continental Drive, Suite 401,
Newark, Delaware - 19713,
United States

T: +1-845-579-5705

Americas

Future Market Insights, Inc.

616 Corporate Way, Suite 2-9018,
Valley Cottage, NY 10989, United States

T: +1-347-918-3531

MEA

Future Market Insights

1602-6 Jumeirah Bay X2 Tower, Plot No: JLT-PH2-X2A,
Jumeirah Lakes Towers, Dubai,
United Arab Emirates

Europe

Future Market Insights

3rd Floor, 207 Regent Street,
W1B 3HH London
United Kingdom

T: + 44 (0) 20 8123 9659
D: +44 (0) 20 3287 4268

Asia Pacific

Future Market Insights

IndiaLand Global Tech Park, Unit UG-1, Behind Grand HighStreet, Phase 1, Hinjawadi, MH, Pune – 411057, India

Customer Journey Analytics Software Market Overview (2022 to 2032)

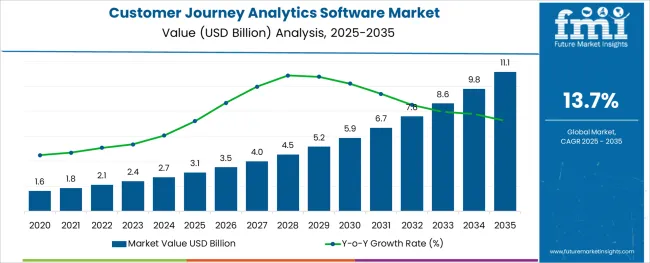
[300 Pages Report] The customer journey analytics software market size was valued at US$ 1.8 Billion in 2021 and is projected to grow at a compound annual growth rate of 13.7% reaching US$ 7.4 Billion by 2032, up from US$ 2.1 Billion in 2022. From 2021 to 2022, the market is anticipated to register a Y-o-Y growth of 16.6%.

In the future, enterprise strategy, digitization, increasing investments, and focusing on data and analytics will become the core elements that define the enterprise strategy.

Attributes Details
Customer Journey Analytics Software Market CAGR (2022 to 2032) 13.7%
Customer Journey Analytics Software Market Size (2022) US$ 2.1 Billion
Customer Journey Analytics Software Market Size (2032) US$ 7.4 Billion

A growing array of predictive analytics is making it easier to design great customer experiences in industries. As technology progresses and real-time data is readily available, an increase in analytical trends for consumers is observed. In order to make good marketing decisions, the analysis focuses primarily on the market's operations.

With the increased use of customer behavior data analysis, consumer journey analysis is also becoming more in demand in the market.

The pandemic accelerated the growth of the customer journey analytics market as more businesses realized the importance of customer-focused marketing in order to maximize marketing ROI and minimize marketing investments. The current trend is mainly attributed to the increasing number of digital efforts of businesses. These efforts increasingly involve mapping customer journeys and developing digital approaches to servicing customers.

Don't pay for what you don't need

Customize your report by selecting specific countries or regions and save 30%!

What Are The Key Factors Contributing To The Growth Of Customer Journey Analytics Software Market?

Advancements in Digitization are expected to drive Market Growth

Data generated by centralized systems have been growing in volume as digitalization progresses. In recent years, the need for real-time data analysis, particularly in regard to e-commerce, has significantly increased. It's imperative that retailers and online merchants are accustomed to monitoring customer journey analytics solutions, as these can be used to monitor the overall customer experience across different channels and help retailers satisfy their customers.

By possessing a metric for measuring customer satisfaction, marketers and business owners are able to make better decisions to grow businesses in the market.

Consistent customer support across the entire customer journey is becoming increasingly crucial for business success. In recent years, businesses have been focusing heavily on creating analytics technologies in order to gain a high-level consumer base. Through traffic analytics and e-commerce analytics, customer journey analytics can be of assistance to these specific industries.

In order to make strategic decisions in an organization, information needs to be converted into digital form, which is expected to further drive the growth of the customer journey analytics market.

Modern techniques and analysis methods that can assist organizations in almost every sector to build stronger relationships with their customers are curtailed by the latest investments and strategies.

Retail and e-commerce businesses are increasingly turning to customer journey analytics solutions in order to stay up to date with the rapidly evolving expectations of customers through multiple channels, in real-time, and to guide them through the entire journey in order to meet their needs as they change.

Customer Journey Analytics Software Market

Personalized Omni channel experiences are of high value to consumers today, but they also demand them in the retail market. Thus, there is a growing trend among retailers to leverage technologies to gain a deeper understanding of consumers' preferences through the use of customer analytics technologies.

Customer analytics has become increasingly important in retail as sales grow. This helps companies develop more personal communication and marketing strategies. Customer loyalty and experience are also enhanced by determining which buyers purchase which products and tailoring marketing to the specific preferences of those buyers.

What Are The Key Challenges Affecting Growth In The Customer Journey Analytics Market?

A number is an important tool in evaluating and managing the efforts of every organization. The existence of complex technology and tools is also expected to hamper the growth of the IoT market in elevators. Customer experience leaders face the most difficult challenge of quantifying the return on investment that is generated by customer experience, but, for brands, it is most crucial to justify the financial results that are generated.

Businesses of all types struggle to link customer behavior to business-critical metrics, including revenue, retention, and customer service costs. A lack of tools and technologies is expected to slow the growth of the market in the near future. A budget for CX is difficult to secure when it is not possible to measure the impact on business outcomes. As a result budgets for CX initiatives in organizations struggling to quantify ROI have stagnated or decreased.

According to experts, security threats will be on the rise in the upcoming years. Security breaches and data loss have increased due to inefficiency in managing massive amounts of data and volumes of data in the market. This will likely hinder the growth of customer journey analytics software in the market.

In addition, a significant increase in data sources has caused several IT departments to have difficulty managing the data. An extensive number of graphical and text-based database files requires a significant amount of time, money, and human resources to analyze.

As a result, customer journey analytics creates issues that affect the optimum return on investment in such analytics. All these factors are likely to hinder the growth of customer journey analytics software in the market.

Sudip Saha
Sudip Saha

Principal Consultant

Talk to Analyst

Find your sweet spots for generating winning opportunities in this market.

Comparative View Of Customer Journey Analytics Software Market

Customer Journey Analytics Software Market:

Attributes Customer Journey Analytics Software Market
CAGR (2022 to 2032) 13.7%
Market Value (2032) US$ 7.4 Billion
Growth Factor A significant amount of retail sales in the market in addition to growing digitization has driven growth for customer journey analytics software.
Opportunity For the customer journey analytics market, the rise of augmented reality and virtual reality (VR) is expected to create significant opportunities for the various sectors of the market.
Key Trends As customers increasingly demand seamless experiences, the market is expected to grow in the near future.

Customer Journey Mapping Software Market:

Attributes Customer Journey Mapping Software Market
CAGR (2022 to 2032) 16.3%
Market Value (2032) US$ 48.5 Billion
Growth Factor Globally, SMEs are embracing cloud-based products and services, which is projected to fuel market growth.
Opportunity New players are entering the market with innovative solutions to improve data quality and security. This is also driving competition among established players.
Key Trends As more companies are increasingly focusing on the customer experience, the demand for customer journey mapping is also increasing.

Customer-to-Customer Community Marketing Software Market:

Attributes Customer-to-Customer Community Marketing Software Market
CAGR (2022 to 2032) 6.2%
Market Value (2032) US$ 2.8 Billion
Growth Factor Customers can become loyal to brands by building online communities, encouraging them to remain loyal, and increasing their goodwill of the brand, which is a major driving force behind the customer-to-customer (C2C) community marketing software market.
Opportunity Customers-to-customers (C2C) solutions help businesses map customer behaviors, an aspect of community marketing that drives C2C adoption.
Key Trends As part of C2C solutions, companies can build communities, distribute brand awareness, onboard new members, promote events, and analyze data in future markets.

It is evident that the business analytics market has grown, as many businesses are moving from on-premises to cloud-based services, in order to improve their business growth. Customer analytics is becoming more and more popular among insurance companies, financial institutions, and pension plans, as they employ these techniques in order to increase cross-selling, understand the lifetime value of their customers, etc.

Telecommunications is primarily concerned with reducing retention, whereas verticals such as e-commerce and retail are focused on customer buying behaviors in the market.

Analytics of customer experience provides brands with valuable consumer insights that can be used to generate data-driven, strategic decisions, which could improve the customer experience. As an added benefit, the customer data gathered will help companies create effective marketing campaigns, and market strategies, better understand competitors, and formulate new products that will succeed.

A sense of business can be created in the market by incorporating social media data sources to gain customer feedback on products sold and purchased. The feedback provided by customers helps businesses to adjust their strategies and upgrade their products if they encounter problems on the market.

Customer experience management is becoming more digitized and embedded with AI and machine learning in order to gather data about customer touchpoints, identify trends, and make changes with little or no human interference, allowing companies to grow their market to be more flexible and competitive. According to the survey, 50 percent of respondents planned to increase overall budgets to improve their online experience, during the pandemic.

In addition, businesses are increasingly leveraging the cloud for tools and platforms, and it's become increasingly popular over the last few years due to its ease of use, cost-effectiveness, flexibility, and ease of deployment.

Category Wise Analysis

Which enterprise type will dominate the Customer Journey Analytics Software Industry?

The market for large enterprises is expected to grow at a significant rate over the forecast period

Customer journey analytics applications will likely increase in demand in the market as enterprise adoption of the software continues to rise. The use of customer journey analytics software can provide many benefits to large enterprises that can be reaped.

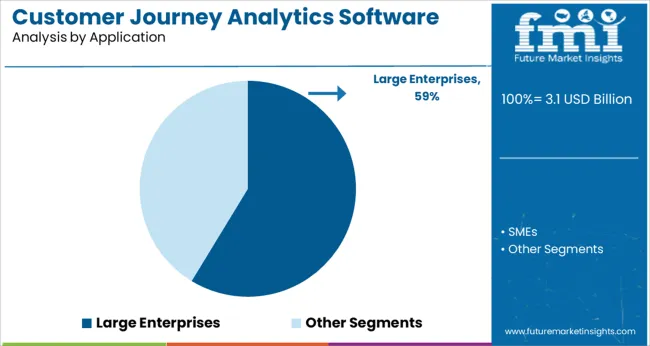
The adoption rate of cloud computing among large enterprises is projected to increase at a tremendous rate, with a CAGR of 13.1%. In order to provide their clients with a better customer experience, large companies analyze the customer's journey in order to optimize their marketing and sales efforts. As a result, this data can also be used for improving their product offerings and business strategies.

Customer journey analytics software can provide enterprises with a wide range of benefits, including enhanced customer service, revenue growth, enhanced knowledge of the customers, improved marketing and sales efforts, enhanced product offerings, and increased sales in the market. Further, organizations spend a great deal of money on technological advancements in order to secure a larger share of the market in a highly competitive market.

Businesses are using predictive analytics to make accurate predictions about consumer buying preferences through the use of business intelligence solutions in the market. As part of the predictive analysis, different models are used to improve satisfaction with existing customers, prevent customer loss, and strengthen customer relationships.

Which Offering is expected to show the highest CAGR?

Cloud-based Customer Journey Analytics Software Expected to Reign Supreme

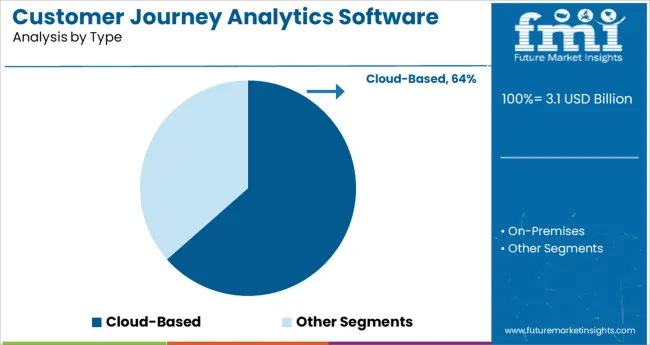
The customer journey analytics market has been segmented into two categories based on top types on-premises and cloud-based. According to the forecast, the cloud segment is expected to grow at a rapid pace during this period. The availability of easy deployment options and minimal capital and time requirements can be attributed to the high CAGR of 13.6% in the cloud segment.

The acceleration of social distancing, online shopping, and the lockdown of COVID-19 have all contributed to the lockdown scenario, and are anticipated to drive the adoption of cloud-based customer journey analytics solutions.

Using a cloud-based customer journey analytics solution helps businesses improve their customer journey analytics by tracking, understanding, and optimizing their customers' journeys. Customer retention and loyalty can be improved as well as customer churn is reduced using these technologies.

SMEs with limited resources and time can use cloud-based customer journey analytics software since it is accessible to all businesses. Companies across the globe introduced work-from-home policies for their employees during covid-19, thus creating a market opportunity for companies to use cloud-based analytics solutions to manage critical information in the market.
Get the data you need at a Fraction of the cost

Personalize your report by choosing insights you need
and save 40%!

Region-Wise Analysis

How Opportunistic is the Market for Customer Journey Analytics Software across North America?

Availability of new technology and expansion of business to broaden the scope of the North American market

As a result of the rapid adoption of new technologies and the presence of significant market players in this region, the market for customer journey analytics software market is likely to dominate in the near future. Increasingly, enterprises in this region see data collection, usage, and analysis as an opportunity to improve the customer experience in the market.

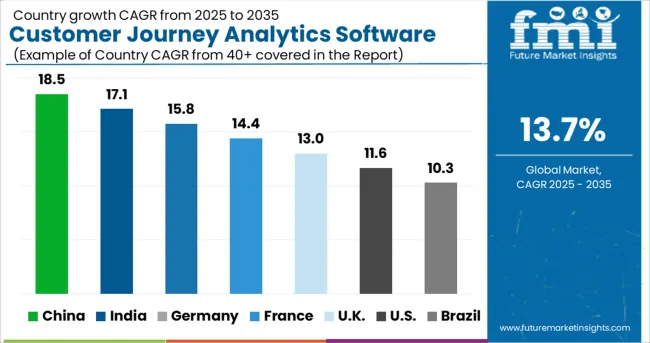
The USA is expected to generate a CAGR of 13.4% for customer journey analytics software during the forecast period. The majority of American companies will also continue to spend more money on marketing, yielding a moderate growth rate compared to the rest of the world.

As the growth of online applications has been spreading rapidly throughout the country, the USA has been identified as the region's biggest market for customer journey analytics. As a result of changing infrastructures and technological advancement in these regions, growth in customer journey analytics software is expected to continue to accelerate in the market.

Asia-Pacific to Become Attractive Customer Journey Analytics Software Market?

China's Customer Journey Analytics Software Market is anticipated to grow impressively

As a result of the trend toward adopting customer journey analytics software, the Asia Pacific region is predicted to grow at the highest CAGR during the forecast period. As customer experience becomes more important in key countries like China, India, Japan, and Korea, more solutions and services focusing on customer journey analytics are expected to emerge in the coming years.

The commercialization of AI and machine learning techniques, which have a tendency to lead to a vast amount of data pertaining to customers, and the requirement to further advance this technology in order to realize its full potential is expected to increase the use of customer journey analytics software in the region.

It is expected that the Chinese market will represent the highest CAGR of 15.7% in the customer journey analytics software market for the forecast period.

Over the forecast period, Japan is projected to achieve a CAGR of 12.1% in 2032. South Korea's market is expected to grow by 11.2% CAGR over the next few years due to the increasing demand for cloud storage systems and the growth of SMEs in the region.

An increase in the number of industries adopting analytics software as well as an enormous rate of smartphone penetration is among other reasons for the growth of the customer journey analytics software market.

What is the future growth potential of the European customer journey analytics market?

UK to emerge as the third largest country in the customer journey analytics software market

Due to the acceptance of emerging technologies, Europe ranks third in the customer journey analytics market. The customer journey analytics software market in the United Kingdom is projected to register a 12.6% CAGR during the forecast period.

The growth of e-commerce and retail sales in these regions will further drive customer journey analytics market growth. It is expected that the market will experience increased demand for digitization across different verticals in this region to continue to motivate their growth.
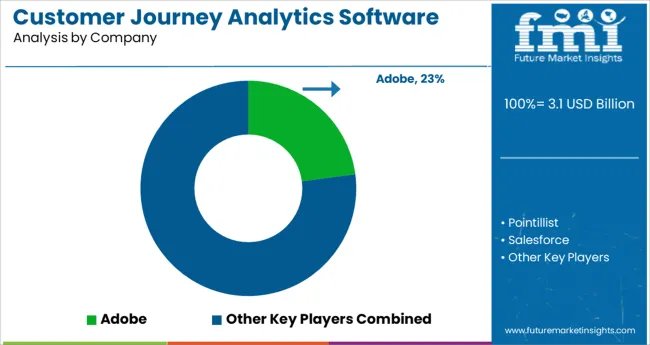
Who Are The Key Competitors In The Customer Journey Analytics Software Market?

Adobe, Pointillist, Salesforce, Flockrush, Indicatie, Verint, CloudCherry, Cooladata, UXPressia, Alterian, and Auryc, among others are the top companies in the global customer journey analytics software market.

The main firms, which hold a substantial share of the customer journey analytics market, are concentrating on growing their customer base in new countries. To increase their profits and market share, these businesses rely on strategic collaboration initiatives.

As a result of technological advancements and product innovations, smaller and mid-sized businesses are expanding their market presence and entering new markets.

  • In July 2021, CSG announced the acquisition of Kitewheel, an orchestration and analytics platform for customer journeys. By combining the two industry leaders, CSG gains access to a new market growth opportunity of $10 billion worldwide that will further extend its position in customer experience management. In addition, Kitewheel's journey orchestration technology and CSG's digital customer engagement technologies produce powerful, cloud-based engagement platforms that orchestrate real-time, contextually relevant customer experiences for leading brands.
  • In September 2021, Totango, the provider of tools to help SaaS companies find and fix customer flow problems, announced the raising of $100 million in Series D funding, led by Great Hill Partners. Based on its investment strategy, the firm identifies a sub-segment, such as a customer success, and evaluates businesses within that segment.
  • In December 2021, MoEngage, a customer engagement platform raised $30 million led by Steadview Capital. The existing investors Eight Roads Ventures, Multiples Alternate Asset Management, Matrix Partners, and F-Prime Capital also participated in the round. The company had raised $100 million in total. The money will be used for strengthening its technology and further accelerating growth.
  • In March 2022, Adobe announced a new feature for Customer Journey Analytics, its platform-agnostic customer tracking solution under Adobe's Experience Cloud. As a new experimentation feature in Journey Analytics, Adobe introduced a new way for businesses to test real-world scenarios and analyze their results to better understand how even small changes can affect the overall customer journey across their various properties. The Adobe Customer Data Platform [CDP] and Customer Journey Analytics have also been integrated for Adobe's ability to discover customer segments.

By Key Players

  • Adobe
  • Pointillist
  • Salesforce
  • Flockrush
  • Indicatie
  • Verint
  • CloudCherry
  • Cooladata
  • UXPressia
  • Alterian
  • Auryc

Key Segments Covered In The Customer Journey Analytics Software Market Study

By Type:

  • Cloud-Based
  • On-Premises

By Application:

  • Large Enterprises
  • SMEs

By Region:

  • North America
  • Europe
  • Asia Pacific
  • Middle East and Africa
  • Latin America

Frequently Asked Questions

What is the growth outlook for the customer journey analytics software market?

The customer journey analytics software market is expected to grow at a steady CAGR of 13.7% over the forecast period.

What was the size of the customer journey analytics software market size in 2021?

The global market for customer journey analytics software was valued at US$ 1.8 Billion in 2021

Which application type has the highest market value in the customer journey analytics software market?

Large Enterprises are projected to have the highest market with a CAGR of 13.1% during the forecast period.

What region dominates the global customer journey analytics software market?

USA leads the global customer journey analytics software market with a CAGR of 13.4% during the forecast period.

What will be the market size of customer journey analytics software by 2032?

The market for customer journey analytics software is expected to grow by nearly US$ 7.4 Billion by 2032.

Which type is forecast to drive market growth during the forecast period?

The cloud-based are expected to reach a CAGR of 13.6% during the forecast period.

What is the estimated market value of the China Market?

The China market is expected to garner US$ 527.3 Million while expanding at a 13.1% CAGR from 2022 to 2032.

Table of Content

1. Executive Summary | Customer Journey Analytics Software Market

    1.1. Global Market Outlook

    1.2. Summary of Statistics

    1.3. Key Market Characteristics & Attributes

    1.4. FMI Analysis and Recommendations

2. Market Overview

    2.1. Market Coverage / Taxonomy

    2.2. Market Definition / Scope / Limitations

3. Market Risks and Trends Assessment 

    3.1. Risk Assessment

        3.1.1. COVID-19 Crisis and Impact on Demand

        3.1.2. COVID-19 Impact Benchmark with Previous Crisis

        3.1.3. Impact on Market Value (US$ Million)

        3.1.4. Assessment by Key Countries

        3.1.5. Assessment by Key Market Segments

        3.1.6. Action Points and Recommendation for Suppliers

    3.2. Key Trends Impacting the Market

    3.3. Formulation and Product Development Trends

4. Market Background and Foundation Data Points 

    4.1. Global Market (US$ Million)

    4.2. Market Opportunity Assessment (US$ Million)

        4.2.1. Total Available Market

        4.2.2. Serviceable Addressable Market

        4.2.3. Serviceable Obtainable Market

    4.3. Market Scenario Forecast

        4.3.1. Demand in Optimistic Scenario

        4.3.2. Demand in Likely Scenario

        4.3.3. Demand in Conservative Scenario

    4.4. Investment Feasibility Analysis

        4.4.1. Investment in Established Markets

            4.4.1.1. In Short Term

            4.4.1.2. In Long Term

        4.4.2. Investment in Emerging Markets

            4.4.2.1. In Short Term

            4.4.2.2. In Long Term

    4.5. Forecast Factors - Relevance & Impact

        4.5.1. Top Companies Historical Growth

        4.5.2. Global Market Growth

        4.5.3. Adoption Rate, By Country

    4.6. Market Dynamics

        4.6.1. Market Driving Factors and Impact Assessment

        4.6.2. Prominent Market Challenges and Impact Assessment

        4.6.3. Market Opportunities

        4.6.4. Prominent Trends in the Global Market & Their Impact Assessment

5. Key Success Factors 

    5.1. Manufacturers’ Focus on Low Penetration High Growth Markets

    5.2. Banking on with Segments High Incremental Opportunity

    5.3. Peer Benchmarking

6. Global Market Demand Analysis 2015 to 2021 and Forecast, 2022 to 2032

    6.1. Historical Market Analysis, 2015 to 2021

    6.2. Current and Future Market Projections, 2022 to 2032

    6.3. Y-o-Y Growth Trend Analysis

7. Global Market Value Analysis 2015 to 2021 and Forecast, 2022 to 2032

    7.1. Historical Market Value (US$ Million) Analysis, 2015 to 2021

    7.2. Current and Future Market Value (US$ Million) Projections, 2022 to 2032

        7.2.1. Y-o-Y Growth Trend Analysis

        7.2.2. Absolute $ Opportunity Analysis

8. Global Market Analysis 2015 to 2021 and Forecast 2022 to 2032, By Type

    8.1. Introduction / Key Findings

    8.2. Historical Market Size (US$ Million) Analysis By Type, 2015 to 2021

    8.3. Current and Future Market Size (US$ Million) Analysis and Forecast By Type, 2022 to 2032

        8.3.1. Cloud Based

        8.3.2. On-Premises

    8.4. Market Attractiveness Analysis By Type

9. Global Market Analysis 2015 to 2021 and Forecast 2022 to 2032, By Application

    9.1. Introduction / Key Findings

    9.2. Historical Market Size (US$ Million) Analysis By Application, 2015 to 2021

    9.3. Current and Future Market Size (US$ Million) Analysis and Forecast By Application, 2022 to 2032

        9.3.1. Large Enterprises

        9.3.2. SMEs

    9.4. Market Attractiveness Analysis By Application

10. Global Market Analysis 2015 to 2021 and Forecast 2022 to 2032, By Region

    10.1. Introduction

    10.2. Historical Market Size (US$ Million) Analysis By Region, 2015 to 2021

    10.3. Current Market Size (US$ Million) & Analysis and Forecast By Region, 2022 to 2032

        10.3.1. North America

        10.3.2. Latin America

        10.3.3. Europe

        10.3.4. Asia Pacific

        10.3.5. Middle East and Africa (MEA)

    10.4. Market Attractiveness Analysis By Region

11. North America Market Analysis 2015 to 2021 and Forecast 2022 to 2032

    11.1. Introduction

    11.2. Pricing Analysis

    11.3. Historical Market Value (US$ Million) Trend Analysis By Market Taxonomy, 2015 to 2021

    11.4. Market Value (US$ Million) & Forecast By Market Taxonomy, 2022 to 2032

        11.4.1. By Country

            11.4.1.1. United States of America

            11.4.1.2. Canada

            11.4.1.3. Rest of North America

        11.4.2. By Type

        11.4.3. By Application

    11.5. Market Attractiveness Analysis

        11.5.1. By Country

        11.5.2. By Type

        11.5.3. By Application

12. Latin America Market Analysis 2015 to 2021 and Forecast 2022 to 2032

    12.1. Introduction

    12.2. Pricing Analysis

    12.3. Historical Market Value (US$ Million) Trend Analysis By Market Taxonomy, 2015 to 2021

    12.4. Market Value (US$ Million) & Forecast By Market Taxonomy, 2022 to 2032

        12.4.1. By Country

            12.4.1.1. Brazil

            12.4.1.2. Mexico

            12.4.1.3. Rest of Latin America

        12.4.2. By Type

        12.4.3. By Application

    12.5. Market Attractiveness Analysis

        12.5.1. By Country

        12.5.2. By Type

        12.5.3. By Application

13. Europe Market Analysis 2015 to 2021 and Forecast 2022 to 2032

    13.1. Introduction

    13.2. Pricing Analysis

    13.3. Historical Market Value (US$ Million) Trend Analysis By Market Taxonomy, 2015 to 2021

    13.4. Market Value (US$ Million) & Forecast By Market Taxonomy, 2022 to 2032

        13.4.1. By Country

            13.4.1.1. Germany

            13.4.1.2. France

            13.4.1.3. United Kingdom

            13.4.1.4. Italy

            13.4.1.5. Benelux

            13.4.1.6. Nordic Countries

            13.4.1.7. Rest of Europe

        13.4.2. By Type

        13.4.3. By Application

    13.5. Market Attractiveness Analysis

        13.5.1. By Country

        13.5.2. By Type

        13.5.3. By Application

14. Asia Pacific Market Analysis 2015 to 2021 and Forecast 2022 to 2032

    14.1. Introduction

    14.2. Pricing Analysis

    14.3. Historical Market Value (US$ Million) Trend Analysis By Market Taxonomy, 2015 to 2021

    14.4. Market Value (US$ Million) & Forecast By Market Taxonomy, 2022 to 2032

        14.4.1. By Country

            14.4.1.1. China

            14.4.1.2. Japan

            14.4.1.3. South Korea

            14.4.1.4. Rest of Asia Pacific

        14.4.2. By Type

        14.4.3. By Application

    14.5. Market Attractiveness Analysis

        14.5.1. By Country

        14.5.2. By Type

        14.5.3. By Application

15. Middle East and Africa Market Analysis 2015 to 2021 and Forecast 2022 to 2032

    15.1. Introduction

    15.2. Pricing Analysis

    15.3. Historical Market Value (US$ Million) Trend Analysis By Market Taxonomy, 2015 to 2021

    15.4. Market Value (US$ Million) & Forecast By Market Taxonomy, 2022 to 2032

        15.4.1. By Country

            15.4.1.1. GCC Countries

            15.4.1.2. South Africa

            15.4.1.3. Turkey

            15.4.1.4. Rest of Middle East and Africa

        15.4.2. By Type

        15.4.3. By Application

    15.5. Market Attractiveness Analysis

        15.5.1. By Country

        15.5.2. By Type

        15.5.3. By Application

16. Key Countries Market Analysis 2015 to 2021 and Forecast 2022 to 2032

    16.1. Introduction

        16.1.1. Market Value Proportion Analysis, By Key Countries

        16.1.2. Global Vs. Country Growth Comparison

    16.2. US Market Analysis

        16.2.1. Value Proportion Analysis by Market Taxonomy

        16.2.2. Value & Analysis and Forecast by Market Taxonomy, 2015 to 2032

            16.2.2.1. By Type

            16.2.2.2. By Application

    16.3. Canada Market Analysis

        16.3.1. Value Proportion Analysis by Market Taxonomy

        16.3.2. Value & Analysis and Forecast by Market Taxonomy, 2015 to 2032

            16.3.2.1. By Type

            16.3.2.2. By Application

    16.4. Mexico Market Analysis

        16.4.1. Value Proportion Analysis by Market Taxonomy

        16.4.2. Value & Analysis and Forecast by Market Taxonomy, 2015 to 2032

            16.4.2.1. By Type

            16.4.2.2. By Application

    16.5. Brazil Market Analysis

        16.5.1. Value Proportion Analysis by Market Taxonomy

        16.5.2. Value & Analysis and Forecast by Market Taxonomy, 2015 to 2032

            16.5.2.1. By Type

            16.5.2.2. By Application

    16.6. Germany Market Analysis

        16.6.1. Value Proportion Analysis by Market Taxonomy

        16.6.2. Value & Analysis and Forecast by Market Taxonomy, 2015 to 2032

            16.6.2.1. By Type

            16.6.2.2. By Application

    16.7. France Market Analysis

        16.7.1. Value Proportion Analysis by Market Taxonomy

        16.7.2. Value & Analysis and Forecast by Market Taxonomy, 2015 to 2032

            16.7.2.1. By Type

            16.7.2.2. By Application

    16.8. Italy Market Analysis

        16.8.1. Value Proportion Analysis by Market Taxonomy

        16.8.2. Value & Analysis and Forecast by Market Taxonomy, 2015 to 2032

            16.8.2.1. By Type

            16.8.2.2. By Application

    16.9. BENELUX Market Analysis

        16.9.1. Value Proportion Analysis by Market Taxonomy

        16.9.2. Value & Analysis and Forecast by Market Taxonomy, 2015 to 2032

            16.9.2.1. By Type

            16.9.2.2. By Application

    16.10. UK Market Analysis

        16.10.1. Value Proportion Analysis by Market Taxonomy

        16.10.2. Value & Analysis and Forecast by Market Taxonomy, 2015 to 2032

            16.10.2.1. By Type

            16.10.2.2. By Application

    16.11. Nordic Countries Market Analysis

        16.11.1. Value Proportion Analysis by Market Taxonomy

        16.11.2. Value & Analysis and Forecast by Market Taxonomy, 2015 to 2032

            16.11.2.1. By Type

            16.11.2.2. By Application

    16.12. China Market Analysis

        16.12.1. Value Proportion Analysis by Market Taxonomy

        16.12.2. Value & Analysis and Forecast by Market Taxonomy, 2015 to 2032

            16.12.2.1. By Type

            16.12.2.2. By Application

    16.13. Japan Market Analysis

        16.13.1. Value Proportion Analysis by Market Taxonomy

        16.13.2. Value & Analysis and Forecast by Market Taxonomy, 2015 to 2032

            16.13.2.1. By Type

            16.13.2.2. By Application

    16.14. South Korea Market Analysis

        16.14.1. Value Proportion Analysis by Market Taxonomy

        16.14.2. Value & Analysis and Forecast by Market Taxonomy, 2015 to 2032

            16.14.2.1. By Type

            16.14.2.2. By Application

    16.15. GCC Countries Market Analysis

        16.15.1. Value Proportion Analysis by Market Taxonomy

        16.15.2. Value & Analysis and Forecast by Market Taxonomy, 2015 to 2032

            16.15.2.1. By Type

            16.15.2.2. By Application

    16.16. South Africa Market Analysis

        16.16.1. Value Proportion Analysis by Market Taxonomy

        16.16.2. Value & Analysis and Forecast by Market Taxonomy, 2015 to 2032

            16.16.2.1. By Type

            16.16.2.2. By Application

    16.17. Turkey Market Analysis

        16.17.1. Value Proportion Analysis by Market Taxonomy

        16.17.2. Value & Analysis and Forecast by Market Taxonomy, 2015 to 2032

            16.17.2.1. By Type

            16.17.2.2. By Application

        16.17.3. Competition Landscape and Player Concentration in the Country

17. Market Structure Analysis

    17.1. Market Analysis by Tier of Companies

    17.2. Market Concentration

    17.3. Market Share Analysis of Top Players

    17.4. Market Presence Analysis

        17.4.1. By Regional Footprint of Players

        17.4.2. Product Footprint by Players

18. Competition Analysis

    18.1. Competition Dashboard

    18.2. Competition Benchmarking

    18.3. Competition Deep Dive

        18.3.1. Adobe

            18.3.1.1. Overview

            18.3.1.2. Product Portfolio

            18.3.1.3. Sales Footprint

            18.3.1.4. Strategy Overview

        18.3.2. Pointillist

            18.3.2.1. Overview

            18.3.2.2. Product Portfolio

            18.3.2.3. Sales Footprint

            18.3.2.4. Strategy Overview

        18.3.3. Salesforce

            18.3.3.1. Overview

            18.3.3.2. Product Portfolio

            18.3.3.3. Sales Footprint

            18.3.3.4. Strategy Overview

        18.3.4. Flockrush

            18.3.4.1. Overview

            18.3.4.2. Product Portfolio

            18.3.4.3. Sales Footprint

            18.3.4.4. Strategy Overview

        18.3.5. Indicative

            18.3.5.1. Overview

            18.3.5.2. Product Portfolio

            18.3.5.3. Sales Footprint

            18.3.5.4. Strategy Overview

        18.3.6. Verint

            18.3.6.1. Overview

            18.3.6.2. Product Portfolio

            18.3.6.3. Sales Footprint

            18.3.6.4. Strategy Overview

        18.3.7. CloudCherry

            18.3.7.1. Overview

            18.3.7.2. Product Portfolio

            18.3.7.3. Sales Footprint

            18.3.7.4. Strategy Overview

        18.3.8. Cooladata

            18.3.8.1. Overview

            18.3.8.2. Product Portfolio

            18.3.8.3. Sales Footprint

            18.3.8.4. Strategy Overview

        18.3.9. UXPressia

            18.3.9.1. Overview

            18.3.9.2. Product Portfolio

            18.3.9.3. Sales Footprint

            18.3.9.4. Strategy Overview

        18.3.10. Alterian

            18.3.10.1. Overview

            18.3.10.2. Product Portfolio

            18.3.10.3. Sales Footprint

            18.3.10.4. Strategy Overview

        18.3.11. Auryc

            18.3.11.1. Overview

            18.3.11.2. Product Portfolio

            18.3.11.3. Sales Footprint

            18.3.11.4. Strategy Overview

19. Assumptions and Acronyms Used

20. Research Methodology

List of Tables

Table 01: Global Market Value (US$ Million), By Type, 2015 to 2021

Table 02: Global Market Value (US$ Million), By Type, 2022 to 2032

Table 03: Global Market Value (US$ Million), By Application, 2015 to 2021

Table 04: Global Market Value (US$ Million), By Application, 2022 to 2032

Table 05: Global Market, By Region, 2015 to 2021

Table 06: Global Market, By Region, 2022 to 2032

Table 07: North America Market Value (US$ Million), By Type, 2015 to 2021

Table 08: North America Market Value (US$ Million), By Type, 2022 to 2032

Table 09: North America Market Value (US$ Million), By Application, 2015 to 2021

Table 10: North America Market Value (US$ Million), By Application, 2022 to 2032

Table 11: North America Market, By Country, 2015 to 2021

Table 12: North America Market, By Country, 2022 to 2032

Table 13: Latin America Market Value (US$ Million), By Type, 2015 to 2021

Table 14: Latin America Market Value (US$ Million), By Type, 2022 to 2032

Table 15: Latin America Market Value (US$ Million), By Application, 2015 to 2021

Table 16: Latin America Market Value (US$ Million), By Application, 2022 to 2032

Table 17: Latin America Market, By Country, 2015 to 2021

Table 18: Latin America Market, By Country, 2022 to 2032

Table 19: Europe Market Value (US$ Million), By Type, 2015 to 2021

Table 20: Europe Market Value (US$ Million), By Type, 2022 to 2032

Table 21: Europe Market Value (US$ Million), By Application, 2015 to 2021

Table 22: Europe Market Value (US$ Million), By Application, 2022 to 2032

Table 23: Europe Market, By Country, 2015 to 2021

Table 24: Europe Market, By Country, 2022 to 2032

Table 25: Asia Pacific Market Value (US$ Million), By Type, 2015 to 2021

Table 26: Asia Pacific Market Value (US$ Million), By Type, 2022 to 2032

Table 27: Asia Pacific Market Value (US$ Million), By Application, 2015 to 2021

Table 28: Asia Pacific Market Value (US$ Million), By Application, 2022 to 2032

Table 29: Asia Pacific Market, By Country, 2015 to 2021

Table 30: Asia Pacific Market, By Country, 2022 to 2032

Table 31: MEA Market Value (US$ Million), By Type, 2015 to 2021

Table 32: MEA Market Value (US$ Million), By Type, 2022 to 2032

Table 33: MEA Market Value (US$ Million), By Application, 2015 to 2021

Table 34: MEA Market Value (US$ Million), By Application, 2022 to 2032

Table 35: MEA Market, By Country, 2015 to 2021

Table 36: MEA Market, By Country, 2022 to 2032

Table 37: Global Market Incremental $ Opportunity, By Type, 2015 to 2021

Table 38: Global Market Incremental $ Opportunity, By Application, 2022 to 2032

Table 39: Global Market Incremental $ Opportunity, By Region, 2022 to 2032

Table 40: North America Market Incremental $ Opportunity, By Type, 2015 to 2021

Table 41: North America Market Incremental $ Opportunity, By Application, 2022 to 2032

Table 42: North America Market Incremental $ Opportunity, By Country, 2022 to 2032

Table 43: Latin America Market Incremental $ Opportunity, By Type, 2015 to 2021

Table 44: Latin America Market Incremental $ Opportunity, By Application, 2022 to 2032

Table 45: Latin America Market Incremental $ Opportunity, By Country, 2022 to 2032

Table 46: Europe Market Incremental $ Opportunity, By Type, 2015 to 2021

Table 47: Europe Market Incremental $ Opportunity, By Application, 2022 to 2032

Table 48: Europe Market Incremental $ Opportunity, By Country, 2022 to 2032

Table 49: Asia Pacific Market Incremental $ Opportunity, By Type, 2015 to 2021

Table 50: Asia Pacific Market Incremental $ Opportunity, By Application, 2022 to 2032

Table 51: Asia Pacific Market Incremental $ Opportunity, By Country, 2022 to 2032

Table 52: MEA Market Incremental $ Opportunity, By Type, 2015 to 2021

Table 53: MEA Market Incremental $ Opportunity, By Application, 2022 to 2032

Table 54: MEA Market Incremental $ Opportunity, By Country, 2022 to 2032

List of Charts

Figure 01: Global Market Value (US$ Million) and Year-on-Year Growth, 2015 to 2032

Figure 02: Global Market Absolute $ Historical Gain (2015 to 2021) and Opportunity (2022 to 2032), US$ Million

Figure 03: Global Market Share, By Type, 2022 & 2032

Figure 04: Global Market Y-o-Y Growth Projections, By Type - 2022 to 2032

Figure 05: Global Market Attractiveness Index, By Type - 2022 to 2032

Figure 06: Global Market Share, By Application, 2022 & 2032

Figure 07: Global Market Y-o-Y Growth Projections, By Application - 2022 to 2032

Figure 08: Global Market Attractiveness Index, By Application - 2022 to 2032

Figure 09: Global Market Share, By Region, 2022 & 2032

Figure 10: Global Market Y-o-Y Growth Projections, By Region - 2022 to 2032

Figure 11: Global Market Attractiveness Index, By Region - 2022 to 2032

Figure 12: North America Market Value (US$ Million) and Year-on-Year Growth, 2015 to 2032

Figure 13: North America Market Absolute $ Opportunity Historical (2015 to 2021) and Forecast Period (2022 to 2032), US$ Million

Figure 14: North America Market Share, By Type, 2022 & 2032

Figure 15: North America Market Y-o-Y Growth Projections, By Type - 2022 to 2032

Figure 16: North America Market Attractiveness Index, By Type - 2022 to 2032

Figure 17: North America Market Share, By Application, 2022 & 2032

Figure 18: North America Market Y-o-Y Growth Projections, By Application - 2022 to 2032

Figure 19: North America Market Attractiveness Index, By Application - 2022 to 2032

Figure 20: North America Market Share, By Country, 2022 & 2032

Figure 21: North America Market Y-o-Y Growth Projections, By Country - 2022 to 2032

Figure 22: North America Market Attractiveness Index, By Country - 2022 to 2032

Figure 23: Latin America Market Value (US$ Million) and Year-on-Year Growth, 2015 to 2032

Figure 24: Latin America Market Absolute $ Opportunity Historical (2015 to 2021) and Forecast Period (2022 to 2032), US$ Million

Figure 25: Latin America Market Share, By Type, 2022 & 2032

Figure 26: Latin America Market Y-o-Y Growth Projections, By Type - 2022 to 2032

Figure 27: Latin America Market Attractiveness Index, By Type - 2022 to 2032

Figure 28: Latin America Market Share, By Application, 2022 & 2032

Figure 29: Latin America Market Y-o-Y Growth Projections, By Application - 2022 to 2032

Figure 30: Latin America Market Attractiveness Index, By Application - 2022 to 2032

Figure 31: Latin America Market Share, By Country, 2022 & 2032

Figure 32: Latin America Market Y-o-Y Growth Projections, By Country - 2022 to 2032

Figure 33: Latin America Market Attractiveness Index, By Country - 2022 to 2032

Figure 34: Europe Market Value (US$ Million) and Year-on-Year Growth, 2015 to 2032

Figure 35: Europe Market Absolute $ Opportunity Historical (2015 to 2021) and Forecast Period (2022 to 2032), US$ Million

Figure 36: Europe Market Share, By Type, 2022 & 2032

Figure 37: Europe Market Y-o-Y Growth Projections, By Type - 2022 to 2032

Figure 38: Europe Market Attractiveness Index, By Type - 2022 to 2032

Figure 39: Europe Market Share, By Application, 2022 & 2032

Figure 40: Europe Market Y-o-Y Growth Projections, By Application - 2022 to 2032

Figure 41: Europe Market Attractiveness Index, By Application - 2022 to 2032

Figure 42: Europe Market Share, By Country, 2022 & 2032

Figure 43: Europe Market Y-o-Y Growth Projections, By Country - 2022 to 2032

Figure 44: Europe Market Attractiveness Index, By Country - 2022 to 2032

Figure 45: MEA Market Value (US$ Million) and Year-on-Year Growth, 2015 to 2032

Figure 46: MEA Market Absolute $ Opportunity Historical (2015 to 2021) and Forecast Period (2022 to 2032), US$ Million

Figure 47: MEA Market Share, By Type, 2022 & 2032

Figure 48: MEA Market Y-o-Y Growth Projections, By Type - 2022 to 2032

Figure 49: MEA Market Attractiveness Index, By Type - 2022 to 2032

Figure 50: MEA Market Share, By Application, 2022 & 2032

Figure 51: MEA Market Y-o-Y Growth Projections, By Application - 2022 to 2032

Figure 52: MEA Market Attractiveness Index, By Application - 2022 to 2032

Figure 53: MEA Market Share, By Country, 2022 & 2032

Figure 54: MEA Market Y-o-Y Growth Projections, By Country - 2022 to 2032

Figure 55: MEA Market Attractiveness Index, By Country - 2022 to 2032

Figure 56: Asia Pacific Market Value (US$ Million) and Year-on-Year Growth, 2015 to 2032

Figure 57: Asia Pacific Market Absolute $ Opportunity Historical (2015 to 2021) and Forecast Period (2022 to 2032), US$ Million

Figure 58: Asia Pacific Market Share, By Type, 2022 & 2032

Figure 59: Asia Pacific Market Y-o-Y Growth Projections, By Type - 2022 to 2032

Figure 60: Asia Pacific Market Attractiveness Index, By Type - 2022 to 2032

Figure 61: Asia Pacific Market Share, By Application, 2022 & 2032

Figure 62: Asia Pacific Market Y-o-Y Growth Projections, By Application - 2022 to 2032

Figure 63: Asia Pacific Market Attractiveness Index, By Application - 2022 to 2032

Figure 64: Asia Pacific Market Share, By Country, 2022 & 2032

Figure 65: Asia Pacific Market Y-o-Y Growth Projections, By Country - 2022 to 2032

Figure 66: Asia Pacific Market Attractiveness Index, By Country - 2022 to 2032

Figure 67: USA Market Value (US$ Million) and Forecast, 2022 to 2032

Figure 68: USA Market Share, By Type, 2021

Figure 69: USA Market Share, By Application, 2021

Figure 70: Canada Market Value (US$ Million) and Forecast, 2022 to 2032

Figure 71: Canada Market Share, By Type, 2021

Figure 72: Canada Market Share, By Application, 2021

Figure 73: Brazil Market Value (US$ Million) and Forecast, 2022 to 2032

Figure 74: Brazil Market Share, By Type, 2021

Figure 75: Brazil Market Share, By Application, 2021

Figure 76: Mexico Market Value (US$ Million) and Forecast, 2022 to 2032

Figure 77: Mexico Market Share, By Type, 2021

Figure 78: Mexico Market Share, By Application, 2021

Figure 79: Germany Market Value (US$ Million) and Forecast, 2022 to 2032

Figure 80: Germany Market Share, By Type, 2021

Figure 81: Germany Market Share, By Application, 2021

Figure 82: UK Market Value (US$ Million) and Forecast, 2022 to 2032

Figure 83: UK Market Share, By Type, 2021

Figure 84: UK Market Share, By Application, 2021

Figure 85: France Market Value (US$ Million) and Forecast, 2022 to 2032

Figure 86: France Market Share, By Type, 2021

Figure 87: France Market Share, By Application, 2021

Figure 88: Italy Market Value (US$ Million) and Forecast, 2022 to 2032

Figure 89: Italy Market Share, By Type, 2021

Figure 90: Italy Market Share, By Application, 2021

Figure 91: BENELUX Market Value (US$ Million) and Forecast, 2022 to 2032

Figure 92: BENELUX Market Share, By Type, 2021

Figure 93: BENELUX Market Share, By Application, 2021

Figure 94: Nordic Countries Market Value (US$ Million) and Forecast, 2022 to 2032

Figure 95: Nordic Countries Market Share, By Type, 2021

Figure 96: Nordic Countries Market Share, By Application, 2021

Figure 97: China Market Value (US$ Million) and Forecast, 2022 to 2032

Figure 98: China Market Share, By Type, 2021

Figure 99: China Market Share, By Application, 2021

Figure 100: Japan Market Value (US$ Million) and Forecast, 2022 to 2032

Figure 101: Japan Market Share, By Type, 2021

Figure 102: Japan Market Share, By Application, 2021

Figure 103: South Korea Market Value (US$ Million) and Forecast, 2022 to 2032

Figure 104: South Korea Market Share, By Type, 2021

Figure 105: South Korea Market Share, By Application, 2021

Figure 106: GCC Countries Market Value (US$ Million) and Forecast, 2022 to 2032

Figure 107: GCC Countries Market Share, By Type, 2021

Figure 108: GCC Countries Market Share, By Application, 2021

Figure 109: South Africa Market Value (US$ Million) and Forecast, 2022 to 2032

Figure 110: South Africa Market Share, By Type, 2021

Figure 111: South Africa Market Share, By Application, 2021

Figure 112: Turkey Market Value (US$ Million) and Forecast, 2022 to 2032

Figure 113: Turkey Market Share, By Type, 2021

Figure 114: Turkey Market Share, By Application, 2021

Recommendations

Technology

Financial Analytics Market

Published : October 2023

Technology

PCB Design Software Market

Published : May 2023

Technology

MEA Enterprise Software Market

Published : September 2022

Technology

Poland IT Software and Service Market

Published : January 2015

Explore Technology Insights

View Reports

Customer Journey Analytics Software Market