Unified Communications and Collaboration Market Outlook

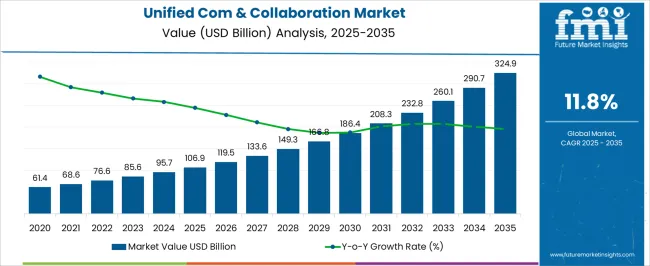
The global unified communications and collaboration market is estimated to be US$ 84,796.8 million in 2023. With a CAGR of 12.3%, the projected market growth from 2023 to 2033 is expected to be significantly higher than the historical growth. Large Enterprises are expected to be the highest revenue-generating category, projected to register an absolute dollar opportunity of 11.7% from 2023 to 2033.

Attribute Details
Global Unified Communications and Collaboration Market Size (2023) US$ 84,796.8 million
Global Unified Communications and Collaboration Market Size (2033) US$ 271,306.4 million
Global Unified Communications and Collaboration Market CAGR (2023 to 2033) 12.3%
United States Unified Communications and Collaboration Market Size (2033) US$ 84,796.8 million
United States Unified Communications and Collaboration Market CAGR (2023 to 2033) 12.3%

Don't pay for what you don't need

Customize your report by selecting specific countries or regions and save 30%!

Revenue of Unified Communications and Collaboration Market From 2018 to 2022 Compared to Demand Outlook For 2023 to 2033

As per the unified communications and collaboration market research by Future Market Insights - a market research and competitive intelligence provider, historically, from 2018 to 2022, the market value increased at around 15.7% CAGR.

Unified Communications (UC) systems have been used by businesses to decrease operational costs, improve revenues, and build customer connections. By combining diverse communication technologies into a single platform, UC enhances decision-making. As an outcome, unified communications systems are frequently used to promote cross-functional collaboration and achieve favorable results.

RingCentral, Inc., a leading supplier of global business cloud communication, collaborations, and contact center solutions, has established a significant relationship with Avaya Holdings Corp., a global pioneer in solutions to increase and simplify communication systems and collaborative efforts. Avaya will offer Avaya Cloud Office with RingCentral, a worldwide unified communication as a services (UCaaS) solution, as part of this exclusive alliance.

The most recent innovations, like Artificial Intelligence (AI), are crucial in aiding associations in accomplishing their computerized change objectives. Simulated intelligence-empowered arrangements can help associations make easy records, follow speakers, naturally record calls, and grasp clients' requirements. Artificial intelligence-empowered UCaaS arrangements can likewise help in opinion examination.

Factors Propelling Unified Communications and Collaboration Demand

The adoption of cloud-based communication solutions enabling quick and smooth communication across businesses is likely to boost market development. Businesses are using cloud-based collaboration solutions through several time zones to boost the effectiveness of their mobile team members.

The telecommunications industry will observe an uptick in revenue due to its collaboration with UCC, a single network infrastructure that supports unified communications management.

Comcast recently finalized the acquisition of Blueface, a provider of unified communication services. Blueface's patented and completely customized cloud voice unified communications technology will be added to Comcast Company's portfolio of business-grade products, allowing enterprises to interact and collaborate more easily.

Customers will have access to video and audio capabilities to communicate with employees throughout devices and locations since Blueface's Unified Communications (UC) service is added here to the Comcast Business portfolio.

Sudip Saha
Sudip Saha

Principal Consultant

Talk to Analyst

Find your sweet spots for generating winning opportunities in this market.

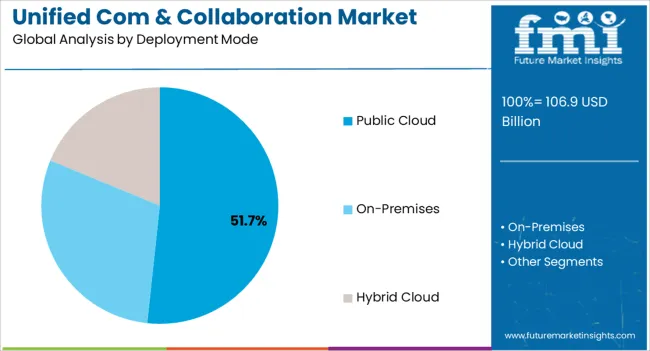
On-premise Deployment Mode Have Led to the Staggering Demand for Unified Communications and Collaboration

In 2023, the on-premise segment led the unified communications industry, accounting for over half of worldwide sales. However, due to the complexity of deploying and administering contemporary full-stack UC platforms, the demand for the new on-premise unified communication network and licenses is likely to continue to fall during the term.

Firewall and session border control systems must be configured to allow remote users access. As a result, demand for on-premise UC systems is likely to fall throughout the projection period.

Zoom recently announced the addition of a new Referral Partner Program and relationships with businesses like Master Agent AVANT Communication, Intelisys, Pax8, and Telarus to its Worldwide Channel Partner Program.

Zoom's video-first unified communication platform's go-to-market strategy will include the new Partner Referral Program. It builds successful relationships by training, enabling, and inspiring partners to develop, advertise, and sell Zoom-based solutions.
Region-Wise Analysis

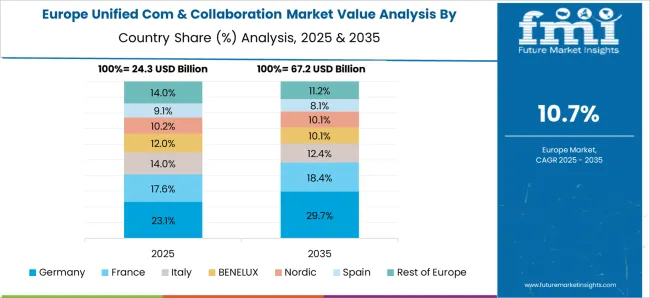
Europe is Projected to Offer the Largest Opportunity for Unified Communications and Collaboration Market

In 2020, Europe dominated the unified communications industry, accounting for over half of all sales. The growing demand for UC in the region has allowed many providers to establish themselves.

The Yamaha ADECIA solutions, a full and smart microphone and a lines array audio system intended to reduce all hurdles for outfitting conference rooms and schools with better audio quality, received a favorable review from Wainhouse Research.

The ADECIA product line solves installed audio issues by expediting installation and configuration once at a time when human capital is in limited supply throughout North America and Europe, thus lowering installation costs and production schedules.

Over the projection period, the market in the Asia Pacific is projected to account for the largest CAGR. The expansion can be ascribed to an increased focus on collaboration and cost-cutting strategies in the region to guarantee greater resource use.

Banking and financial services, BPO, government, telecommunications, logistics, and hospitality have all resorted to unified communications to provide more effective services.

Get the data you need at a Fraction of the cost

Personalize your report by choosing insights you need
and save 40%!

Country-Wise Analysis

The United States Dominates the Unified Communications and Collaboration Market

By the end of 2033, the United States is predicted to account for the largest market share of US$ 83 Billion. Given that the United States was one of the countries most hit by COVID-19, government agencies, healthcare professionals, and physical and online distribution networks in the United States are counting on effective communication and teamwork to provide sufficient care and diagnosis. In the United States, this has been pushing the application of UCaaS.

360networks is a significant wholesale distributor of communications equipment and services within the western United States. Their entire variety of voice-leased line circuits, including data services, is built on a unified network infrastructure that the firm owns and operates, allowing them to deliver dependable, rapid client support directly from the source.

The fiber-optic backbone was designed from the bottom up to provide constant performance throughout 17,200 route miles.

Category-Wise Insights

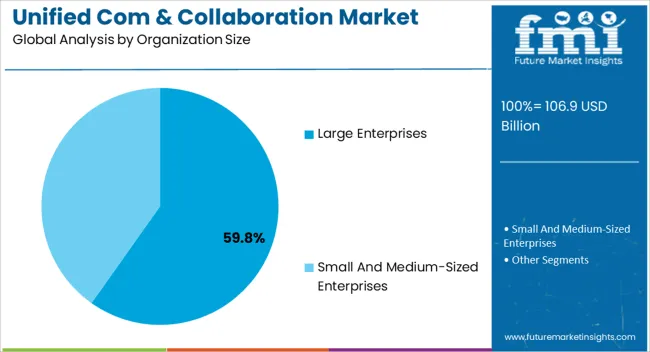
Large Enterprise Segment is Projected to Witness the Fastest Growth among Unified Communications and Collaboration Type

The large enterprise segment is forecasted to grow at the highest CAGR of over 11.7% from 2023 to 2033. Tech-savvy employees demand more communication at work to promote efficiency and production. Furthermore, the sector is driven by the growing number of millennials in the workplace and the necessity for multi-channel communication.

Large organizations are continually updating their communication infrastructure to attract the finest employees. As a result of the new generation of employees, the demand for UC is projected to increase in the coming years.

BlueJeans Network, a recognized enterprise-grade video conferencing and events platform, was acquired by Verizon Business in a formal agreement. With this purchase, Verizon's virtual unified communications portfolio has expanded. BlueJeans' easy, smart, and trustworthy meeting platform will be combined with Verizon's unified communication as a services provider.

On Verizon's high-performance international networks, customers can benefit from a BlueJeans company video experience. Additionally, the platform will be tightly integrated into Verizon's 5G product pipeline, allowing for secured and actual engagement solutions in high-growth sectors, including medical, remote learning, and field service operations.

BFSI Segment Expected to Score the Highest Growth in the Unified Communications and Collaboration Industry

The BFSI segment is forecasted to grow at the highest CAGR of over 12% from 2023 to 2033. Within the financial services industry, unified communications and collaboration are at the edge of facilitating transformation.

Digital transformation thrives with UC&C, whether in dispersed financial services delivery, developing new channels and forms of interaction, agile operations, or fulfilling new regulatory criteria. Financial services businesses with better insight and control over their UC&C landscape are becoming masters of change.

The Reserve Bank of India has sent off UPI123Pay, a solution that will permit clients to make UPI payments utilizing their cell phones and incorporate them into the electronic payment environment. The UPI 123 services will be available to the country's expected 450 million functional mobile users, primarily utilizing 2G networks.

UPI-123Pay seeks to provide the UPI stack's online payment value to feature handsets. Users were required to call a feature phone and pay up to a predetermined number to access banking transactions without using the internet by using UPI payment through the use of pre-defined IVR numbers.
Competitive Analysis

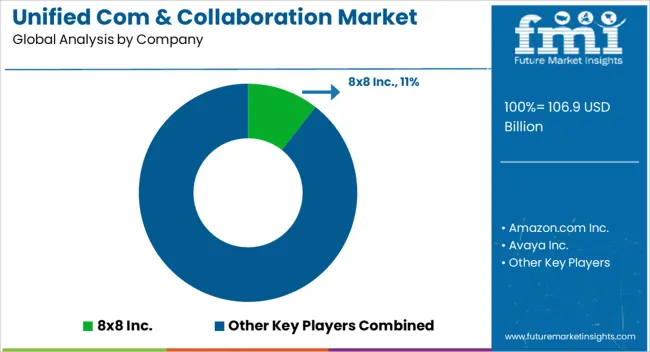
The leading players in the global Unified Communications and Collaboration market are Zoom Video Services, BlueJeans Network, Verizon, BT Group, Cisco Systems Inc., Genesys (Permira), Google LLC, Huawei Technologies Co., Ltd., Microsoft Corporation, Mitel Networks Corporation, NEC Corporation.

  • In April 2020, Verizon Communications Inc. agreed to acquire BlueJeans Network, a video conferencing business event solution for enterprises. Verizon's comprehensive, unified communications offering will benefit from the purchase. BlueJeans' meeting technology, in particular, will be connected with Verizon's unified communications like a services provider.
  • In January 2020, Comcast bought Blueface, a worldwide technology business in Dublin, Ireland, and a pioneer in unified communications systems. Blueface's patented and completely customized cloud voice unified communications technology will be added to Comcast Business's portfolio of business-grade products, allowing enterprises to connect and collaborate effortlessly and internationally.

Market Segments Covered in Unified Communications and Collaboration Market Analysis

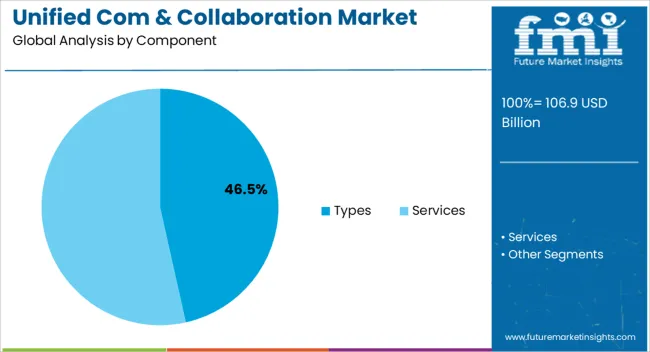
By Component:

  • Types
  • Services

By Deployment Mode:

  • On-premises,
  • Public Cloud
  • Hybrid Cloud

By Organization Size:

  • Small and Medium-sized Enterprises
  • Large Enterprises

By Vertical:

  • BFSI, Healthcare
  • Retail and Consumer Goods
  • Public Sector and Utilities
  • Logistics and Transportation
  • Travel and Hospitality
  • IT and Telecom

By Region:

  • North America
  • Europe
  • Asia Pacific
  • Middle East and Africa
  • Latin America

Frequently Asked Questions

Which Countries Dominate the Global Market?

The United States, Japan, and China dominate the global market.

What is the Growth Forecast for Unified Communication and Collaboration Market?

The market is forecast to register a CAGR of 11.7% through 2033.

How was the Historical Performance of the Market?

From 2018 to 2022, the market registered at a CAGR of 15.7%.

Which is the Top Trend in the Unified Communication and Collaboration Market?

Cloud-based communication solution is the current market trend.

What is the Projected Size of the Market by 2033?

The global market size is to reach US$ 84,796.8 million by 2033.

Table of Content
1. Executive Summary
    1.1. Global Market Outlook
    1.2. Demand-side Trends
    1.3. Supply-side Trends
    1.4. Technology Roadmap Analysis
    1.5. Analysis and Recommendations
2. Market Overview
    2.1. Market Coverage / Taxonomy
    2.2. Market Definition / Scope / Limitations
3. Market Background
    3.1. Market Dynamics
        3.1.1. Drivers
        3.1.2. Restraints
        3.1.3. Opportunity
        3.1.4. Trends
    3.2. Scenario Forecast
        3.2.1. Demand in Optimistic Scenario
        3.2.2. Demand in Likely Scenario
        3.2.3. Demand in Conservative Scenario
    3.3. Opportunity Map Analysis
    3.4. Investment Feasibility Matrix
    3.5. PESTLE and Porter’s Analysis
    3.6. Regulatory Landscape
        3.6.1. By Key Regions
        3.6.2. By Key Countries
    3.7. Regional Parent Market Outlook
4. Global Market Analysis 2018 to 2022 and Forecast, 2023 to 2033
    4.1. Historical Market Size Value (US$ Million) Analysis, 2018 to 2022
    4.2. Current and Future Market Size Value (US$ Million) Projections, 2023 to 2033
        4.2.1. Y-o-Y Growth Trend Analysis
        4.2.2. Absolute $ Opportunity Analysis
5. Global Market Analysis 2018 to 2022 and Forecast 2023 to 2033, By Component
    5.1. Introduction / Key Findings
    5.2. Historical Market Size Value (US$ Million) Analysis By Component, 2018 to 2022
    5.3. Current and Future Market Size Value (US$ Million) Analysis and Forecast By Component, 2023 to 2033
        5.3.1. Types
        5.3.2. Services
    5.4. Y-o-Y Growth Trend Analysis By Component, 2018 to 2022
    5.5. Absolute $ Opportunity Analysis By Component, 2023 to 2033
6. Global Market Analysis 2018 to 2022 and Forecast 2023 to 2033, By Deployment Mode
    6.1. Introduction / Key Findings
    6.2. Historical Market Size Value (US$ Million) Analysis By Deployment Mode, 2018 to 2022
    6.3. Current and Future Market Size Value (US$ Million) Analysis and Forecast By Deployment Mode, 2023 to 2033
        6.3.1. On-Premises
        6.3.2. Public Cloud
        6.3.3. Hybrid Cloud
    6.4. Y-o-Y Growth Trend Analysis By Deployment Mode, 2018 to 2022
    6.5. Absolute $ Opportunity Analysis By Deployment Mode, 2023 to 2033
7. Global Market Analysis 2018 to 2022 and Forecast 2023 to 2033, By Organization Size
    7.1. Introduction / Key Findings
    7.2. Historical Market Size Value (US$ Million) Analysis by Organization Size, 2018 to 2022
    7.3. Current and Future Market Size Value (US$ Million) Analysis and Forecast by Organization Size, 2023 to 2033
        7.3.1. Small and Medium-sized Enterprises
        7.3.2. Large Enterprises
    7.4. Y-o-Y Growth Trend Analysis by Organization Size, 2018 to 2022
    7.5. Absolute $ Opportunity Analysis by Organization Size, 2023 to 2033
8. Global Market Analysis 2018 to 2022 and Forecast 2023 to 2033, By Vertical
    8.1. Introduction / Key Findings
    8.2. Historical Market Size Value (US$ Million) Analysis By Vertical, 2018 to 2022
    8.3. Current and Future Market Size Value (US$ Million) Analysis and Forecast By Vertical, 2023 to 2033
        8.3.1. BFSI
        8.3.2. Retail and Consumer Goods
        8.3.3. Public Sector and Utilities
        8.3.4. Logistics and Transportation
        8.3.5. Travel and Hospitality
        8.3.6. IT and Telecom
        8.3.7. Healthcare
    8.4. Y-o-Y Growth Trend Analysis By Vertical, 2018 to 2022
    8.5. Absolute $ Opportunity Analysis By Vertical, 2023 to 2033
9. Global Market Analysis 2018 to 2022 and Forecast 2023 to 2033, By Region
    9.1. Introduction
    9.2. Historical Market Size Value (US$ Million) Analysis By Region, 2018 to 2022
    9.3. Current Market Size Value (US$ Million) Analysis and Forecast By Region, 2023 to 2033
        9.3.1. North America
        9.3.2. Latin America
        9.3.3. Western Europe
        9.3.4. Eastern Europe
        9.3.5. South Asia and Pacific
        9.3.6. East Asia
        9.3.7. Middle East and Africa
    9.4. Market Attractiveness Analysis By Region
10. North America Market Analysis 2018 to 2022 and Forecast 2023 to 2033, By Country
    10.1. Historical Market Size Value (US$ Million) Trend Analysis By Market Taxonomy, 2018 to 2022
    10.2. Market Size Value (US$ Million) Forecast By Market Taxonomy, 2023 to 2033
        10.2.1. By Country
            10.2.1.1. The USA
            10.2.1.2. Canada
        10.2.2. By Component
        10.2.3. By Deployment Mode
        10.2.4. By Organization Size
        10.2.5. By Vertical
    10.3. Market Attractiveness Analysis
        10.3.1. By Country
        10.3.2. By Component
        10.3.3. By Deployment Mode
        10.3.4. By Organization Size
        10.3.5. By Vertical
    10.4. Key Takeaways
11. Latin America Market Analysis 2018 to 2022 and Forecast 2023 to 2033, By Country
    11.1. Historical Market Size Value (US$ Million) Trend Analysis By Market Taxonomy, 2018 to 2022
    11.2. Market Size Value (US$ Million) Forecast By Market Taxonomy, 2023 to 2033
        11.2.1. By Country
            11.2.1.1. Brazil
            11.2.1.2. Mexico
            11.2.1.3. Rest of Latin America
        11.2.2. By Component
        11.2.3. By Deployment Mode
        11.2.4. By Organization Size
        11.2.5. By Vertical
    11.3. Market Attractiveness Analysis
        11.3.1. By Country
        11.3.2. By Component
        11.3.3. By Deployment Mode
        11.3.4. By Organization Size
        11.3.5. By Vertical
    11.4. Key Takeaways
12. Western Europe Market Analysis 2018 to 2022 and Forecast 2023 to 2033, By Country
    12.1. Historical Market Size Value (US$ Million) Trend Analysis By Market Taxonomy, 2018 to 2022
    12.2. Market Size Value (US$ Million) Forecast By Market Taxonomy, 2023 to 2033
        12.2.1. By Country
            12.2.1.1. Germany
            12.2.1.2. United Kingdom
            12.2.1.3. France
            12.2.1.4. Spain
            12.2.1.5. Italy
            12.2.1.6. Rest of Western Europe
        12.2.2. By Component
        12.2.3. By Deployment Mode
        12.2.4. By Organization Size
        12.2.5. By Vertical
    12.3. Market Attractiveness Analysis
        12.3.1. By Country
        12.3.2. By Component
        12.3.3. By Deployment Mode
        12.3.4. By Organization Size
        12.3.5. By Vertical
    12.4. Key Takeaways
13. Eastern Europe Market Analysis 2018 to 2022 and Forecast 2023 to 2033, By Country
    13.1. Historical Market Size Value (US$ Million) Trend Analysis By Market Taxonomy, 2018 to 2022
    13.2. Market Size Value (US$ Million) Forecast By Market Taxonomy, 2023 to 2033
        13.2.1. By Country
            13.2.1.1. Poland
            13.2.1.2. Russia
            13.2.1.3. Czech Republic
            13.2.1.4. Romania
            13.2.1.5. Rest of Eastern Europe
        13.2.2. By Component
        13.2.3. By Deployment Mode
        13.2.4. By Organization Size
        13.2.5. By Vertical
    13.3. Market Attractiveness Analysis
        13.3.1. By Country
        13.3.2. By Component
        13.3.3. By Deployment Mode
        13.3.4. By Organization Size
        13.3.5. By Vertical
    13.4. Key Takeaways
14. South Asia and Pacific Market Analysis 2018 to 2022 and Forecast 2023 to 2033, By Country
    14.1. Historical Market Size Value (US$ Million) Trend Analysis By Market Taxonomy, 2018 to 2022
    14.2. Market Size Value (US$ Million) Forecast By Market Taxonomy, 2023 to 2033
        14.2.1. By Country
            14.2.1.1. India
            14.2.1.2. Bangladesh
            14.2.1.3. Australia
            14.2.1.4. New Zealand
            14.2.1.5. Rest of South Asia and Pacific
        14.2.2. By Component
        14.2.3. By Deployment Mode
        14.2.4. By Organization Size
        14.2.5. By Vertical
    14.3. Market Attractiveness Analysis
        14.3.1. By Country
        14.3.2. By Component
        14.3.3. By Deployment Mode
        14.3.4. By Organization Size
        14.3.5. By Vertical
    14.4. Key Takeaways
15. East Asia Market Analysis 2018 to 2022 and Forecast 2023 to 2033, By Country
    15.1. Historical Market Size Value (US$ Million) Trend Analysis By Market Taxonomy, 2018 to 2022
    15.2. Market Size Value (US$ Million) Forecast By Market Taxonomy, 2023 to 2033
        15.2.1. By Country
            15.2.1.1. China
            15.2.1.2. Japan
            15.2.1.3. South Korea
        15.2.2. By Component
        15.2.3. By Deployment Mode
        15.2.4. By Organization Size
        15.2.5. By Vertical
    15.3. Market Attractiveness Analysis
        15.3.1. By Country
        15.3.2. By Component
        15.3.3. By Deployment Mode
        15.3.4. By Organization Size
        15.3.5. By Vertical
    15.4. Key Takeaways
16. Middle East and Africa Market Analysis 2018 to 2022 and Forecast 2023 to 2033, By Country
    16.1. Historical Market Size Value (US$ Million) Trend Analysis By Market Taxonomy, 2018 to 2022
    16.2. Market Size Value (US$ Million) Forecast By Market Taxonomy, 2023 to 2033
        16.2.1. By Country
            16.2.1.1. GCC Countries
            16.2.1.2. South Africa
            16.2.1.3. Israel
            16.2.1.4. Rest of MEA
        16.2.2. By Component
        16.2.3. By Deployment Mode
        16.2.4. By Organization Size
        16.2.5. By Vertical
    16.3. Market Attractiveness Analysis
        16.3.1. By Country
        16.3.2. By Component
        16.3.3. By Deployment Mode
        16.3.4. By Organization Size
        16.3.5. By Vertical
    16.4. Key Takeaways
17. Key Countries Market Analysis
    17.1. USA
        17.1.1. Pricing Analysis
        17.1.2. Market Share Analysis, 2022
            17.1.2.1. By Component
            17.1.2.2. By Deployment Mode
            17.1.2.3. By Organization Size
            17.1.2.4. By Vertical
    17.2. Canada
        17.2.1. Pricing Analysis
        17.2.2. Market Share Analysis, 2022
            17.2.2.1. By Component
            17.2.2.2. By Deployment Mode
            17.2.2.3. By Organization Size
            17.2.2.4. By Vertical
    17.3. Brazil
        17.3.1. Pricing Analysis
        17.3.2. Market Share Analysis, 2022
            17.3.2.1. By Component
            17.3.2.2. By Deployment Mode
            17.3.2.3. By Organization Size
            17.3.2.4. By Vertical
    17.4. Mexico
        17.4.1. Pricing Analysis
        17.4.2. Market Share Analysis, 2022
            17.4.2.1. By Component
            17.4.2.2. By Deployment Mode
            17.4.2.3. By Organization Size
            17.4.2.4. By Vertical
    17.5. Germany
        17.5.1. Pricing Analysis
        17.5.2. Market Share Analysis, 2022
            17.5.2.1. By Component
            17.5.2.2. By Deployment Mode
            17.5.2.3. By Organization Size
            17.5.2.4. By Vertical
    17.6. United Kingdom
        17.6.1. Pricing Analysis
        17.6.2. Market Share Analysis, 2022
            17.6.2.1. By Component
            17.6.2.2. By Deployment Mode
            17.6.2.3. By Organization Size
            17.6.2.4. By Vertical
    17.7. France
        17.7.1. Pricing Analysis
        17.7.2. Market Share Analysis, 2022
            17.7.2.1. By Component
            17.7.2.2. By Deployment Mode
            17.7.2.3. By Organization Size
            17.7.2.4. By Vertical
    17.8. Spain
        17.8.1. Pricing Analysis
        17.8.2. Market Share Analysis, 2022
            17.8.2.1. By Component
            17.8.2.2. By Deployment Mode
            17.8.2.3. By Organization Size
            17.8.2.4. By Vertical
    17.9. Italy
        17.9.1. Pricing Analysis
        17.9.2. Market Share Analysis, 2022
            17.9.2.1. By Component
            17.9.2.2. By Deployment Mode
            17.9.2.3. By Organization Size
            17.9.2.4. By Vertical
    17.10. Poland
        17.10.1. Pricing Analysis
        17.10.2. Market Share Analysis, 2022
            17.10.2.1. By Component
            17.10.2.2. By Deployment Mode
            17.10.2.3. By Organization Size
            17.10.2.4. By Vertical
    17.11. Russia
        17.11.1. Pricing Analysis
        17.11.2. Market Share Analysis, 2022
            17.11.2.1. By Component
            17.11.2.2. By Deployment Mode
            17.11.2.3. By Organization Size
            17.11.2.4. By Vertical
    17.12. Czech Republic
        17.12.1. Pricing Analysis
        17.12.2. Market Share Analysis, 2022
            17.12.2.1. By Component
            17.12.2.2. By Deployment Mode
            17.12.2.3. By Organization Size
            17.12.2.4. By Vertical
    17.13. Romania
        17.13.1. Pricing Analysis
        17.13.2. Market Share Analysis, 2022
            17.13.2.1. By Component
            17.13.2.2. By Deployment Mode
            17.13.2.3. By Organization Size
            17.13.2.4. By Vertical
    17.14. India
        17.14.1. Pricing Analysis
        17.14.2. Market Share Analysis, 2022
            17.14.2.1. By Component
            17.14.2.2. By Deployment Mode
            17.14.2.3. By Organization Size
            17.14.2.4. By Vertical
    17.15. Bangladesh
        17.15.1. Pricing Analysis
        17.15.2. Market Share Analysis, 2022
            17.15.2.1. By Component
            17.15.2.2. By Deployment Mode
            17.15.2.3. By Organization Size
            17.15.2.4. By Vertical
    17.16. Australia
        17.16.1. Pricing Analysis
        17.16.2. Market Share Analysis, 2022
            17.16.2.1. By Component
            17.16.2.2. By Deployment Mode
            17.16.2.3. By Organization Size
            17.16.2.4. By Vertical
    17.17. New Zealand
        17.17.1. Pricing Analysis
        17.17.2. Market Share Analysis, 2022
            17.17.2.1. By Component
            17.17.2.2. By Deployment Mode
            17.17.2.3. By Organization Size
            17.17.2.4. By Vertical
    17.18. China
        17.18.1. Pricing Analysis
        17.18.2. Market Share Analysis, 2022
            17.18.2.1. By Component
            17.18.2.2. By Deployment Mode
            17.18.2.3. By Organization Size
            17.18.2.4. By Vertical
    17.19. Japan
        17.19.1. Pricing Analysis
        17.19.2. Market Share Analysis, 2022
            17.19.2.1. By Component
            17.19.2.2. By Deployment Mode
            17.19.2.3. By Organization Size
            17.19.2.4. By Vertical
    17.20. South Korea
        17.20.1. Pricing Analysis
        17.20.2. Market Share Analysis, 2022
            17.20.2.1. By Component
            17.20.2.2. By Deployment Mode
            17.20.2.3. By Organization Size
            17.20.2.4. By Vertical
    17.21. GCC Countries
        17.21.1. Pricing Analysis
        17.21.2. Market Share Analysis, 2022
            17.21.2.1. By Component
            17.21.2.2. By Deployment Mode
            17.21.2.3. By Organization Size
            17.21.2.4. By Vertical
    17.22. South Africa
        17.22.1. Pricing Analysis
        17.22.2. Market Share Analysis, 2022
            17.22.2.1. By Component
            17.22.2.2. By Deployment Mode
            17.22.2.3. By Organization Size
            17.22.2.4. By Vertical
    17.23. Israel
        17.23.1. Pricing Analysis
        17.23.2. Market Share Analysis, 2022
            17.23.2.1. By Component
            17.23.2.2. By Deployment Mode
            17.23.2.3. By Organization Size
            17.23.2.4. By Vertical
18. Market Structure Analysis
    18.1. Competition Dashboard
    18.2. Competition Benchmarking
    18.3. Market Share Analysis of Top Players
        18.3.1. By Regional
        18.3.2. By Component
        18.3.3. By Deployment Mode
        18.3.4. By Organization Size
        18.3.5. By Vertical
19. Competition Analysis
    19.1. Competition Deep Dive
        19.1.1. 8x8 Inc.
            19.1.1.1. Overview
            19.1.1.2. Product Portfolio
            19.1.1.3. Profitability by Market Segments
            19.1.1.4. Sales Footprint
            19.1.1.5. Strategy Overview
                19.1.1.5.1. Marketing Strategy
        19.1.2. Amazon.com Inc.
            19.1.2.1. Overview
            19.1.2.2. Product Portfolio
            19.1.2.3. Profitability by Market Segments
            19.1.2.4. Sales Footprint
            19.1.2.5. Strategy Overview
                19.1.2.5.1. Marketing Strategy
        19.1.3. Avaya Inc.
            19.1.3.1. Overview
            19.1.3.2. Product Portfolio
            19.1.3.3. Profitability by Market Segments
            19.1.3.4. Sales Footprint
            19.1.3.5. Strategy Overview
                19.1.3.5.1. Marketing Strategy
        19.1.4. CenturyLink Inc.
            19.1.4.1. Overview
            19.1.4.2. Product Portfolio
            19.1.4.3. Profitability by Market Segments
            19.1.4.4. Sales Footprint
            19.1.4.5. Strategy Overview
                19.1.4.5.1. Marketing Strategy
        19.1.5. Cisco Systems, Inc.
            19.1.5.1. Overview
            19.1.5.2. Product Portfolio
            19.1.5.3. Profitability by Market Segments
            19.1.5.4. Sales Footprint
            19.1.5.5. Strategy Overview
                19.1.5.5.1. Marketing Strategy
        19.1.6. Fuze Inc.
            19.1.6.1. Overview
            19.1.6.2. Product Portfolio
            19.1.6.3. Profitability by Market Segments
            19.1.6.4. Sales Footprint
            19.1.6.5. Strategy Overview
                19.1.6.5.1. Marketing Strategy
        19.1.7. Cisco Systems Inc.
            19.1.7.1. Overview
            19.1.7.2. Product Portfolio
            19.1.7.3. Profitability by Market Segments
            19.1.7.4. Sales Footprint
            19.1.7.5. Strategy Overview
                19.1.7.5.1. Marketing Strategy
        19.1.8. Avaya Inc.
            19.1.8.1. Overview
            19.1.8.2. Product Portfolio
            19.1.8.3. Profitability by Market Segments
            19.1.8.4. Sales Footprint
            19.1.8.5. Strategy Overview
                19.1.8.5.1. Marketing Strategy
        19.1.9. Alcatel-Lucent
            19.1.9.1. Overview
            19.1.9.2. Product Portfolio
            19.1.9.3. Profitability by Market Segments
            19.1.9.4. Sales Footprint
            19.1.9.5. Strategy Overview
                19.1.9.5.1. Marketing Strategy
        19.1.10. IBM Corporation
            19.1.10.1. Overview
            19.1.10.2. Product Portfolio
            19.1.10.3. Profitability by Market Segments
            19.1.10.4. Sales Footprint
            19.1.10.5. Strategy Overview
                19.1.10.5.1. Marketing Strategy
        19.1.11. Plantronics Inc.
            19.1.11.1. Overview
            19.1.11.2. Product Portfolio
            19.1.11.3. Profitability by Market Segments
            19.1.11.4. Sales Footprint
            19.1.11.5. Strategy Overview
                19.1.11.5.1. Marketing Strategy
20. Assumptions & Acronyms Used
21. Research Methodology
Recommendations

Technology

Telecommunications Services Market

September 2022

REP-GB-127

250 pages

Explore Technology Insights

View Reports
Future Market Insights

Unified Communications and Collaboration Market

Schedule a Call