Reports

- Global Locations -

Headquarters

Future Market Insights, Inc.

Christiana Corporate, 200
Continental Drive, Suite 401,
Newark, Delaware - 19713,
United States

T: +1-845-579-5705

Americas

Future Market Insights, Inc.

616 Corporate Way, Suite 2-9018,
Valley Cottage, NY 10989, United States

T: +1-347-918-3531

MEA

Future Market Insights

1602-6 Jumeirah Bay X2 Tower, Plot No: JLT-PH2-X2A,
Jumeirah Lakes Towers, Dubai,
United Arab Emirates

Europe

Future Market Insights

3rd Floor, 207 Regent Street,
W1B 3HH London
United Kingdom

T: + 44 (0) 20 8123 9659
D: +44 (0) 20 3287 4268

Asia Pacific

Future Market Insights

IndiaLand Global Tech Park, Unit UG-1, Behind Grand HighStreet, Phase 1, Hinjawadi, MH, Pune – 411057, India

Oilfield Communications Market Outlook (2023 to 2033)

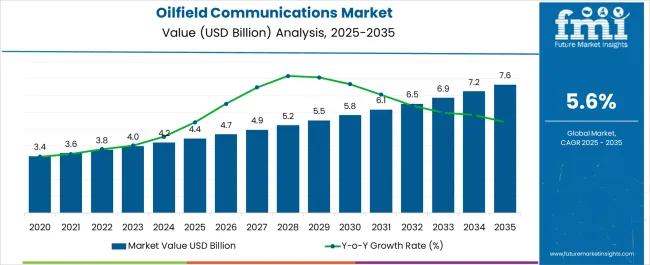
The oilfield communications market is anticipated to expand at a CAGR of 5.6% through 2033, from US$ 3,975.2 million in 2023 to US$ 6,876.3 million by 2033.

Increasing investments in network infrastructure, rising demand from oil and gas operators to scale the production of mature oilfields, and rising technological advancements for communication across oilfields are expected to drive oilfield communications market adoption trends.

The oil and gas industry will have more oilfield communications market opportunities to deploy private long-term evolution (LTE) and 5G networks as 4G wireless communication technology has a wider adoption of oilfield communications and 5G standards evolve to cover industrial use cases.

There is still a lot of uncertainty when it comes to 5G plans in the market. However, 5G will become a significant competitive advantage for oil and gas companies soon affecting market opportunities.

Oil E&P is becoming more efficient and agile, which is driving ambitious digital initiatives in the E&P segment impacting the market opportunities.

As we witness the adoption of oilfield communications connected technologies like the Internet of Things (IoT) and Artificial Intelligence, cyber attackers have been targeting crude oil and gas companies with sophisticated attacks for years (AI). Therefore, different risks and strategies are associated with different aspects of the market, influencing the oilfield communications market's future trends.

Upstream operations with the highest cyber risk profiles are development, drilling, and production, while seismic imaging has a lower risk profile. The growing need to digitize, eStore, and feed seismic data into other disciplines may increase the company's risk profile to escalate future market trends.

Apart from its critical infrastructure status, the upstream market’s complex computation, networking, and physical, operational processes spread across the globe make it highly vulnerable to cyber-attacks.

Attributes Details
Oilfield Communications Market CAGR (2023 to 2033) 5.6%
Oilfield Communications Market Size (2023) US$ 3,975.2 million
Category Component
Leading Segment Solutions
Market Share 65.4%
Category Communication Network
Leading Segment VSAT Communication Network
Market Share 32.2%

Don't pay for what you don't need

Customize your report by selecting specific countries or regions and save 30%!

What is Propelling the Oilfield Communications Market?

Although there is still uncertainty about 5G adoption plans, it is already speculated that 5G is going to become a real competitive advantage for the market. The oilfield communications market is expected to benefit from the rapid adoption of oilfield communications along with wireless 4G communication networks and the implementation of 5G standards in industrial activities.

Agility and efficiency in oil exploration and production (E&P) activities are becoming an unavoidable requirement, which is spurring ambitious digital initiatives in the oil E&P sector boosting the market key trends and opportunities.

What Restrains the Oilfield Communications Market?

Oil is a finite resource that will not last indefinitely. Oil prices have also been volatile over the years due to changes in demand for oilfield communications and supply, as well as geopolitical events.

Geoscientists are constantly working to discover new oil sources and explore untapped reserves. On the other hand, scientists are working around the clock to investigate alternative energy sources. Oil prices are dropping impulsively as the viral outbreak spreads to more countries, and demand for oilfield communications along with market future trends weakens.

If the situation continues to deteriorate for another year, it will be devastating to the market. Exporting countries will have a negative impact on the market.

Sudip Saha
Sudip Saha

Principal Consultant

Talk to Analyst

Find your sweet spots for generating winning opportunities in this market.

What are the Trends in the Oilfield Communications Market?

The oilfield communications market has a long history with digital technologies, particularly upstream, and there is still a lot of room for digitalization to improve operations for the market.

Oilfield communications market companies continue to invest in improved technologies for oilfield communications solutions despite rising costs and declining revenues.

The market is becoming more efficient as IoT integration, cloud computing, fleet management solutions, and automation become more efficient witnessing an escalation in market key trends and opportunities.

The digitalization of oilfield communications reduces human errors and allows for real-time data monitoring, resulting in long-term revenue. The market has finally made the transition to digital process control and automation. Robotic Drilling Systems AS of Norway and Siemens, for example, have collaborated to develop a drill floor solution based on robotic technology for fully unmanned oil and gas drill floor operations.
Comparative View of Adjacent Oilfield Communications Market

Oilfield Communications Market :

Attributes Oilfield Communications Market
CAGR (2023 to 2033) 5.6%
Market Value (2033) USD 6,876.3 Million
Growth Factor Increasing investments in network infrastructure improvements
Opportunity 5G is expected to play a key role in the digitalization of oilfield communications.
Key Trends Oil and gas companies are increasingly looking to scale up production of mature oilfields.

Digital Oilfield Market :

Attributes Digital Oilfield Market
CAGR (2022 to 2032) 5.6%
Market Value (2027) USD 33.79 billion
Growth Factor In the oil and gas industry, the return on investment has increased.
Opportunity Demand for offshore/ultra-deep-water discoveries is increasing.
Key Trends The demand for maximising the production potential of mature wells is growing.

In-flight Entertainment & Connectivity Market :

Attributes In-flight Entertainment & Connectivity Market
CAGR (2022 to 2032) 5.2%
Market Value (2027) USD 6.42 billion
Growth Factor In-flight experience is becoming more popular.
Opportunity South-East Asian emerging markets
Key Trends Increased aircraft renewals and deliveries, as well as a technological shift

Get the data you need at a Fraction of the cost

Personalize your report by choosing insights you need
and save 40%!

What is the Segmentation Outlook of the Oilfield Communications Market?

Component, communication network, application, and field site are the four segments of the market. The growth of the various segments aids you in gaining knowledge of the various growth factors that are expected to be prevalent throughout the market, as well as formulating different strategies to help identify core application areas and differences in your target oilfield communications market.

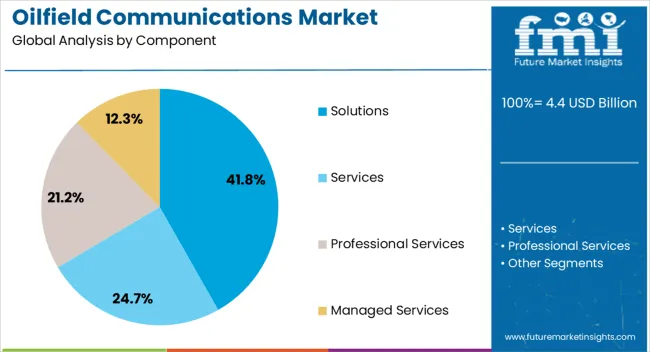
Depending on the component, the market is divided into solutions and services (professional services and managed services).

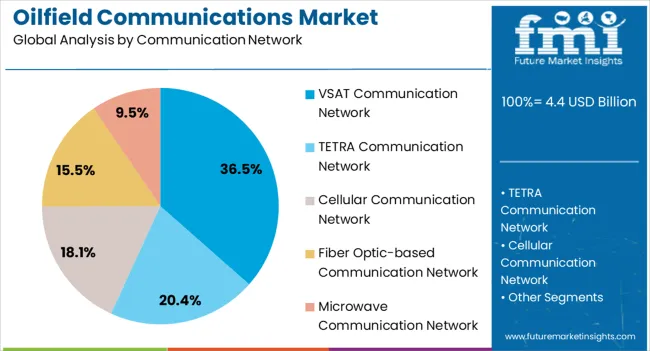
The market is divided into VSAT communication networks, tetra communication networks, cellular communication networks, fiber optic-based communication networks, and microwave communication networks, depending on the communication network.

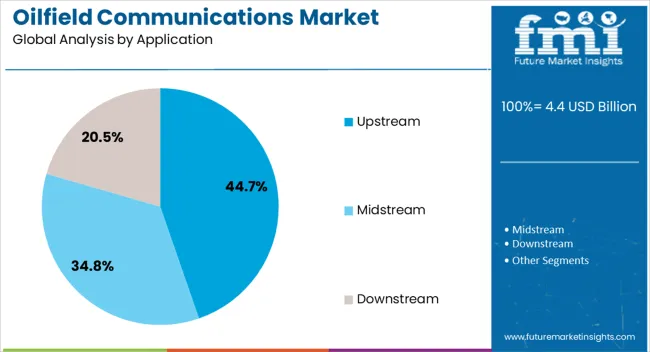
Depending on the application, the market is divided into upstream, midstream, and downstream.

The market is divided into onshore and offshore, depending on the field site.

Which is the Leading Segment in the Oilfield Communications Market by Communication Network?

The oilfield communications market is divided into microwave communication networks, tetra networks, cellular communication networks, fiber optic based communication networks, vsat communication networks, different band types (L-Band, HTS, KU Band, C Band), and others based on communication network technology.

The VSAT communication network segment is expected to be the most popular in the market. The ability of VSAT communication networks to enable high-speed data access, as well as telephone and video conferencing, is one of the future trends in the market.

Which is the Leading Segment in the Oilfield Communications Market by Field Site?

The oilfield communications market is divided into onshore communications and offshore communications, depending on the field site. The onshore communications segment is expected to account for the largest market share.

The factors that are to blame for oil and gas companies' desire to improve field operations and recovery while lowering costs influences market adoption trends through data aggregation, automation, and improved lift functionality.

Which is the Leading Segment in the Oilfield Communications Market by Component?

The market is divided into services and solutions based on the component. The services segment is expected to grow at the fastest rate, while the solutions segment is expected to grow at the slowest rate in the oilfield communications market.

Which is the Leading Region in the Oilfield Communications Market?

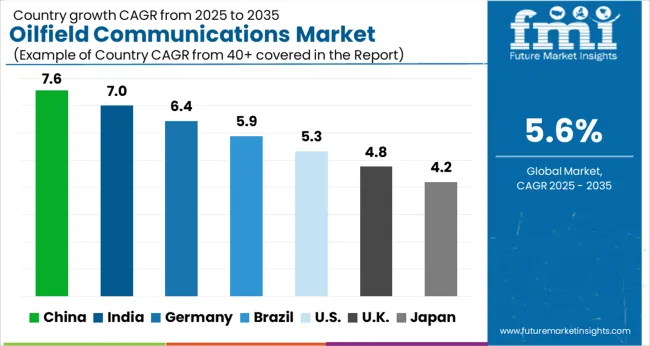
Regions CAGR (2022-2032)
United States 4.9%
United Kingdom 4.4%
China 4.7%
Japan 4.0%
South Korea 3.3%

North America is expected to dominate the oilfield communications market, owing to increased demand for oilfield communications and utilization of these technologies in large oilfields and offshore sites.

With rapidly rising production and exploration activities and newly discovered shale resources, the region is expected to emerge as one of the largest markets during the forecast period.

The Middle East and Africa (MEA) are expected to grow the fastest during the forecast period, while Europe is expected to gain a significant oilfield communications market share, following North America.

Numerous exploration activities and an increasing number of oil refineries in the region demonstrate market expansion.

The MEA region has several rigs, refineries, and exploration sites that use conventional control systems, which would boost the market growth even further.

The Middle East oilfield communications market, which has manufacturing costs far below current oil prices, has been heavily investing in the digital market in order to increase its crude recovery rate.

The European market is exhibiting incremental market growth and a significant increase in the implementation of oilfield communications technology, which is expected to positively impact the market opportunities over the next few years.
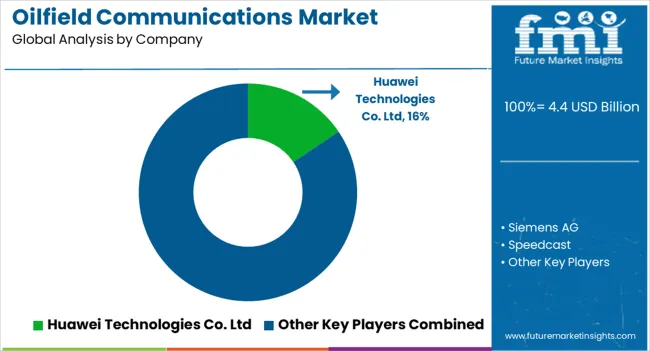
How Competition Influences the Oilfield Communications Market?

There are a few major players in the market who offer a full range of solutions. The market study report will provide a valuable insight with an emphasis on global market including some of the major players such Huawei Technologies Co., Ltd., Siemens AG, Speedcast, Weatherford International plc, Ceragon.

Oilfield communications manufacturers are pursuing various expansion strategies in order to increase their market share in the oilfield communications market. To deepen their penetration across lucrative market, the players employ a variety of market expansion strategies.

Product launches, collaborations with the market key players, partnerships, acquisitions, and the strengthening of regional and global distribution networks are examples of these strategies.

Recent Developments :

Partnership :

  • Siemens and Atos extended their partnership for another five years in July 2020. Siemens' digital goals in the areas of services modernization and digitalization, data-driven digital, cloud transformation, and cybersecurity are all being pushed forward.
  • Speedcast and Intelsat will renew their contract in July 2020. Speedcast's customer operations in the energy, maritime, cruise, mining, enterprise, media, humanitarian, and government sectors will benefit from Intelsat's global connectivity infrastructure and innovative service offerings under the new multi-year contract.

Installation :

  • During the COVID-19 lockdown in July 2020, Weatherford installed a liner hanger remotely on a Russian offshore platform. Installation of the liner hanger system, cementing products, and tubular running services was made possible thanks to remote training and monitoring procedures.

Product Launches :

  • Huawei launched the Contact Shield API for COVID-19 contact tracing in June 2020. It makes use of Bluetooth Low Energy (BLE) technology to detect nearby devices, exchange data with those devices, and keep track of contacts while keeping user information private.

Key Players

  • Huawei Technologies Co. Ltd
  • Siemens AG
  • Speedcast
  • Weatherford International plc
  • Ceragon

Key Segments

By Component :

  • Solutions
  • Services
  • Professional Services
  • Managed Services

By Communication Network :

  • VSAT Communication Network
  • TETRA Communication Network
  • Cellular Communication Network
  • Fiber Optic-based Communication Network
  • Microwave Communication Network

By Application :

  • Upstream
  • Midstream
  • Downstream

By Field Site :

  • Onshore
  • Offshore

By Region :

  • North America
  • Europe
  • Asia Pacific
  • Middle East and Africa
  • Latin America

Frequently Asked Questions

Which region holds high lucrativeness in the Oilfield Communications market?

The Asia Pacific region is projected to emerge as a lucrative market for oilfield communications.

What is the growth potential of the Oilfield Communications Market?

The growth potential of the oilfield communications market is 5.6% through 2033.

What limits the growth potential of the market?

The high cost of adoption is likely to limit market growth.

What is North America's expected share in 2023?

North America is likely to generate 25% revenue in 2023.

How big will the market be in 2033?

The market will generate revenue of US$ 6,876.3 million in 2033.

Table of Content

1. Executive Summary

    1.1. Global Market Outlook

    1.2. Demand-side Trends

    1.3. Supply-side Trends

    1.4. Technology Roadmap Analysis

    1.5. Analysis and Recommendations

2. Market Overview

    2.1. Market Coverage / Taxonomy

    2.2. Market Definition / Scope / Limitations

3. Market Background

    3.1. Market Dynamics

        3.1.1. Drivers

        3.1.2. Restraints

        3.1.3. Opportunity

        3.1.4. Trends

    3.2. Scenario Forecast

        3.2.1. Demand in Optimistic Scenario

        3.2.2. Demand in Likely Scenario

        3.2.3. Demand in Conservative Scenario

    3.3. Opportunity Map Analysis

    3.4. Investment Feasibility Matrix

    3.5. PESTLE and Porter’s Analysis

    3.6. Regulatory Landscape

        3.6.1. By Key Regions

        3.6.2. By Key Countries

    3.7. Regional Parent Market Outlook

4. Global Market Analysis 2018 to 2022 and Forecast, 2023 to 2033

    4.1. Historical Market Size Value (US$ Million) Analysis, 2018 to 2022

    4.2. Current and Future Market Size Value (US$ Million) Projections, 2023 to 2033

        4.2.1. Y-o-Y Growth Trend Analysis

        4.2.2. Absolute $ Opportunity Analysis

5. Global Market Analysis 2018 to 2022 and Forecast 2023 to 2033, By Component

    5.1. Introduction / Key Findings

    5.2. Historical Market Size Value (US$ Million) Analysis By Component, 2018 to 2022

    5.3. Current and Future Market Size Value (US$ Million) Analysis and Forecast By Component, 2023 to 2033

        5.3.1. Solutions

        5.3.2. Services

            5.3.2.1. Professional Services

            5.3.2.2. Managed Services

    5.4. Y-o-Y Growth Trend Analysis By Component, 2018 to 2022

    5.5. Absolute $ Opportunity Analysis By Component, 2023 to 2033

6. Global Market Analysis 2018 to 2022 and Forecast 2023 to 2033, By Communication Network

    6.1. Introduction / Key Findings

    6.2. Historical Market Size Value (US$ Million) Analysis By Communication Network, 2018 to 2022

    6.3. Current and Future Market Size Value (US$ Million) Analysis and Forecast By Communication Network, 2023 to 2033

        6.3.1. VSAT Communication Network

        6.3.2. TETRA Communication Network

        6.3.3. Cellular Communication Network

        6.3.4. Fiber Optic-based Communication Network

        6.3.5. Microwave Communication Network

    6.4. Y-o-Y Growth Trend Analysis By Communication Network, 2018 to 2022

    6.5. Absolute $ Opportunity Analysis By Communication Network, 2023 to 2033

7. Global Market Analysis 2018 to 2022 and Forecast 2023 to 2033, By Application

    7.1. Introduction / Key Findings

    7.2. Historical Market Size Value (US$ Million) Analysis By Application, 2018 to 2022

    7.3. Current and Future Market Size Value (US$ Million) Analysis and Forecast By Application, 2023 to 2033

        7.3.1. Upstream

        7.3.2. Midstream

        7.3.3. Downstream

    7.4. Y-o-Y Growth Trend Analysis By Application, 2018 to 2022

    7.5. Absolute $ Opportunity Analysis By Application, 2023 to 2033

8. Global Market Analysis 2018 to 2022 and Forecast 2023 to 2033, By Field Site

    8.1. Introduction / Key Findings

    8.2. Historical Market Size Value (US$ Million) Analysis By Field Site, 2018 to 2022

    8.3. Current and Future Market Size Value (US$ Million) Analysis and Forecast By Field Site, 2023 to 2033

        8.3.1. Onshore

        8.3.2. Offshore

    8.4. Y-o-Y Growth Trend Analysis By Field Site, 2018 to 2022

    8.5. Absolute $ Opportunity Analysis By Field Site, 2023 to 2033

9. Global Market Analysis 2018 to 2022 and Forecast 2023 to 2033, By Region

    9.1. Introduction

    9.2. Historical Market Size Value (US$ Million) Analysis By Region, 2018 to 2022

    9.3. Current Market Size Value (US$ Million) Analysis and Forecast By Region, 2023 to 2033

        9.3.1. North America

        9.3.2. Latin America

        9.3.3. Western Europe

        9.3.4. Eastern Europe

        9.3.5. South Asia and Pacific

        9.3.6. East Asia

        9.3.7. Middle East and Africa

    9.4. Market Attractiveness Analysis By Region

10. North America Market Analysis 2018 to 2022 and Forecast 2023 to 2033, By Country

    10.1. Historical Market Size Value (US$ Million) Trend Analysis By Market Taxonomy, 2018 to 2022

    10.2. Market Size Value (US$ Million) Forecast By Market Taxonomy, 2023 to 2033

        10.2.1. By Country

            10.2.1.1. USA

            10.2.1.2. Canada

        10.2.2. By Component

        10.2.3. By Communication Network

        10.2.4. By Application

        10.2.5. By Field Site

    10.3. Market Attractiveness Analysis

        10.3.1. By Country

        10.3.2. By Component

        10.3.3. By Communication Network

        10.3.4. By Application

        10.3.5. By Field Site

    10.4. Key Takeaways

11. Latin America Market Analysis 2018 to 2022 and Forecast 2023 to 2033, By Country

    11.1. Historical Market Size Value (US$ Million) Trend Analysis By Market Taxonomy, 2018 to 2022

    11.2. Market Size Value (US$ Million) Forecast By Market Taxonomy, 2023 to 2033

        11.2.1. By Country

            11.2.1.1. Brazil

            11.2.1.2. Mexico

            11.2.1.3. Rest of Latin America

        11.2.2. By Component

        11.2.3. By Communication Network

        11.2.4. By Application

        11.2.5. By Field Site

    11.3. Market Attractiveness Analysis

        11.3.1. By Country

        11.3.2. By Component

        11.3.3. By Communication Network

        11.3.4. By Application

        11.3.5. By Field Site

    11.4. Key Takeaways

12. Western Europe Market Analysis 2018 to 2022 and Forecast 2023 to 2033, By Country

    12.1. Historical Market Size Value (US$ Million) Trend Analysis By Market Taxonomy, 2018 to 2022

    12.2. Market Size Value (US$ Million) Forecast By Market Taxonomy, 2023 to 2033

        12.2.1. By Country

            12.2.1.1. Germany

            12.2.1.2. UK

            12.2.1.3. France

            12.2.1.4. Spain

            12.2.1.5. Italy

            12.2.1.6. Rest of Western Europe

        12.2.2. By Component

        12.2.3. By Communication Network

        12.2.4. By Application

        12.2.5. By Field Site

    12.3. Market Attractiveness Analysis

        12.3.1. By Country

        12.3.2. By Component

        12.3.3. By Communication Network

        12.3.4. By Application

        12.3.5. By Field Site

    12.4. Key Takeaways

13. Eastern Europe Market Analysis 2018 to 2022 and Forecast 2023 to 2033, By Country

    13.1. Historical Market Size Value (US$ Million) Trend Analysis By Market Taxonomy, 2018 to 2022

    13.2. Market Size Value (US$ Million) Forecast By Market Taxonomy, 2023 to 2033

        13.2.1. By Country

            13.2.1.1. Poland

            13.2.1.2. Russia

            13.2.1.3. Czech Republic

            13.2.1.4. Romania

            13.2.1.5. Rest of Eastern Europe

        13.2.2. By Component

        13.2.3. By Communication Network

        13.2.4. By Application

        13.2.5. By Field Site

    13.3. Market Attractiveness Analysis

        13.3.1. By Country

        13.3.2. By Component

        13.3.3. By Communication Network

        13.3.4. By Application

        13.3.5. By Field Site

    13.4. Key Takeaways

14. South Asia and Pacific Market Analysis 2018 to 2022 and Forecast 2023 to 2033, By Country

    14.1. Historical Market Size Value (US$ Million) Trend Analysis By Market Taxonomy, 2018 to 2022

    14.2. Market Size Value (US$ Million) Forecast By Market Taxonomy, 2023 to 2033

        14.2.1. By Country

            14.2.1.1. India

            14.2.1.2. Bangladesh

            14.2.1.3. Australia

            14.2.1.4. New Zealand

            14.2.1.5. Rest of South Asia and Pacific

        14.2.2. By Component

        14.2.3. By Communication Network

        14.2.4. By Application

        14.2.5. By Field Site

    14.3. Market Attractiveness Analysis

        14.3.1. By Country

        14.3.2. By Component

        14.3.3. By Communication Network

        14.3.4. By Application

        14.3.5. By Field Site

    14.4. Key Takeaways

15. East Asia Market Analysis 2018 to 2022 and Forecast 2023 to 2033, By Country

    15.1. Historical Market Size Value (US$ Million) Trend Analysis By Market Taxonomy, 2018 to 2022

    15.2. Market Size Value (US$ Million) Forecast By Market Taxonomy, 2023 to 2033

        15.2.1. By Country

            15.2.1.1. China

            15.2.1.2. Japan

            15.2.1.3. South Korea

        15.2.2. By Component

        15.2.3. By Communication Network

        15.2.4. By Application

        15.2.5. By Field Site

    15.3. Market Attractiveness Analysis

        15.3.1. By Country

        15.3.2. By Component

        15.3.3. By Communication Network

        15.3.4. By Application

        15.3.5. By Field Site

    15.4. Key Takeaways

16. Middle East and Africa Market Analysis 2018 to 2022 and Forecast 2023 to 2033, By Country

    16.1. Historical Market Size Value (US$ Million) Trend Analysis By Market Taxonomy, 2018 to 2022

    16.2. Market Size Value (US$ Million) Forecast By Market Taxonomy, 2023 to 2033

        16.2.1. By Country

            16.2.1.1. GCC Countries

            16.2.1.2. South Africa

            16.2.1.3. Israel

            16.2.1.4. Rest of MEA

        16.2.2. By Component

        16.2.3. By Communication Network

        16.2.4. By Application

        16.2.5. By Field Site

    16.3. Market Attractiveness Analysis

        16.3.1. By Country

        16.3.2. By Component

        16.3.3. By Communication Network

        16.3.4. By Application

        16.3.5. By Field Site

    16.4. Key Takeaways

17. Key Countries Market Analysis

    17.1. USA

        17.1.1. Pricing Analysis

        17.1.2. Market Share Analysis, 2022

            17.1.2.1. By Component

            17.1.2.2. By Communication Network

            17.1.2.3. By Application

            17.1.2.4. By Field Site

    17.2. Canada

        17.2.1. Pricing Analysis

        17.2.2. Market Share Analysis, 2022

            17.2.2.1. By Component

            17.2.2.2. By Communication Network

            17.2.2.3. By Application

            17.2.2.4. By Field Site

    17.3. Brazil

        17.3.1. Pricing Analysis

        17.3.2. Market Share Analysis, 2022

            17.3.2.1. By Component

            17.3.2.2. By Communication Network

            17.3.2.3. By Application

            17.3.2.4. By Field Site

    17.4. Mexico

        17.4.1. Pricing Analysis

        17.4.2. Market Share Analysis, 2022

            17.4.2.1. By Component

            17.4.2.2. By Communication Network

            17.4.2.3. By Application

            17.4.2.4. By Field Site

    17.5. Germany

        17.5.1. Pricing Analysis

        17.5.2. Market Share Analysis, 2022

            17.5.2.1. By Component

            17.5.2.2. By Communication Network

            17.5.2.3. By Application

            17.5.2.4. By Field Site

    17.6. UK

        17.6.1. Pricing Analysis

        17.6.2. Market Share Analysis, 2022

            17.6.2.1. By Component

            17.6.2.2. By Communication Network

            17.6.2.3. By Application

            17.6.2.4. By Field Site

    17.7. France

        17.7.1. Pricing Analysis

        17.7.2. Market Share Analysis, 2022

            17.7.2.1. By Component

            17.7.2.2. By Communication Network

            17.7.2.3. By Application

            17.7.2.4. By Field Site

    17.8. Spain

        17.8.1. Pricing Analysis

        17.8.2. Market Share Analysis, 2022

            17.8.2.1. By Component

            17.8.2.2. By Communication Network

            17.8.2.3. By Application

            17.8.2.4. By Field Site

    17.9. Italy

        17.9.1. Pricing Analysis

        17.9.2. Market Share Analysis, 2022

            17.9.2.1. By Component

            17.9.2.2. By Communication Network

            17.9.2.3. By Application

            17.9.2.4. By Field Site

    17.10. Poland

        17.10.1. Pricing Analysis

        17.10.2. Market Share Analysis, 2022

            17.10.2.1. By Component

            17.10.2.2. By Communication Network

            17.10.2.3. By Application

            17.10.2.4. By Field Site

    17.11. Russia

        17.11.1. Pricing Analysis

        17.11.2. Market Share Analysis, 2022

            17.11.2.1. By Component

            17.11.2.2. By Communication Network

            17.11.2.3. By Application

            17.11.2.4. By Field Site

    17.12. Czech Republic

        17.12.1. Pricing Analysis

        17.12.2. Market Share Analysis, 2022

            17.12.2.1. By Component

            17.12.2.2. By Communication Network

            17.12.2.3. By Application

            17.12.2.4. By Field Site

    17.13. Romania

        17.13.1. Pricing Analysis

        17.13.2. Market Share Analysis, 2022

            17.13.2.1. By Component

            17.13.2.2. By Communication Network

            17.13.2.3. By Application

            17.13.2.4. By Field Site

    17.14. India

        17.14.1. Pricing Analysis

        17.14.2. Market Share Analysis, 2022

            17.14.2.1. By Component

            17.14.2.2. By Communication Network

            17.14.2.3. By Application

            17.14.2.4. By Field Site

    17.15. Bangladesh

        17.15.1. Pricing Analysis

        17.15.2. Market Share Analysis, 2022

            17.15.2.1. By Component

            17.15.2.2. By Communication Network

            17.15.2.3. By Application

            17.15.2.4. By Field Site

    17.16. Australia

        17.16.1. Pricing Analysis

        17.16.2. Market Share Analysis, 2022

            17.16.2.1. By Component

            17.16.2.2. By Communication Network

            17.16.2.3. By Application

            17.16.2.4. By Field Site

    17.17. New Zealand

        17.17.1. Pricing Analysis

        17.17.2. Market Share Analysis, 2022

            17.17.2.1. By Component

            17.17.2.2. By Communication Network

            17.17.2.3. By Application

            17.17.2.4. By Field Site

    17.18. China

        17.18.1. Pricing Analysis

        17.18.2. Market Share Analysis, 2022

            17.18.2.1. By Component

            17.18.2.2. By Communication Network

            17.18.2.3. By Application

            17.18.2.4. By Field Site

    17.19. Japan

        17.19.1. Pricing Analysis

        17.19.2. Market Share Analysis, 2022

            17.19.2.1. By Component

            17.19.2.2. By Communication Network

            17.19.2.3. By Application

            17.19.2.4. By Field Site

    17.20. South Korea

        17.20.1. Pricing Analysis

        17.20.2. Market Share Analysis, 2022

            17.20.2.1. By Component

            17.20.2.2. By Communication Network

            17.20.2.3. By Application

            17.20.2.4. By Field Site

    17.21. GCC Countries

        17.21.1. Pricing Analysis

        17.21.2. Market Share Analysis, 2022

            17.21.2.1. By Component

            17.21.2.2. By Communication Network

            17.21.2.3. By Application

            17.21.2.4. By Field Site

    17.22. South Africa

        17.22.1. Pricing Analysis

        17.22.2. Market Share Analysis, 2022

            17.22.2.1. By Component

            17.22.2.2. By Communication Network

            17.22.2.3. By Application

            17.22.2.4. By Field Site

    17.23. Israel

        17.23.1. Pricing Analysis

        17.23.2. Market Share Analysis, 2022

            17.23.2.1. By Component

            17.23.2.2. By Communication Network

            17.23.2.3. By Application

            17.23.2.4. By Field Site

18. Market Structure Analysis

    18.1. Competition Dashboard

    18.2. Competition Benchmarking

    18.3. Market Share Analysis of Top Players

        18.3.1. By Regional

        18.3.2. By Component

        18.3.3. By Communication Network

        18.3.4. By Application

        18.3.5. By Field Site

19. Competition Analysis

    19.1. Competition Deep Dive

        19.1.1. Huawei Technologies Co. Ltd

            19.1.1.1. Overview

            19.1.1.2. Product Portfolio

            19.1.1.3. Profitability by Market Segments

            19.1.1.4. Sales Footprint

            19.1.1.5. Strategy Overview

                19.1.1.5.1. Marketing Strategy

        19.1.2. Siemens AG

            19.1.2.1. Overview

            19.1.2.2. Product Portfolio

            19.1.2.3. Profitability by Market Segments

            19.1.2.4. Sales Footprint

            19.1.2.5. Strategy Overview

                19.1.2.5.1. Marketing Strategy

        19.1.3. Speedcast

            19.1.3.1. Overview

            19.1.3.2. Product Portfolio

            19.1.3.3. Profitability by Market Segments

            19.1.3.4. Sales Footprint

            19.1.3.5. Strategy Overview

                19.1.3.5.1. Marketing Strategy

        19.1.4. Weatherford International plc

            19.1.4.1. Overview

            19.1.4.2. Product Portfolio

            19.1.4.3. Profitability by Market Segments

            19.1.4.4. Sales Footprint

            19.1.4.5. Strategy Overview

                19.1.4.5.1. Marketing Strategy

        19.1.5. Ceragon

            19.1.5.1. Overview

            19.1.5.2. Product Portfolio

            19.1.5.3. Profitability by Market Segments

            19.1.5.4. Sales Footprint

            19.1.5.5. Strategy Overview

                19.1.5.5.1. Marketing Strategy

        19.1.6. Honeywell International Inc.

            19.1.6.1. Overview

            19.1.6.2. Product Portfolio

            19.1.6.3. Profitability by Market Segments

            19.1.6.4. Sales Footprint

            19.1.6.5. Strategy Overview

                19.1.6.5.1. Marketing Strategy

        19.1.7. Commtel

            19.1.7.1. Overview

            19.1.7.2. Product Portfolio

            19.1.7.3. Profitability by Market Segments

            19.1.7.4. Sales Footprint

            19.1.7.5. Strategy Overview

                19.1.7.5.1. Marketing Strategy

        19.1.8. Tait Communication

            19.1.8.1. Overview

            19.1.8.2. Product Portfolio

            19.1.8.3. Profitability by Market Segments

            19.1.8.4. Sales Footprint

            19.1.8.5. Strategy Overview

                19.1.8.5.1. Marketing Strategy

        19.1.9. Redline Communicatio

            19.1.9.1. Overview

            19.1.9.2. Product Portfolio

            19.1.9.3. Profitability by Market Segments

            19.1.9.4. Sales Footprint

            19.1.9.5. Strategy Overview

                19.1.9.5.1. Marketing Strategy

        19.1.10. RigNet, In

            19.1.10.1. Overview

            19.1.10.2. Product Portfolio

            19.1.10.3. Profitability by Market Segments

            19.1.10.4. Sales Footprint

            19.1.10.5. Strategy Overview

                19.1.10.5.1. Marketing Strategy

20. Assumptions & Acronyms Used

21. Research Methodology

List of Tables

Table 01: Global Market Value (US$ Million) Forecast by Region, 2018 to 2033

Table 02: Global Market Value (US$ Million) Forecast by Component, 2018 to 2033

Table 03: Global Market Value (US$ Million) Forecast by Communication Network, 2018 to 2033

Table 04: Global Market Value (US$ Million) Forecast by Application, 2018 to 2033

Table 05: Global Market Value (US$ Million) Forecast by Field Site, 2018 to 2033

Table 06: North America Market Value (US$ Million) Forecast by Country, 2018 to 2033

Table 07: North America Market Value (US$ Million) Forecast by Component, 2018 to 2033

Table 08: North America Market Value (US$ Million) Forecast by Communication Network, 2018 to 2033

Table 09: North America Market Value (US$ Million) Forecast by Application, 2018 to 2033

Table 10: North America Market Value (US$ Million) Forecast by Field Site, 2018 to 2033

Table 11: Latin America Market Value (US$ Million) Forecast by Country, 2018 to 2033

Table 12: Latin America Market Value (US$ Million) Forecast by Component, 2018 to 2033

Table 13: Latin America Market Value (US$ Million) Forecast by Communication Network, 2018 to 2033

Table 14: Latin America Market Value (US$ Million) Forecast by Application, 2018 to 2033

Table 15: Latin America Market Value (US$ Million) Forecast by Field Site, 2018 to 2033

Table 16: Western Europe Market Value (US$ Million) Forecast by Country, 2018 to 2033

Table 17: Western Europe Market Value (US$ Million) Forecast by Component, 2018 to 2033

Table 18: Western Europe Market Value (US$ Million) Forecast by Communication Network, 2018 to 2033

Table 19: Western Europe Market Value (US$ Million) Forecast by Application, 2018 to 2033

Table 20: Western Europe Market Value (US$ Million) Forecast by Field Site, 2018 to 2033

Table 21: Eastern Europe Market Value (US$ Million) Forecast by Country, 2018 to 2033

Table 22: Eastern Europe Market Value (US$ Million) Forecast by Component, 2018 to 2033

Table 23: Eastern Europe Market Value (US$ Million) Forecast by Communication Network, 2018 to 2033

Table 24: Eastern Europe Market Value (US$ Million) Forecast by Application, 2018 to 2033

Table 25: Eastern Europe Market Value (US$ Million) Forecast by Field Site, 2018 to 2033

Table 26: South Asia and Pacific Market Value (US$ Million) Forecast by Country, 2018 to 2033

Table 27: South Asia and Pacific Market Value (US$ Million) Forecast by Component, 2018 to 2033

Table 28: South Asia and Pacific Market Value (US$ Million) Forecast by Communication Network, 2018 to 2033

Table 29: South Asia and Pacific Market Value (US$ Million) Forecast by Application, 2018 to 2033

Table 30: South Asia and Pacific Market Value (US$ Million) Forecast by Field Site, 2018 to 2033

Table 31: East Asia Market Value (US$ Million) Forecast by Country, 2018 to 2033

Table 32: East Asia Market Value (US$ Million) Forecast by Component, 2018 to 2033

Table 33: East Asia Market Value (US$ Million) Forecast by Communication Network, 2018 to 2033

Table 34: East Asia Market Value (US$ Million) Forecast by Application, 2018 to 2033

Table 35: East Asia Market Value (US$ Million) Forecast by Field Site, 2018 to 2033

Table 36: Middle East and Africa Market Value (US$ Million) Forecast by Country, 2018 to 2033

Table 37: Middle East and Africa Market Value (US$ Million) Forecast by Component, 2018 to 2033

Table 38: Middle East and Africa Market Value (US$ Million) Forecast by Communication Network, 2018 to 2033

Table 39: Middle East and Africa Market Value (US$ Million) Forecast by Application, 2018 to 2033

Table 40: Middle East and Africa Market Value (US$ Million) Forecast by Field Site, 2018 to 2033

List of Charts

Figure 01: Global Market Value (US$ Million) by Component, 2023 to 2033

Figure 02: Global Market Value (US$ Million) by Communication Network, 2023 to 2033

Figure 03: Global Market Value (US$ Million) by Application, 2023 to 2033

Figure 04: Global Market Value (US$ Million) by Field Site, 2023 to 2033

Figure 05: Global Market Value (US$ Million) by Region, 2023 to 2033

Figure 06: Global Market Value (US$ Million) Analysis by Region, 2018 to 2033

Figure 07: Global Market Value Share (%) and BPS Analysis by Region, 2023 to 2033

Figure 08: Global Market Y-o-Y Growth (%) Projections by Region, 2023 to 2033

Figure 09: Global Market Value (US$ Million) Analysis by Component, 2018 to 2033

Figure 10: Global Market Value Share (%) and BPS Analysis by Component, 2023 to 2033

Figure 11: Global Market Y-o-Y Growth (%) Projections by Component, 2023 to 2033

Figure 12: Global Market Value (US$ Million) Analysis by Communication Network, 2018 to 2033

Figure 13: Global Market Value Share (%) and BPS Analysis by Communication Network, 2023 to 2033

Figure 14: Global Market Y-o-Y Growth (%) Projections by Communication Network, 2023 to 2033

Figure 15: Global Market Value (US$ Million) Analysis by Application, 2018 to 2033

Figure 16: Global Market Value Share (%) and BPS Analysis by Application, 2023 to 2033

Figure 17: Global Market Y-o-Y Growth (%) Projections by Application, 2023 to 2033

Figure 18: Global Market Value (US$ Million) Analysis by Field Site, 2018 to 2033

Figure 19: Global Market Value Share (%) and BPS Analysis by Field Site, 2023 to 2033

Figure 20: Global Market Y-o-Y Growth (%) Projections by Field Site, 2023 to 2033

Figure 21: Global Market Attractiveness by Component, 2023 to 2033

Figure 22: Global Market Attractiveness by Communication Network, 2023 to 2033

Figure 23: Global Market Attractiveness by Application, 2023 to 2033

Figure 24: Global Market Attractiveness by Field Site, 2023 to 2033

Figure 25: Global Market Attractiveness by Region, 2023 to 2033

Figure 26: North America Market Value (US$ Million) by Component, 2023 to 2033

Figure 27: North America Market Value (US$ Million) by Communication Network, 2023 to 2033

Figure 28: North America Market Value (US$ Million) by Application, 2023 to 2033

Figure 29: North America Market Value (US$ Million) by Field Site, 2023 to 2033

Figure 30: North America Market Value (US$ Million) by Country, 2023 to 2033

Figure 31: North America Market Value (US$ Million) Analysis by Country, 2018 to 2033

Figure 32: North America Market Value Share (%) and BPS Analysis by Country, 2023 to 2033

Figure 33: North America Market Y-o-Y Growth (%) Projections by Country, 2023 to 2033

Figure 34: North America Market Value (US$ Million) Analysis by Component, 2018 to 2033

Figure 35: North America Market Value Share (%) and BPS Analysis by Component, 2023 to 2033

Figure 36: North America Market Y-o-Y Growth (%) Projections by Component, 2023 to 2033

Figure 37: North America Market Value (US$ Million) Analysis by Communication Network, 2018 to 2033

Figure 38: North America Market Value Share (%) and BPS Analysis by Communication Network, 2023 to 2033

Figure 39: North America Market Y-o-Y Growth (%) Projections by Communication Network, 2023 to 2033

Figure 40: North America Market Value (US$ Million) Analysis by Application, 2018 to 2033

Figure 41: North America Market Value Share (%) and BPS Analysis by Application, 2023 to 2033

Figure 42: North America Market Y-o-Y Growth (%) Projections by Application, 2023 to 2033

Figure 43: North America Market Value (US$ Million) Analysis by Field Site, 2018 to 2033

Figure 44: North America Market Value Share (%) and BPS Analysis by Field Site, 2023 to 2033

Figure 45: North America Market Y-o-Y Growth (%) Projections by Field Site, 2023 to 2033

Figure 46: North America Market Attractiveness by Component, 2023 to 2033

Figure 47: North America Market Attractiveness by Communication Network, 2023 to 2033

Figure 48: North America Market Attractiveness by Application, 2023 to 2033

Figure 49: North America Market Attractiveness by Field Site, 2023 to 2033

Figure 50: North America Market Attractiveness by Country, 2023 to 2033

Figure 51: Latin America Market Value (US$ Million) by Component, 2023 to 2033

Figure 52: Latin America Market Value (US$ Million) by Communication Network, 2023 to 2033

Figure 53: Latin America Market Value (US$ Million) by Application, 2023 to 2033

Figure 54: Latin America Market Value (US$ Million) by Field Site, 2023 to 2033

Figure 55: Latin America Market Value (US$ Million) by Country, 2023 to 2033

Figure 56: Latin America Market Value (US$ Million) Analysis by Country, 2018 to 2033

Figure 57: Latin America Market Value Share (%) and BPS Analysis by Country, 2023 to 2033

Figure 58: Latin America Market Y-o-Y Growth (%) Projections by Country, 2023 to 2033

Figure 59: Latin America Market Value (US$ Million) Analysis by Component, 2018 to 2033

Figure 60: Latin America Market Value Share (%) and BPS Analysis by Component, 2023 to 2033

Figure 61: Latin America Market Y-o-Y Growth (%) Projections by Component, 2023 to 2033

Figure 62: Latin America Market Value (US$ Million) Analysis by Communication Network, 2018 to 2033

Figure 63: Latin America Market Value Share (%) and BPS Analysis by Communication Network, 2023 to 2033

Figure 64: Latin America Market Y-o-Y Growth (%) Projections by Communication Network, 2023 to 2033

Figure 65: Latin America Market Value (US$ Million) Analysis by Application, 2018 to 2033

Figure 66: Latin America Market Value Share (%) and BPS Analysis by Application, 2023 to 2033

Figure 67: Latin America Market Y-o-Y Growth (%) Projections by Application, 2023 to 2033

Figure 68: Latin America Market Value (US$ Million) Analysis by Field Site, 2018 to 2033

Figure 69: Latin America Market Value Share (%) and BPS Analysis by Field Site, 2023 to 2033

Figure 70: Latin America Market Y-o-Y Growth (%) Projections by Field Site, 2023 to 2033

Figure 71: Latin America Market Attractiveness by Component, 2023 to 2033

Figure 72: Latin America Market Attractiveness by Communication Network, 2023 to 2033

Figure 73: Latin America Market Attractiveness by Application, 2023 to 2033

Figure 74: Latin America Market Attractiveness by Field Site, 2023 to 2033

Figure 75: Latin America Market Attractiveness by Country, 2023 to 2033

Figure 76: Western Europe Market Value (US$ Million) by Component, 2023 to 2033

Figure 77: Western Europe Market Value (US$ Million) by Communication Network, 2023 to 2033

Figure 78: Western Europe Market Value (US$ Million) by Application, 2023 to 2033

Figure 79: Western Europe Market Value (US$ Million) by Field Site, 2023 to 2033

Figure 80: Western Europe Market Value (US$ Million) by Country, 2023 to 2033

Figure 81: Western Europe Market Value (US$ Million) Analysis by Country, 2018 to 2033

Figure 82: Western Europe Market Value Share (%) and BPS Analysis by Country, 2023 to 2033

Figure 83: Western Europe Market Y-o-Y Growth (%) Projections by Country, 2023 to 2033

Figure 84: Western Europe Market Value (US$ Million) Analysis by Component, 2018 to 2033

Figure 85: Western Europe Market Value Share (%) and BPS Analysis by Component, 2023 to 2033

Figure 86: Western Europe Market Y-o-Y Growth (%) Projections by Component, 2023 to 2033

Figure 87: Western Europe Market Value (US$ Million) Analysis by Communication Network, 2018 to 2033

Figure 88: Western Europe Market Value Share (%) and BPS Analysis by Communication Network, 2023 to 2033

Figure 89: Western Europe Market Y-o-Y Growth (%) Projections by Communication Network, 2023 to 2033

Figure 90: Western Europe Market Value (US$ Million) Analysis by Application, 2018 to 2033

Figure 91: Western Europe Market Value Share (%) and BPS Analysis by Application, 2023 to 2033

Figure 92: Western Europe Market Y-o-Y Growth (%) Projections by Application, 2023 to 2033

Figure 93: Western Europe Market Value (US$ Million) Analysis by Field Site, 2018 to 2033

Figure 94: Western Europe Market Value Share (%) and BPS Analysis by Field Site, 2023 to 2033

Figure 95: Western Europe Market Y-o-Y Growth (%) Projections by Field Site, 2023 to 2033

Figure 96: Western Europe Market Attractiveness by Component, 2023 to 2033

Figure 97: Western Europe Market Attractiveness by Communication Network, 2023 to 2033

Figure 98: Western Europe Market Attractiveness by Application, 2023 to 2033

Figure 99: Western Europe Market Attractiveness by Field Site, 2023 to 2033

Figure 100: Western Europe Market Attractiveness by Country, 2023 to 2033

Figure 101: Eastern Europe Market Value (US$ Million) by Component, 2023 to 2033

Figure 102: Eastern Europe Market Value (US$ Million) by Communication Network, 2023 to 2033

Figure 103: Eastern Europe Market Value (US$ Million) by Application, 2023 to 2033

Figure 104: Eastern Europe Market Value (US$ Million) by Field Site, 2023 to 2033

Figure 105: Eastern Europe Market Value (US$ Million) by Country, 2023 to 2033

Figure 106: Eastern Europe Market Value (US$ Million) Analysis by Country, 2018 to 2033

Figure 107: Eastern Europe Market Value Share (%) and BPS Analysis by Country, 2023 to 2033

Figure 108: Eastern Europe Market Y-o-Y Growth (%) Projections by Country, 2023 to 2033

Figure 109: Eastern Europe Market Value (US$ Million) Analysis by Component, 2018 to 2033

Figure 110: Eastern Europe Market Value Share (%) and BPS Analysis by Component, 2023 to 2033

Figure 111: Eastern Europe Market Y-o-Y Growth (%) Projections by Component, 2023 to 2033

Figure 112: Eastern Europe Market Value (US$ Million) Analysis by Communication Network, 2018 to 2033

Figure 113: Eastern Europe Market Value Share (%) and BPS Analysis by Communication Network, 2023 to 2033

Figure 114: Eastern Europe Market Y-o-Y Growth (%) Projections by Communication Network, 2023 to 2033

Figure 115: Eastern Europe Market Value (US$ Million) Analysis by Application, 2018 to 2033

Figure 116: Eastern Europe Market Value Share (%) and BPS Analysis by Application, 2023 to 2033

Figure 117: Eastern Europe Market Y-o-Y Growth (%) Projections by Application, 2023 to 2033

Figure 118: Eastern Europe Market Value (US$ Million) Analysis by Field Site, 2018 to 2033

Figure 119: Eastern Europe Market Value Share (%) and BPS Analysis by Field Site, 2023 to 2033

Figure 120: Eastern Europe Market Y-o-Y Growth (%) Projections by Field Site, 2023 to 2033

Figure 121: Eastern Europe Market Attractiveness by Component, 2023 to 2033

Figure 122: Eastern Europe Market Attractiveness by Communication Network, 2023 to 2033

Figure 123: Eastern Europe Market Attractiveness by Application, 2023 to 2033

Figure 124: Eastern Europe Market Attractiveness by Field Site, 2023 to 2033

Figure 125: Eastern Europe Market Attractiveness by Country, 2023 to 2033

Figure 126: South Asia and Pacific Market Value (US$ Million) by Component, 2023 to 2033

Figure 127: South Asia and Pacific Market Value (US$ Million) by Communication Network, 2023 to 2033

Figure 128: South Asia and Pacific Market Value (US$ Million) by Application, 2023 to 2033

Figure 129: South Asia and Pacific Market Value (US$ Million) by Field Site, 2023 to 2033

Figure 130: South Asia and Pacific Market Value (US$ Million) by Country, 2023 to 2033

Figure 131: South Asia and Pacific Market Value (US$ Million) Analysis by Country, 2018 to 2033

Figure 132: South Asia and Pacific Market Value Share (%) and BPS Analysis by Country, 2023 to 2033

Figure 133: South Asia and Pacific Market Y-o-Y Growth (%) Projections by Country, 2023 to 2033

Figure 134: South Asia and Pacific Market Value (US$ Million) Analysis by Component, 2018 to 2033

Figure 135: South Asia and Pacific Market Value Share (%) and BPS Analysis by Component, 2023 to 2033

Figure 136: South Asia and Pacific Market Y-o-Y Growth (%) Projections by Component, 2023 to 2033

Figure 137: South Asia and Pacific Market Value (US$ Million) Analysis by Communication Network, 2018 to 2033

Figure 138: South Asia and Pacific Market Value Share (%) and BPS Analysis by Communication Network, 2023 to 2033

Figure 139: South Asia and Pacific Market Y-o-Y Growth (%) Projections by Communication Network, 2023 to 2033

Figure 140: South Asia and Pacific Market Value (US$ Million) Analysis by Application, 2018 to 2033

Figure 141: South Asia and Pacific Market Value Share (%) and BPS Analysis by Application, 2023 to 2033

Figure 142: South Asia and Pacific Market Y-o-Y Growth (%) Projections by Application, 2023 to 2033

Figure 143: South Asia and Pacific Market Value (US$ Million) Analysis by Field Site, 2018 to 2033

Figure 144: South Asia and Pacific Market Value Share (%) and BPS Analysis by Field Site, 2023 to 2033

Figure 145: South Asia and Pacific Market Y-o-Y Growth (%) Projections by Field Site, 2023 to 2033

Figure 146: South Asia and Pacific Market Attractiveness by Component, 2023 to 2033

Figure 147: South Asia and Pacific Market Attractiveness by Communication Network, 2023 to 2033

Figure 148: South Asia and Pacific Market Attractiveness by Application, 2023 to 2033

Figure 149: South Asia and Pacific Market Attractiveness by Field Site, 2023 to 2033

Figure 150: South Asia and Pacific Market Attractiveness by Country, 2023 to 2033

Figure 151: East Asia Market Value (US$ Million) by Component, 2023 to 2033

Figure 152: East Asia Market Value (US$ Million) by Communication Network, 2023 to 2033

Figure 153: East Asia Market Value (US$ Million) by Application, 2023 to 2033

Figure 154: East Asia Market Value (US$ Million) by Field Site, 2023 to 2033

Figure 155: East Asia Market Value (US$ Million) by Country, 2023 to 2033

Figure 156: East Asia Market Value (US$ Million) Analysis by Country, 2018 to 2033

Figure 157: East Asia Market Value Share (%) and BPS Analysis by Country, 2023 to 2033

Figure 158: East Asia Market Y-o-Y Growth (%) Projections by Country, 2023 to 2033

Figure 159: East Asia Market Value (US$ Million) Analysis by Component, 2018 to 2033

Figure 160: East Asia Market Value Share (%) and BPS Analysis by Component, 2023 to 2033

Figure 161: East Asia Market Y-o-Y Growth (%) Projections by Component, 2023 to 2033

Figure 162: East Asia Market Value (US$ Million) Analysis by Communication Network, 2018 to 2033

Figure 163: East Asia Market Value Share (%) and BPS Analysis by Communication Network, 2023 to 2033

Figure 164: East Asia Market Y-o-Y Growth (%) Projections by Communication Network, 2023 to 2033

Figure 165: East Asia Market Value (US$ Million) Analysis by Application, 2018 to 2033

Figure 166: East Asia Market Value Share (%) and BPS Analysis by Application, 2023 to 2033

Figure 167: East Asia Market Y-o-Y Growth (%) Projections by Application, 2023 to 2033

Figure 168: East Asia Market Value (US$ Million) Analysis by Field Site, 2018 to 2033

Figure 169: East Asia Market Value Share (%) and BPS Analysis by Field Site, 2023 to 2033

Figure 170: East Asia Market Y-o-Y Growth (%) Projections by Field Site, 2023 to 2033

Figure 171: East Asia Market Attractiveness by Component, 2023 to 2033

Figure 172: East Asia Market Attractiveness by Communication Network, 2023 to 2033

Figure 173: East Asia Market Attractiveness by Application, 2023 to 2033

Figure 174: East Asia Market Attractiveness by Field Site, 2023 to 2033

Figure 175: East Asia Market Attractiveness by Country, 2023 to 2033

Figure 176: Middle East and Africa Market Value (US$ Million) by Component, 2023 to 2033

Figure 177: Middle East and Africa Market Value (US$ Million) by Communication Network, 2023 to 2033

Figure 178: Middle East and Africa Market Value (US$ Million) by Application, 2023 to 2033

Figure 179: Middle East and Africa Market Value (US$ Million) by Field Site, 2023 to 2033

Figure 180: Middle East and Africa Market Value (US$ Million) by Country, 2023 to 2033

Figure 181: Middle East and Africa Market Value (US$ Million) Analysis by Country, 2018 to 2033

Figure 182: Middle East and Africa Market Value Share (%) and BPS Analysis by Country, 2023 to 2033

Figure 183: Middle East and Africa Market Y-o-Y Growth (%) Projections by Country, 2023 to 2033

Figure 184: Middle East and Africa Market Value (US$ Million) Analysis by Component, 2018 to 2033

Figure 185: Middle East and Africa Market Value Share (%) and BPS Analysis by Component, 2023 to 2033

Figure 186: Middle East and Africa Market Y-o-Y Growth (%) Projections by Component, 2023 to 2033

Figure 187: Middle East and Africa Market Value (US$ Million) Analysis by Communication Network, 2018 to 2033

Figure 188: Middle East and Africa Market Value Share (%) and BPS Analysis by Communication Network, 2023 to 2033

Figure 189: Middle East and Africa Market Y-o-Y Growth (%) Projections by Communication Network, 2023 to 2033

Figure 190: Middle East and Africa Market Value (US$ Million) Analysis by Application, 2018 to 2033

Figure 191: Middle East and Africa Market Value Share (%) and BPS Analysis by Application, 2023 to 2033

Figure 192: Middle East and Africa Market Y-o-Y Growth (%) Projections by Application, 2023 to 2033

Figure 193: Middle East and Africa Market Value (US$ Million) Analysis by Field Site, 2018 to 2033

Figure 194: Middle East and Africa Market Value Share (%) and BPS Analysis by Field Site, 2023 to 2033

Figure 195: Middle East and Africa Market Y-o-Y Growth (%) Projections by Field Site, 2023 to 2033

Figure 196: Middle East and Africa Market Attractiveness by Component, 2023 to 2033

Figure 197: Middle East and Africa Market Attractiveness by Communication Network, 2023 to 2033

Figure 198: Middle East and Africa Market Attractiveness by Application, 2023 to 2033

Figure 199: Middle East and Africa Market Attractiveness by Field Site, 2023 to 2033

Figure 200: Middle East and Africa Market Attractiveness by Country, 2023 to 2033

Recommendations

Chemicals & Materials

Oilfield Chemicals Market

Published : July 2023

Explore Technology Insights

View Reports

Oilfield Communications Market