Banding Machine Market Size and Share Forecast Outlook 2025 to 2035

The global banding machine market is expected to cross USD 8.1 billion by 2035, up from USD 5.3 billion in 2025, reflecting a steady CAGR of 4.2% over the decade. This growth is being shaped by manufacturers’ shift toward automation for improved operational efficiency and reduced packaging waste. High demand from the food & beverage industry and increasing integration of automatic banding systems across production lines are reinforcing the role of banding equipment in modern industrial packaging strategies.

This growth has been attributed to the rising need for efficient and eco-friendly packaging solutions in sectors such as food and beverage, pharmaceuticals, logistics, and e-commerce. The increasing adoption of banding machines for their ability to ensure product safety, prevent contamination, and reduce material usage has further propelled the market's expansion.

Additionally, advancements in automation and the integration of smart technologies have enhanced the efficiency and precision of banding processes, contributing to the market's growth.

In April 2025, ATS-Tanner showcases banding solutions at Empack 2025. “The main current trend at the moment is reducing plastic to reach sustainability goals. We are seeing banding expand beyond traditional graphic products and brochures to industries like F&B and laundry to get rid of plastic bags.”

“We have developed the ATS US-3000, the most advanced banding machine on the market,” Johan Van Veen, the company’s national sales manager for the Netherlands says. “It features an easy operating system that allows any operator to work with this machine. The machine is ready for integration into fully automated production lines.”
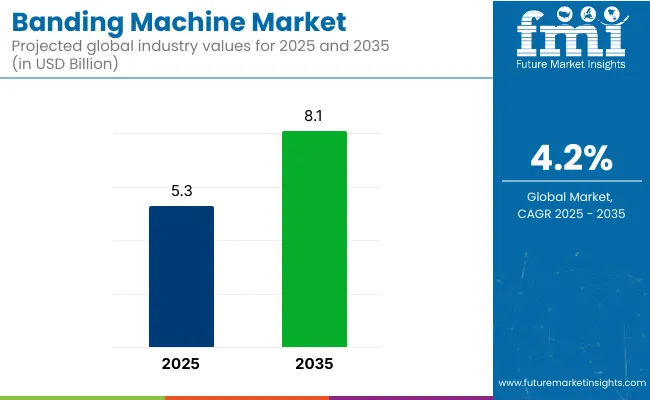
Banding Machine Market

Metric Value
Industry Size (2025E) USD 5.3 Billion
Industry Value (2035F) USD 8.1 Billion
CAGR (2025 to 2035) 4.2%

The shift towards environmentally friendly solutions has significantly influenced the banding machine market. Manufacturers have been focusing on developing machines that are energy-efficient, compatible with recyclable materials, and offer excellent sealing properties. Innovations include the integration of advanced materials, modular designs, and the use of natural additives to enhance machine performance.

These advancements align with global sustainability goals and regulatory requirements, making banding machines an attractive option for environmentally conscious industries. Additionally, the development of automated manufacturing processes has enhanced efficiency and consistency in production, further driving market growth.

The banding machine market is poised for significant growth, driven by increasing demand in food and beverage, pharmaceuticals, logistics, and e-commerce packaging industries.

Companies investing in sustainable materials, innovative designs, and eco-friendly production processes are expected to gain a competitive edge. As global supply chains expand and environmental regulations become more stringent, the adoption of banding machines is anticipated to rise, offering cost-effective and eco-friendly solutions for packaging.

Furthermore, the integration of smart technologies and automation in packaging applications is expected to enhance operational efficiency and meet the evolving needs of various industries.

Analyzing Banding Machine Market by Top Investment Segment

The market is segmented based on operation, strapping speed, end use, and region. By operation, the market is divided into semi-automatic and automatic machines. In terms of strapping speed, the market is categorized into 1.0-1.5 sec/straps, 1.6-2.0 sec/straps, and above 2.0 sec/straps.

By end use, the market includes food & beverage, e-commerce, pharmaceuticals, electrical & electronics, household, shipping & logistics, and printing sectors. Regionally, the market is analyzed across North America, Latin America, Europe, South Asia, East Asia, the Middle East & Africa, and Oceania.

Automatic Banding Machines Expected to Dominate Due to Speed, Precision, and Labor Efficiency

The automatic segment is projected to account for 64.7% of the global banding machine market by 2025, as large-scale production environments have increasingly required high-speed, low-intervention systems for bundling, securing, and branding packaged items.

Automatic machines have been integrated with conveyor lines and smart controls to ensure consistency, reduce manual handling, and increase output in food, pharma, and logistics sectors.

Servo-driven motors, programmable logic controllers (PLCs), and touchscreens have been incorporated to allow for custom tension settings, barcode printing, and seamless switching between product formats. Their deployment has been supported by reduced energy consumption, material optimization, and minimal downtime during continuous operations.

In industries with stringent hygiene and traceability requirements, automatic banding systems have been favored for offering tamper-evidence, brand labeling, and compliance with safety standards. As manufacturers pursue automation, traceability, and cost efficiency, automatic machines are expected to remain the primary solution for high-throughput packaging needs.

Food & Beverage Industry Gains Traction Owing to Portion Packaging, Branding, and Compliance Needs

The food & beverage segment is expected to account for 38.5% of the banding machine market by 2025, as increasing demand for multi-pack bundling, shelf-ready packaging, and brand labeling has driven adoption across bakeries, dairy, meat, and beverage industries. Banding machines have been used to bundle trays, cups, pouches, and cartons while preserving product visibility and ventilation.

Compliance with food safety regulations and cleanroom standards has made non-adhesive paper and film banding attractive in fresh and frozen food lines. Banding systems have been integrated with inline printers to enable real-time coding, QR tagging, and expiration date labeling, meeting traceability mandates.

Reduced use of shrink wrap and adhesive tapes has further promoted banding machines as a sustainable and cost-efficient solution. As demand rises for tamper-evident, recyclable, and visually appealing food packaging, the food & beverage sector is expected to retain dominance in the banding machine market.

Challenges and Opportunities

Challenge

High Costs and Regulatory Complexities

The Banding Machine Market encounters specific obstacles because of its expensive manufacturing procedures and necessary compliance requirements and supply network limitations. The exact engineering requirements and robust elements for banding machines result in elevated production expenses.

The Banding Machines Market needs to comply with multiple regulatory requirements which involve industrial automation standards alongside workplace safety regulations and packaging material certification standards under CE certification and ISO standards. Affordable prices require businesses to implement cost-effective production methods and energy-efficient designs and advanced automated systems.

Market Saturation and Technological Adaptation

A substantial number of manufacturers throughout different regions and globally are active in this competitive banding machine market sector. The high market concentration has produced extreme price competition which reduces available earning potential for manufacturers.

The shift towards automated packaging systems alongside Industry 4.0 implementations forces companies to invest in traditional machine upgrades that may be expensive. Manufacturers who want to maintain their market position must develop technological improvements and personalized solutions with smart machine capabilities that follow changing packaging requirements.

Opportunity

Growing Demand for Automated and Sustainable Packaging Solutions

Manufacturers of banding machines benefit from increasing solutions requirements for automated packaging operations across the logistics sector. The food & beverage sector together with pharmaceuticals and logistics industries choose automated banding processes to reach higher efficiency levels and decrease operating costs and improve product safety standards.

The rise of sustainability initiatives produces market demand for environment-friendly banding solutions which reduce plastic waste during operations. Organizations that use sustainable packaging materials and efficient equipment and automation features will dominate the expanding market sector.

Advancements in Smart Banding Machines and IoT Integration

Modern banding machines can transform the industry because of their IoT-enabled monitoring features and AI-driven maintenance systems which combine with real-time data analytics capabilities. Smart sensors coupled with cloud-based monitoring systems boost machine performance and decrease maintenance periods while providing better operational data analysis results.

The growth of e-commerce and just-in-time manufacturing activities requires precise and high-speed banding solutions for market expansion. The Banding Machine Market will experience its next major growth period from companies who focus on digital transformation alongside AI-powered diagnostics and connectivity features.
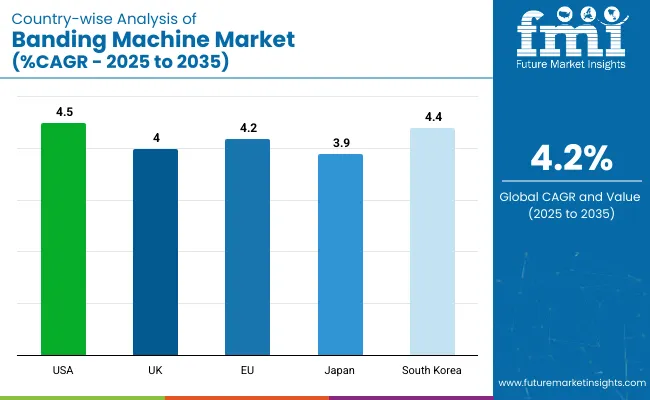
Country-wise Market Outlook: Banding Machine Market

Banding Machine Market Country Wise

United States

Market Insights Report provides a comprehensive analysis of the United States banding machine market, exploring industry trends, growth drivers, and competitive landscape. Increasing e-commerce and retail packaging are propelling market growth.

Some of the advanced features of modern banding machines that manufacturers are emphasizing include adjustable banding tension, high-quality and eco-friendly banding materials, and smart automation to facilitate high-throughput operations.

Moreover, consumer movement toward sustainable and minimal packaging solutions is driving the businesses to use banding machines instead of traditional packaging methods.

Country CAGR (2025 to 2035)
USA 4.5%

United Kingdom

The UK is seen steady growth of the banding machine market across several industries searching for cost-effective and eco-friendly packaging solutions. Growing demand for disposable banding materials such as paper and biodegradable is paving way for market growth.

Due to increasing demand for accuracy and speed during the banding process in the pharmaceutical and food industries, there is an increasing trend towards more OEE efficient machine automation and at the same time digital integration. Furthermore, stringent government regulations mandating the use of sustainable packaging are forcing the manufacturers to adopt advanced banding.

Country CAGR (2025 to 2035)
UK 4.0%

European Union

The demand for the banding machines in the EU is high, and the market is growing fast in Germany, France and Italy. Rigid government regulations towards the reduction of packaging waste, along with sustainability, is pushing the adoption of green banding solutions.

Growing manufacturing, logistics, and food processing industries present strong demand for high-speed, automated banding systems. Moreover, the escalating adoption of Industry 4.0 components is driving the innovation of smart banding machines rich in IoT solutions for real-time inspection and operational effectiveness.

Country CAGR (2025 to 2035)
European Union (EU) 4.2%

Japan

Japan's banding machine market is expanding at a moderate pace owing to growth in demand from food, electronics, and industrial goods sectors. With the country’s focus on precision engineering and automation, banding machine technology is getting a lot of attention.

To maximize efficiency, manufacturers offer more features in banding machines such as AI-powered quality control and automated adjustments. Moreover, Japan’s emphasis on sustainability is promoting the development of compact and energy efficient banding solutions across the industries.

Country CAGR (2025 to 2035)
Japan 3.9%

South Korea

The rapid growth in the e-commerce and logistics sectors is advancing the banding machine market in South Korea. Automated packaging solutions are an essential factor that is being adopted by the business across the globe, to maintain operational efficiency and increase profitability.

High Precision Banding Machines Demand is triggered by Strong Electronics and Automotive Industryociation Moreover, the market is being driven by various government initiatives that have been implemented to encourage eco-friendly packaging and smart manufacturing practices.

Country CAGR (2025 to 2035)
South Korea 4.4%

Competitive Outlook: Banding Machine Market

The banding machine market is experiencing steady growth due to increasing demand for efficient packaging solutions across industries such as food & beverage, pharmaceuticals, logistics, and printing. Banding machines are widely used for bundling products securely using paper or plastic bands, offering an eco-friendly and cost-effective alternative to shrink-wrapping and adhesives.

The market is driven by the need for automation in packaging, rising e-commerce shipments, and sustainability initiatives favouring minimal packaging waste. Leading manufacturers are focusing on advanced automation, IoT-enabled smart banding solutions, and high-speed, customizable systems to meet evolving industry demands.
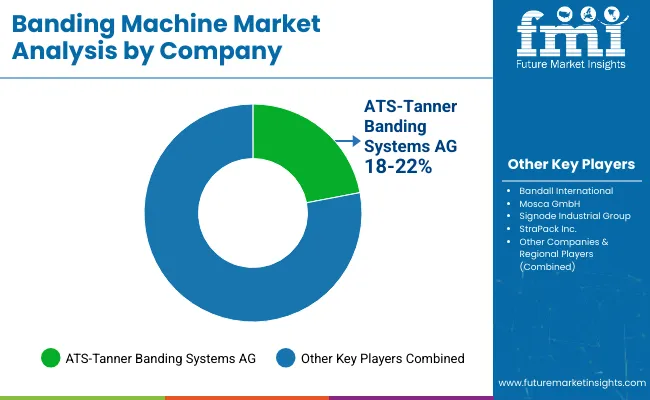
Banding Machine Market By Company

Other Key Players

Several other manufacturers contribute to the banding machine market by focusing on sustainability, automation, and customization. Notable players include:

  • Felins, Inc.
  • Wexler Packaging Products
  • Cyklop International
  • Multifeeder Technology
  • EAM-Mosca Corporation

Top Segments Studied in the Banding Machine Market by Category

By Operation:

  • Semi-automatic
  • Automatic

By Strapping Speed:

  • 1.0-1.5 sec/straps
  • 1.6-2.0 sec/straps
  • Above 2.0 sec/straps

By End Use:

  • Food & Beverage
  • E-commerce
  • Pharmaceuticals
  • Electrical & Electronics
  • Household
  • Shipping & Logistics
  • Printing

By Region:

  • North America
  • Latin America
  • Europe
  • South Asia
  • East Asia
  • Middle East & Africa
  • Oceania

Table of Content

  1. Executive Summary
  2. Industry Introduction, including Taxonomy and Market Definition
  3. Market Trends and Success Factors, including Macro-economic Factors, Market Dynamics, and Recent Industry Developments
  4. Market Demand Analysis 2020 to 2024 and Forecast 2025 to 2035, including Historical Analysis and Future Projections
  5. Market Analysis 2020 to 2024 and Forecast 2025 to 2035
    • Operation
    • Strapping Speed
    • End Use
  6. Market Analysis 2020 to 2024 and Forecast 2025 to 2035, By Operation
    • Semi-automatic
    • Automatic
  7. Market Analysis 2020 to 2024 and Forecast 2025 to 2035, By Strapping Speed
    • 1.0-1.5 sec/straps
    • 1.6-2.0 sec/straps
    • Above 2.0 sec/straps
  8. Market Analysis 2020 to 2024 and Forecast 2025 to 2035, By End Use
    • Food & Beverage
    • E-commerce
    • Pharmaceuticals
    • Electrical & Electronics
    • Household
    • Shipping & Logistics
    • Printing
  9. Market Analysis 2020 to 2024 and Forecast 2025 to 2035, By Region
    • North America
    • Latin America
    • Western Europe
    • Eastern Europe
    • East Asia
    • South Asia Pacific
    • Middle East and Africa
  10. North America Sales Analysis 2020 to 2024 and Forecast 2025 to 2035, by Key Segments and Countries
  11. Latin America Sales Analysis 2020 to 2024 and Forecast 2025 to 2035, by Key Segments and Countries
  12. Western Europe Sales Analysis 2020 to 2024 and Forecast 2025 to 2035, by Key Segments and Countries
  13. Eastern Europe Sales Analysis 2020 to 2024 and Forecast 2025 to 2035, by Key Segments and Countries
  14. East Asia Sales Analysis 2020 to 2024 and Forecast 2025 to 2035, by Key Segments and Countries
  15. South Asia Pacific Sales Analysis 2020 to 2024 and Forecast 2025 to 2035, by Key Segments and Countries
  16. Middle East and Africa Sales Analysis 2020 to 2024 and Forecast 2025 to 2035, by Key Segments and Countries
  17. Sales Forecast 2025 to 2035 by Operation, Strapping Speed, and End Use for 30 Countries
  18. Competition Outlook, including Market Structure Analysis, Company Share Analysis by Key Players, and Competition Dashboard
  19. Company Profile
    • Dynaric, Inc
    • StraPack, Inc.
    • Transpak Equipment Corp.
    • Signode Industrial Group LLC
    • Fromm Holding AG
    • ATS-Tanner Banding Systems AG
    • FELINS
    • Bandall International
    • Avi International Packaging Co.
    • The Plastic Strapping Company Ltd

List of Tables

  • Table 1: Global Market Value (USD Million) Forecast by Region, 2020-2035
  • Table 2: Global Market Volume (Units) Forecast by Region, 2020-2035
  • Table 3: Global Market Value (USD Million) Forecast by Operation, 2020-2035
  • Table 4: Global Market Volume (Units) Forecast by Operation, 2020-2035
  • Table 5: Global Market Value (USD Million) Forecast by Strapping Speed, 2020-2035
  • Table 6: Global Market Volume (Units) Forecast by Strapping Speed, 2020-2035
  • Table 7: Global Market Value (USD Million) Forecast by End Use, 2020-2035
  • Table 8: Global Market Volume (Units) Forecast by End Use, 2020-2035
  • Table 9: North America Market Value (USD Million) Forecast by Country, 2020-2035
  • Table 10: North America Market Volume (Units) Forecast by Country, 2020-2035
  • Table 11: North America Market Value (USD Million) Forecast by Operation, 2020-2035
  • Table 12: North America Market Volume (Units) Forecast by Operation, 2020-2035
  • Table 13: North America Market Value (USD Million) Forecast by Strapping Speed, 2020-2035
  • Table 14: North America Market Volume (Units) Forecast by Strapping Speed, 2020-2035
  • Table 15: North America Market Value (USD Million) Forecast by End Use, 2020-2035
  • Table 16: North America Market Volume (Units) Forecast by End Use, 2020-2035
  • Table 17: Latin America Market Value (USD Million) Forecast by Country, 2020-2035
  • Table 18: Latin America Market Volume (Units) Forecast by Country, 2020-2035
  • Table 19: Latin America Market Value (USD Million) Forecast by Operation, 2020-2035
  • Table 20: Latin America Market Volume (Units) Forecast by Operation, 2020-2035
  • Table 21: Latin America Market Value (USD Million) Forecast by Strapping Speed, 2020-2035
  • Table 22: Latin America Market Volume (Units) Forecast by Strapping Speed, 2020-2035
  • Table 23: Latin America Market Value (USD Million) Forecast by End Use, 2020-2035
  • Table 24: Latin America Market Volume (Units) Forecast by End Use, 2020-2035
  • Table 25: Europe Market Value (USD Million) Forecast by Country, 2020-2035
  • Table 26: Europe Market Volume (Units) Forecast by Country, 2020-2035
  • Table 27: Europe Market Value (USD Million) Forecast by Operation, 2020-2035
  • Table 28: Europe Market Volume (Units) Forecast by Operation, 2020-2035
  • Table 29: Europe Market Value (USD Million) Forecast by Strapping Speed, 2020-2035
  • Table 30: Europe Market Volume (Units) Forecast by Strapping Speed, 2020-2035
  • Table 31: Europe Market Value (USD Million) Forecast by End Use, 2020-2035
  • Table 32: Europe Market Volume (Units) Forecast by End Use, 2020-2035
  • Table 33: East Asia Market Value (USD Million) Forecast by Country, 2020-2035
  • Table 34: East Asia Market Volume (Units) Forecast by Country, 2020-2035
  • Table 35: East Asia Market Value (USD Million) Forecast by Operation, 2020-2035
  • Table 36: East Asia Market Volume (Units) Forecast by Operation, 2020-2035
  • Table 37: East Asia Market Value (USD Million) Forecast by Strapping Speed, 2020-2035
  • Table 38: East Asia Market Volume (Units) Forecast by Strapping Speed, 2020-2035
  • Table 39: East Asia Market Value (USD Million) Forecast by End Use, 2020-2035
  • Table 40: East Asia Market Volume (Units) Forecast by End Use, 2020-2035
  • Table 41: South Asia Market Value (USD Million) Forecast by Country, 2020-2035
  • Table 42: South Asia Market Volume (Units) Forecast by Country, 2020-2035
  • Table 43: South Asia Market Value (USD Million) Forecast by Operation, 2020-2035
  • Table 44: South Asia Market Volume (Units) Forecast by Operation, 2020-2035
  • Table 45: South Asia Market Value (USD Million) Forecast by Strapping Speed, 2020-2035
  • Table 46: South Asia Market Volume (Units) Forecast by Strapping Speed, 2020-2035
  • Table 47: South Asia Market Value (USD Million) Forecast by End Use, 2020-2035
  • Table 48: South Asia Market Volume (Units) Forecast by End Use, 2020-2035
  • Table 49: Oceania Market Value (USD Million) Forecast by Country, 2020-2035
  • Table 50: Oceania Market Volume (Units) Forecast by Country, 2020-2035
  • Table 51: Oceania Market Value (USD Million) Forecast by Operation, 2020-2035
  • Table 52: Oceania Market Volume (Units) Forecast by Operation, 2020-2035
  • Table 53: Oceania Market Value (USD Million) Forecast by Strapping Speed, 2020-2035
  • Table 54: Oceania Market Volume (Units) Forecast by Strapping Speed, 2020-2035
  • Table 55: Oceania Market Value (USD Million) Forecast by End Use, 2020-2035
  • Table 56: Oceania Market Volume (Units) Forecast by End Use, 2020-2035
  • Table 57: MEA Market Value (USD Million) Forecast by Country, 2020-2035
  • Table 58: MEA Market Volume (Units) Forecast by Country, 2020-2035
  • Table 59: MEA Market Value (USD Million) Forecast by Operation, 2020-2035
  • Table 60: MEA Market Volume (Units) Forecast by Operation, 2020-2035
  • Table 61: MEA Market Value (USD Million) Forecast by Strapping Speed, 2020-2035
  • Table 62: MEA Market Volume (Units) Forecast by Strapping Speed, 2020-2035
  • Table 63: MEA Market Value (USD Million) Forecast by End Use, 2020-2035
  • Table 64: MEA Market Volume (Units) Forecast by End Use, 2020-2035

List of Figures

  • Figure 1: Global Market Value (USD Million) by Operation, 2025-2035
  • Figure 2: Global Market Value (USD Million) by Strapping Speed, 2025-2035
  • Figure 3: Global Market Value (USD Million) by End Use, 2025-2035
  • Figure 4: Global Market Value (USD Million) by Region, 2025-2035
  • Figure 5: Global Market Value (USD Million) Analysis by Region, 2020-2035
  • Figure 6: Global Market Volume (Units) Analysis by Region, 2020-2035
  • Figure 7: Global Market Value Share (%) and BPS Analysis by Region, 2025-2035
  • Figure 8: Global Market Y-o-Y Growth (%) Projections by Region, 2025-2035
  • Figure 9: Global Market Value (USD Million) Analysis by Operation, 2020-2035
  • Figure 10: Global Market Volume (Units) Analysis by Operation, 2020-2035
  • Figure 11: Global Market Value Share (%) and BPS Analysis by Operation, 2025-2035
  • Figure 12: Global Market Y-o-Y Growth (%) Projections by Operation, 2025-2035
  • Figure 13: Global Market Value (USD Million) Analysis by Strapping Speed, 2020-2035
  • Figure 14: Global Market Volume (Units) Analysis by Strapping Speed, 2020-2035
  • Figure 15: Global Market Value Share (%) and BPS Analysis by Strapping Speed, 2025-2035
  • Figure 16: Global Market Y-o-Y Growth (%) Projections by Strapping Speed, 2025-2035
  • Figure 17: Global Market Value (USD Million) Analysis by End Use, 2020-2035
  • Figure 18: Global Market Volume (Units) Analysis by End Use, 2020-2035
  • Figure 19: Global Market Value Share (%) and BPS Analysis by End Use, 2025-2035
  • Figure 20: Global Market Y-o-Y Growth (%) Projections by End Use, 2025-2035
  • Figure 21: Global Market Attractiveness by Operation, 2025-2035
  • Figure 22: Global Market Attractiveness by Strapping Speed, 2025-2035
  • Figure 23: Global Market Attractiveness by End Use, 2025-2035
  • Figure 24: Global Market Attractiveness by Region, 2025-2035
  • Figure 25: North America Market Value (USD Million) by Operation, 2025-2035
  • Figure 26: North America Market Value (USD Million) by Strapping Speed, 2025-2035
  • Figure 27: North America Market Value (USD Million) by End Use, 2025-2035
  • Figure 28: North America Market Value (USD Million) by Country, 2025-2035
  • Figure 29: North America Market Value (USD Million) Analysis by Country, 2020-2035
  • Figure 30: North America Market Volume (Units) Analysis by Country, 2020-2035
  • Figure 31: North America Market Value Share (%) and BPS Analysis by Country, 2025-2035
  • Figure 32: North America Market Y-o-Y Growth (%) Projections by Country, 2025-2035
  • Figure 33: North America Market Value (USD Million) Analysis by Operation, 2020-2035
  • Figure 34: North America Market Volume (Units) Analysis by Operation, 2020-2035
  • Figure 35: North America Market Value Share (%) and BPS Analysis by Operation, 2025-2035
  • Figure 36: North America Market Y-o-Y Growth (%) Projections by Operation, 2025-2035
  • Figure 37: North America Market Value (USD Million) Analysis by Strapping Speed, 2020-2035
  • Figure 38: North America Market Volume (Units) Analysis by Strapping Speed, 2020-2035
  • Figure 39: North America Market Value Share (%) and BPS Analysis by Strapping Speed, 2025-2035
  • Figure 40: North America Market Y-o-Y Growth (%) Projections by Strapping Speed, 2025-2035
  • Figure 41: North America Market Value (USD Million) Analysis by End Use, 2020-2035
  • Figure 42: North America Market Volume (Units) Analysis by End Use, 2020-2035
  • Figure 43: North America Market Value Share (%) and BPS Analysis by End Use, 2025-2035
  • Figure 44: North America Market Y-o-Y Growth (%) Projections by End Use, 2025-2035
  • Figure 45: North America Market Attractiveness by Operation, 2025-2035
  • Figure 46: North America Market Attractiveness by Strapping Speed, 2025-2035
  • Figure 47: North America Market Attractiveness by End Use, 2025-2035
  • Figure 48: North America Market Attractiveness by Country, 2025-2035
  • Figure 49: Latin America Market Value (USD Million) by Operation, 2025-2035
  • Figure 50: Latin America Market Value (USD Million) by Strapping Speed, 2025-2035
  • Figure 51: Latin America Market Value (USD Million) by End Use, 2025-2035
  • Figure 52: Latin America Market Value (USD Million) by Country, 2025-2035
  • Figure 53: Latin America Market Value (USD Million) Analysis by Country, 2020-2035
  • Figure 54: Latin America Market Volume (Units) Analysis by Country, 2020-2035
  • Figure 55: Latin America Market Value Share (%) and BPS Analysis by Country, 2025-2035
  • Figure 56: Latin America Market Y-o-Y Growth (%) Projections by Country, 2025-2035
  • Figure 57: Latin America Market Value (USD Million) Analysis by Operation, 2020-2035
  • Figure 58: Latin America Market Volume (Units) Analysis by Operation, 2020-2035
  • Figure 59: Latin America Market Value Share (%) and BPS Analysis by Operation, 2025-2035
  • Figure 60: Latin America Market Y-o-Y Growth (%) Projections by Operation, 2025-2035
  • Figure 61: Latin America Market Value (USD Million) Analysis by Strapping Speed, 2020-2035
  • Figure 62: Latin America Market Volume (Units) Analysis by Strapping Speed, 2020-2035
  • Figure 63: Latin America Market Value Share (%) and BPS Analysis by Strapping Speed, 2025-2035
  • Figure 64: Latin America Market Y-o-Y Growth (%) Projections by Strapping Speed, 2025-2035
  • Figure 65: Latin America Market Value (USD Million) Analysis by End Use, 2020-2035
  • Figure 66: Latin America Market Volume (Units) Analysis by End Use, 2020-2035
  • Figure 67: Latin America Market Value Share (%) and BPS Analysis by End Use, 2025-2035
  • Figure 68: Latin America Market Y-o-Y Growth (%) Projections by End Use, 2025-2035
  • Figure 69: Latin America Market Attractiveness by Operation, 2025-2035
  • Figure 70: Latin America Market Attractiveness by Strapping Speed, 2025-2035
  • Figure 71: Latin America Market Attractiveness by End Use, 2025-2035
  • Figure 72: Latin America Market Attractiveness by Country, 2025-2035
  • Figure 73: Europe Market Value (USD Million) by Operation, 2025-2035
  • Figure 74: Europe Market Value (USD Million) by Strapping Speed, 2025-2035
  • Figure 75: Europe Market Value (USD Million) by End Use, 2025-2035
  • Figure 76: Europe Market Value (USD Million) by Country, 2025-2035
  • Figure 77: Europe Market Value (USD Million) Analysis by Country, 2020-2035
  • Figure 78: Europe Market Volume (Units) Analysis by Country, 2020-2035
  • Figure 79: Europe Market Value Share (%) and BPS Analysis by Country, 2025-2035
  • Figure 80: Europe Market Y-o-Y Growth (%) Projections by Country, 2025-2035
  • Figure 81: Europe Market Value (USD Million) Analysis by Operation, 2020-2035
  • Figure 82: Europe Market Volume (Units) Analysis by Operation, 2020-2035
  • Figure 83: Europe Market Value Share (%) and BPS Analysis by Operation, 2025-2035
  • Figure 84: Europe Market Y-o-Y Growth (%) Projections by Operation, 2025-2035
  • Figure 85: Europe Market Value (USD Million) Analysis by Strapping Speed, 2020-2035
  • Figure 86: Europe Market Volume (Units) Analysis by Strapping Speed, 2020-2035
  • Figure 87: Europe Market Value Share (%) and BPS Analysis by Strapping Speed, 2025-2035
  • Figure 88: Europe Market Y-o-Y Growth (%) Projections by Strapping Speed, 2025-2035
  • Figure 89: Europe Market Value (USD Million) Analysis by End Use, 2020-2035
  • Figure 90: Europe Market Volume (Units) Analysis by End Use, 2020-2035
  • Figure 91: Europe Market Value Share (%) and BPS Analysis by End Use, 2025-2035
  • Figure 92: Europe Market Y-o-Y Growth (%) Projections by End Use, 2025-2035
  • Figure 93: Europe Market Attractiveness by Operation, 2025-2035
  • Figure 94: Europe Market Attractiveness by Strapping Speed, 2025-2035
  • Figure 95: Europe Market Attractiveness by End Use, 2025-2035
  • Figure 96: Europe Market Attractiveness by Country, 2025-2035
  • Figure 97: East Asia Market Value (USD Million) by Operation, 2025-2035
  • Figure 98: East Asia Market Value (USD Million) by Strapping Speed, 2025-2035
  • Figure 99: East Asia Market Value (USD Million) by End Use, 2025-2035
  • Figure 100: East Asia Market Value (USD Million) by Country, 2025-2035
  • Figure 101: East Asia Market Value (USD Million) Analysis by Country, 2020-2035
  • Figure 102: East Asia Market Volume (Units) Analysis by Country, 2020-2035
  • Figure 103: East Asia Market Value Share (%) and BPS Analysis by Country, 2025-2035
  • Figure 104: East Asia Market Y-o-Y Growth (%) Projections by Country, 2025-2035
  • Figure 105: East Asia Market Value (USD Million) Analysis by Operation, 2020-2035
  • Figure 106: East Asia Market Volume (Units) Analysis by Operation, 2020-2035
  • Figure 107: East Asia Market Value Share (%) and BPS Analysis by Operation, 2025-2035
  • Figure 108: East Asia Market Y-o-Y Growth (%) Projections by Operation, 2025-2035
  • Figure 109: East Asia Market Value (USD Million) Analysis by Strapping Speed, 2020-2035
  • Figure 110: East Asia Market Volume (Units) Analysis by Strapping Speed, 2020-2035
  • Figure 111: East Asia Market Value Share (%) and BPS Analysis by Strapping Speed, 2025-2035
  • Figure 112: East Asia Market Y-o-Y Growth (%) Projections by Strapping Speed, 2025-2035
  • Figure 113: East Asia Market Value (USD Million) Analysis by End Use, 2020-2035
  • Figure 114: East Asia Market Volume (Units) Analysis by End Use, 2020-2035
  • Figure 115: East Asia Market Value Share (%) and BPS Analysis by End Use, 2025-2035
  • Figure 116: East Asia Market Y-o-Y Growth (%) Projections by End Use, 2025-2035
  • Figure 117: East Asia Market Attractiveness by Operation, 2025-2035
  • Figure 118: East Asia Market Attractiveness by Strapping Speed, 2025-2035
  • Figure 119: East Asia Market Attractiveness by End Use, 2025-2035
  • Figure 120: East Asia Market Attractiveness by Country, 2025-2035
  • Figure 121: South Asia Market Value (USD Million) by Operation, 2025-2035
  • Figure 122: South Asia Market Value (USD Million) by Strapping Speed, 2025-2035
  • Figure 123: South Asia Market Value (USD Million) by End Use, 2025-2035
  • Figure 124: South Asia Market Value (USD Million) by Country, 2025-2035
  • Figure 125: South Asia Market Value (USD Million) Analysis by Country, 2020-2035
  • Figure 126: South Asia Market Volume (Units) Analysis by Country, 2020-2035
  • Figure 127: South Asia Market Value Share (%) and BPS Analysis by Country, 2025-2035
  • Figure 128: South Asia Market Y-o-Y Growth (%) Projections by Country, 2025-2035
  • Figure 129: South Asia Market Value (USD Million) Analysis by Operation, 2020-2035
  • Figure 130: South Asia Market Volume (Units) Analysis by Operation, 2020-2035
  • Figure 131: South Asia Market Value Share (%) and BPS Analysis by Operation, 2025-2035
  • Figure 132: South Asia Market Y-o-Y Growth (%) Projections by Operation, 2025-2035
  • Figure 133: South Asia Market Value (USD Million) Analysis by Strapping Speed, 2020-2035
  • Figure 134: South Asia Market Volume (Units) Analysis by Strapping Speed, 2020-2035
  • Figure 135: South Asia Market Value Share (%) and BPS Analysis by Strapping Speed, 2025-2035
  • Figure 136: South Asia Market Y-o-Y Growth (%) Projections by Strapping Speed, 2025-2035
  • Figure 137: South Asia Market Value (USD Million) Analysis by End Use, 2020-2035
  • Figure 138: South Asia Market Volume (Units) Analysis by End Use, 2020-2035
  • Figure 139: South Asia Market Value Share (%) and BPS Analysis by End Use, 2025-2035
  • Figure 140: South Asia Market Y-o-Y Growth (%) Projections by End Use, 2025-2035
  • Figure 141: South Asia Market Attractiveness by Operation, 2025-2035
  • Figure 142: South Asia Market Attractiveness by Strapping Speed, 2025-2035
  • Figure 143: South Asia Market Attractiveness by End Use, 2025-2035
  • Figure 144: South Asia Market Attractiveness by Country, 2025-2035
  • Figure 145: Oceania Market Value (USD Million) by Operation, 2025-2035
  • Figure 146: Oceania Market Value (USD Million) by Strapping Speed, 2025-2035
  • Figure 147: Oceania Market Value (USD Million) by End Use, 2025-2035
  • Figure 148: Oceania Market Value (USD Million) by Country, 2025-2035
  • Figure 149: Oceania Market Value (USD Million) Analysis by Country, 2020-2035
  • Figure 150: Oceania Market Volume (Units) Analysis by Country, 2020-2035
  • Figure 151: Oceania Market Value Share (%) and BPS Analysis by Country, 2025-2035
  • Figure 152: Oceania Market Y-o-Y Growth (%) Projections by Country, 2025-2035
  • Figure 153: Oceania Market Value (USD Million) Analysis by Operation, 2020-2035
  • Figure 154: Oceania Market Volume (Units) Analysis by Operation, 2020-2035
  • Figure 155: Oceania Market Value Share (%) and BPS Analysis by Operation, 2025-2035
  • Figure 156: Oceania Market Y-o-Y Growth (%) Projections by Operation, 2025-2035
  • Figure 157: Oceania Market Value (USD Million) Analysis by Strapping Speed, 2020-2035
  • Figure 158: Oceania Market Volume (Units) Analysis by Strapping Speed, 2020-2035
  • Figure 159: Oceania Market Value Share (%) and BPS Analysis by Strapping Speed, 2025-2035
  • Figure 160: Oceania Market Y-o-Y Growth (%) Projections by Strapping Speed, 2025-2035
  • Figure 161: Oceania Market Value (USD Million) Analysis by End Use, 2020-2035
  • Figure 162: Oceania Market Volume (Units) Analysis by End Use, 2020-2035
  • Figure 163: Oceania Market Value Share (%) and BPS Analysis by End Use, 2025-2035
  • Figure 164: Oceania Market Y-o-Y Growth (%) Projections by End Use, 2025-2035
  • Figure 165: Oceania Market Attractiveness by Operation, 2025-2035
  • Figure 166: Oceania Market Attractiveness by Strapping Speed, 2025-2035
  • Figure 167: Oceania Market Attractiveness by End Use, 2025-2035
  • Figure 168: Oceania Market Attractiveness by Country, 2025-2035
  • Figure 169: MEA Market Value (USD Million) by Operation, 2025-2035
  • Figure 170: MEA Market Value (USD Million) by Strapping Speed, 2025-2035
  • Figure 171: MEA Market Value (USD Million) by End Use, 2025-2035
  • Figure 172: MEA Market Value (USD Million) by Country, 2025-2035
  • Figure 173: MEA Market Value (USD Million) Analysis by Country, 2020-2035
  • Figure 174: MEA Market Volume (Units) Analysis by Country, 2020-2035
  • Figure 175: MEA Market Value Share (%) and BPS Analysis by Country, 2025-2035
  • Figure 176: MEA Market Y-o-Y Growth (%) Projections by Country, 2025-2035
  • Figure 177: MEA Market Value (USD Million) Analysis by Operation, 2020-2035
  • Figure 178: MEA Market Volume (Units) Analysis by Operation, 2020-2035
  • Figure 179: MEA Market Value Share (%) and BPS Analysis by Operation, 2025-2035
  • Figure 180: MEA Market Y-o-Y Growth (%) Projections by Operation, 2025-2035
  • Figure 181: MEA Market Value (USD Million) Analysis by Strapping Speed, 2020-2035
  • Figure 182: MEA Market Volume (Units) Analysis by Strapping Speed, 2020-2035
  • Figure 183: MEA Market Value Share (%) and BPS Analysis by Strapping Speed, 2025-2035
  • Figure 184: MEA Market Y-o-Y Growth (%) Projections by Strapping Speed, 2025-2035
  • Figure 185: MEA Market Value (USD Million) Analysis by End Use, 2020-2035
  • Figure 186: MEA Market Volume (Units) Analysis by End Use, 2020-2035
  • Figure 187: MEA Market Value Share (%) and BPS Analysis by End Use, 2025-2035
  • Figure 188: MEA Market Y-o-Y Growth (%) Projections by End Use, 2025-2035
  • Figure 189: MEA Market Attractiveness by Operation, 2025-2035
  • Figure 190: MEA Market Attractiveness by Strapping Speed, 2025-2035
  • Figure 191: MEA Market Attractiveness by End Use, 2025-2035
  • Figure 192: MEA Market Attractiveness by Country, 2025-2035

Frequently Asked Questions

What was the overall size of the in Banding Machine Market 2025?

The overall market size for Banding Machine Market was USD 5.39 Billion in 2025.

How big the Bio is based Banding Machine Market expected in 2035?

The Banding Machine Market expected to reach USD 8.13 Billion in 2035.

What will drive the demand for Banding Machine Market during the forecast period?

The demand for the banding machine market will grow due to increasing automation in packaging, rising demand for efficient bundling solutions in logistics and manufacturing, advancements in sustainable packaging technologies, and the growing need for cost-effective and high-speed strapping solutions across industries.

List the top 5 countries contributing Banding Machine Market?

The top 5 countries which drives the development of Banding Machine Market are USA, UK, Europe Union, Japan and South Korea.

Which segment in type is expected to lead in Banding Machine Market?

Automatic Banding Machines and Food & Beverage lead market growth to command significant share over the assessment period.

Explore Packaging Machinery Insights

Future Market Insights

Banding Machine Market