Reports
- Global Locations -
Headquarters
Future Market Insights, Inc.
Christiana Corporate, 200
Continental Drive, Suite 401,
Newark, Delaware - 19713,
United States
Americas
Future Market Insights, Inc.
616 Corporate Way, Suite 2-9018,
Valley Cottage, NY 10989, United States
MEA
Future Market Insights
1602-6 Jumeirah Bay X2 Tower, Plot No: JLT-PH2-X2A,
Jumeirah Lakes Towers, Dubai,
United Arab Emirates
Europe
Future Market Insights
3rd Floor, 207 Regent Street,
W1B 3HH London
United Kingdom
Asia Pacific
Future Market Insights
Office No. 401-A, 4th Floor,
VANTAGE 9, S.No. 36/1/1,
Baner, Pune 411045, India
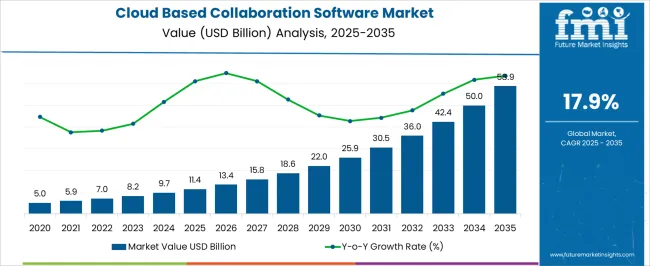
The global cloud based collaboration software market is poised to attain a CAGR of 18.8% during the forecast period. It is likely to garner a revenue of about US$ 45,310.1 million by 2033, up from US$ 8,068.9 million in 2023.
Nowadays, cloud based collaboration software tools have gained huge traction among enterprises. These tools have evolved into comprehensive collaboration platforms, offering advanced features such as direct messaging, real-time notifications, alerts, and seamless document sharing.
In enterprises, this software is implemented to enable users to communicate effectively, eliminating application sluggishness associated while using multiple communication applications. This has led to a notable surge in demand for cloud-based collaboration software. Moreover, the software's significance in the industry is underscored by its popularity among software developers, who utilize it to support source code management and maintain formatting for various programming languages. This dual role has significantly contributed to the growth of the cloud based collaboration software industry.
Report Attribute | Details |
---|---|
Cloud Based Collaboration Software Market Value (2023) | US$ 8,068.9 million |
Cloud Based Collaboration Software Market Anticipated Forecast Value (2033) | US$ 45,310.1 million |
Projected CAGR (2023 to 2033) | 18.8% |
Cloud based collaboration software offers integration with several third-party services, including Google drive and drop box. This in turn is swaying the cloud based collaboration software adoption trends over the forecast period.
The increasing demand for convenient on-demand access to data and the requirement for remote collaboration capabilities have positioned cloud-based collaboration software for substantial market growth. This trend is further augmented by the software's adeptness in accommodating diverse and flexible work arrangements. In addition to this, the cloud based collaboration software market is likely to advance as demand for collaborative operations in the healthcare sector rises as a result of increasing eHealth initiatives among developing economies.
The adoption of cloud based collaboration software is on the surge as cloud-based collaboration platforms offer synchronized data streaming and multiple user file editing solutions. Moreover, the software is becoming more popular among large companies since they are ideal for situations when numerous teams are working on the same projects and need to share a lot of data, auguring well for the market future trends.
Don't pay for what you don't need
Customize your report by selecting specific countries or regions and save 30%!
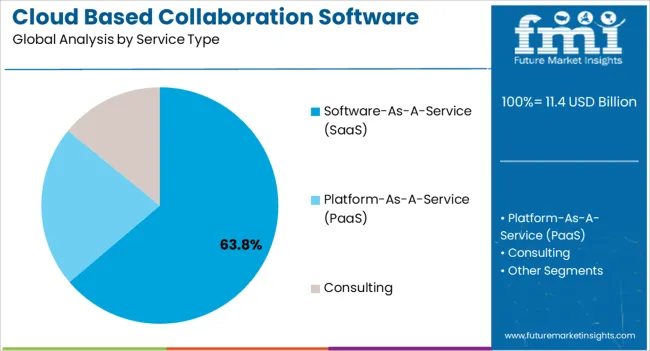
Enterprises are implementing cloud based collaboration software services such as software-as-a-service (SaaS), which is significantly driving up the market growth.
Enterprises are also focusing on the implementation of cloud based collaboration software to improve their operational efficiency owing to the growing trend of mobility and bring your own devices (BYOD). The major advantage of cloud based collaboration software that is shaping the market is that the software ensures all documentation is kept within the same workplace to avoid keeping track of different versions of attachments.
Workforce productivity and low cost are also predicted to influence the market outlook in a positive manner. On the flip side, lack of data security and high internet dependency may act as one of the major restraints faced by vendors in cloud based collaboration software market.
In 2022, the North American region held a significant portion, about 33.9%, of the market share for cloud-based collaboration software. This dominant position in the global market was attributed to the region's abundance of cloud-based solution providers. The market in the region is also expanding on account of the fact that cloud platforms were embraced early on for scalability and flexibility.
Leading companies in the area are placing a significant emphasis on strategic communication between teams working on projects from different locations. This is driving up demand for cloud-based collaboration software. Due to the existence of top technological businesses in the United States, the country is a significant market in North America.
Countries like the United States and Canada are projected to witness a rise in the adoption of cloud-based collaboration software. These efforts are expected to extend the reach of unified communication and web conferencing solutions while also introducing innovative features in their software. This is likely to streamline operations for businesses of various scales in these countries. For instance, in January 2022, Amazon and Stellantis N.V., a prominent global automaker and mobility provider, unveiled a series of multi-year agreements. These agreements are set to revolutionize the in-vehicle experience for numerous Stellantis customers and drive the mobility industry toward a software-driven future.
The cloud based collaboration software industry size is expanding rapidly in Europe. This growth is a direct outcome of the increasing adoption of technology. Businesses in the region are placing a strong emphasis on enhancing customer experiences. This emphasis is driven by their desire to distinguish themselves from competitors in the market.
In 2022, the Europe cloud based collaboration software market secured a portion of 20.4%. This can be attributed to the growing adoption of cloud-based technologies by businesses, coupled with the expansion of hybrid cloud solution. Google, IBM, Salesforce, and AWS control a sizeable portion of the cloud-based service market in Spain today and are actively developing important cloud technologies.
Many businesses are undergoing digital transformation initiatives in the United Kingdom. This includes the integration of cloud-based tools and solutions to enhance collaboration and productivity. Data security and compliance with regulations like GDPR (General Data Protection Regulation) are important considerations for companies using cloud-based collaboration tools. This also influences the choice of software providers.
Cloud-based solutions are experiencing significant demand in Germany, leading to an increased need for team collaboration software. The country boasts robust automotive and manufacturing industries. Both are witnessing a growing requirement for heightened productivity and efficiency. This inclination has prompted manufacturing enterprises to embrace automated solutions, including automated material handling equipment. These dynamics collectively contribute to the escalating demands within Germany.
A legion of start-ups are emerging, in turn bringing about emerging trends in the cloud based collaboration software industry.
Get the data you need at a Fraction of the cost
Personalize your report by choosing insights you need
and save 40%!
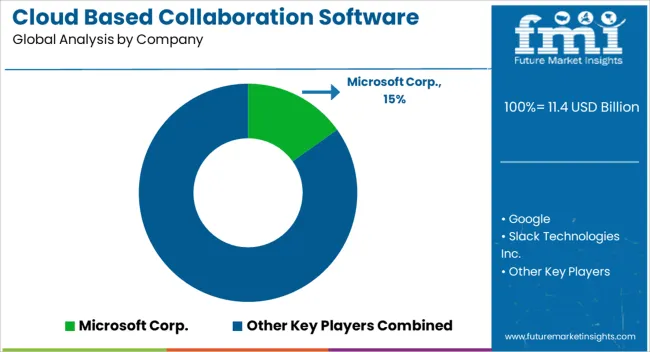
The market is extremely competitive, with both international and local competitors vying for a larger market share.
As a crucial tactic for gaining a competitive advantage, businesses are concentrating on partnerships, mergers, acquisitions, and collaborations.
For instance:
Report Attribute | Details |
---|---|
Growth Rate | CAGR of 18.8% from 2023 to 2033 |
Base Year for Estimation | 2022 |
Historical Data | 2018 to 2022 |
Forecast Period | 2023 to 2033 |
Quantitative Units | Revenue in US$ Million and CAGR from 2023 to 2033 |
Report Coverage | Revenue Forecast, Volume Forecast, Company Ranking, Competitive Landscape, Growth Factors, Trends and Pricing Analysis |
Segments Covered |
|
Regions Covered |
|
Key Countries Profiled |
|
Key Companies Profiled |
|
Customization | Available Upon Request |
1. Executive Summary 1.1. Global Market Outlook 1.2. Demand-side Trends 1.3. Supply-side Trends 1.4. Technology Roadmap Analysis 1.5. Analysis and Recommendations 2. Market Overview 2.1. Market Coverage / Taxonomy 2.2. Market Definition / Scope / Limitations 3. Market Background 3.1. Market Dynamics 3.1.1. Drivers 3.1.2. Restraints 3.1.3. Opportunity 3.1.4. Trends 3.2. Scenario Forecast 3.2.1. Demand in Optimistic Scenario 3.2.2. Demand in Likely Scenario 3.2.3. Demand in Conservative Scenario 3.3. Opportunity Map Analysis 3.4. Investment Feasibility Matrix 3.5. PESTLE and Porter’s Analysis 3.6. Regulatory Landscape 3.6.1. By Key Regions 3.6.2. By Key Countries 3.7. Regional Parent Market Outlook 4. Global Market Analysis 2018 to 2022 and Forecast, 2023 to 2033 4.1. Historical Market Size Value (US$ Million) Analysis, 2018 to 2022 4.2. Current and Future Market Size Value (US$ Million) Projections, 2023 to 2033 4.2.1. Y-o-Y Growth Trend Analysis 4.2.2. Absolute $ Opportunity Analysis 5. Global Market Analysis 2018 to 2022 and Forecast 2023 to 2033, By Deployment Models 5.1. Introduction / Key Findings 5.2. Historical Market Size Value (US$ Million) Analysis By Deployment Models, 2018 to 2022 5.3. Current and Future Market Size Value (US$ Million) Analysis and Forecast By Deployment Models, 2023 to 2033 5.3.1. Public Cloud 5.3.2. Private Cloud 5.4. Y-o-Y Growth Trend Analysis By Deployment Models, 2018 to 2022 5.5. Absolute $ Opportunity Analysis By Deployment Models, 2023 to 2033 6. Global Market Analysis 2018 to 2022 and Forecast 2023 to 2033, By Service Type 6.1. Introduction / Key Findings 6.2. Historical Market Size Value (US$ Million) Analysis By Service Type, 2018 to 2022 6.3. Current and Future Market Size Value (US$ Million) Analysis and Forecast By Service Type, 2023 to 2033 6.3.1. Software-as-a-service (Saas) 6.3.2. Platform-as-a-service (Paas) 6.3.3. Consulting 6.4. Y-o-Y Growth Trend Analysis By Service Type, 2018 to 2022 6.5. Absolute $ Opportunity Analysis By Service Type, 2023 to 2033 7. Global Market Analysis 2018 to 2022 and Forecast 2023 to 2033, By Solution Type 7.1. Introduction / Key Findings 7.2. Historical Market Size Value (US$ Million) Analysis By Solution Type, 2018 to 2022 7.3. Current and Future Market Size Value (US$ Million) Analysis and Forecast By Solution Type, 2023 to 2033 7.3.1. Unified Communication and Collaboration 7.3.2. Document Management System 7.4. Y-o-Y Growth Trend Analysis By Solution Type, 2018 to 2022 7.5. Absolute $ Opportunity Analysis By Solution Type, 2023 to 2033 8. Global Market Analysis 2018 to 2022 and Forecast 2023 to 2033, By Enterprise Size 8.1. Introduction / Key Findings 8.2. Historical Market Size Value (US$ Million) Analysis By Enterprise Size, 2018 to 2022 8.3. Current and Future Market Size Value (US$ Million) Analysis and Forecast By Enterprise Size, 2023 to 2033 8.3.1. Small and Medium Enterprises 8.4. Y-o-Y Growth Trend Analysis By Enterprise Size, 2018 to 2022 8.5. Absolute $ Opportunity Analysis By Enterprise Size, 2023 to 2033 9. Global Market Analysis 2018 to 2022 and Forecast 2023 to 2033, By Vertical Type 9.1. Introduction / Key Findings 9.2. Historical Market Size Value (US$ Million) Analysis By Vertical Type, 2018 to 2022 9.3. Current and Future Market Size Value (US$ Million) Analysis and Forecast By Vertical Type, 2023 to 2033 9.3.1. IT and Telecom 9.3.2. BFSI 9.3.3. Retail 9.3.4. Government 9.3.5. Other 9.4. Y-o-Y Growth Trend Analysis By Vertical Type, 2018 to 2022 9.5. Absolute $ Opportunity Analysis By Vertical Type, 2023 to 2033 10. Global Market Analysis 2018 to 2022 and Forecast 2023 to 2033, By Region 10.1. Introduction 10.2. Historical Market Size Value (US$ Million) Analysis By Region, 2018 to 2022 10.3. Current Market Size Value (US$ Million) Analysis and Forecast By Region, 2023 to 2033 10.3.1. North America 10.3.2. Latin America 10.3.3. Western Europe 10.3.4. Eastern Europe 10.3.5. South Asia and Pacific 10.3.6. East Asia 10.3.7. Middle East and Africa 10.4. Market Attractiveness Analysis By Region 11. North America Market Analysis 2018 to 2022 and Forecast 2023 to 2033, By Country 11.1. Historical Market Size Value (US$ Million) Trend Analysis By Market Taxonomy, 2018 to 2022 11.2. Market Size Value (US$ Million) Forecast By Market Taxonomy, 2023 to 2033 11.2.1. By Country 11.2.1.1. USA 11.2.1.2. Canada 11.2.2. By Deployment Models 11.2.3. By Service Type 11.2.4. By Solution Type 11.2.5. By Enterprise Size 11.2.6. By Vertical Type 11.3. Market Attractiveness Analysis 11.3.1. By Country 11.3.2. By Deployment Models 11.3.3. By Service Type 11.3.4. By Solution Type 11.3.5. By Enterprise Size 11.3.6. By Vertical Type 11.4. Key Takeaways 12. Latin America Market Analysis 2018 to 2022 and Forecast 2023 to 2033, By Country 12.1. Historical Market Size Value (US$ Million) Trend Analysis By Market Taxonomy, 2018 to 2022 12.2. Market Size Value (US$ Million) Forecast By Market Taxonomy, 2023 to 2033 12.2.1. By Country 12.2.1.1. Brazil 12.2.1.2. Mexico 12.2.1.3. Rest of Latin America 12.2.2. By Deployment Models 12.2.3. By Service Type 12.2.4. By Solution Type 12.2.5. By Enterprise Size 12.2.6. By Vertical Type 12.3. Market Attractiveness Analysis 12.3.1. By Country 12.3.2. By Deployment Models 12.3.3. By Service Type 12.3.4. By Solution Type 12.3.5. By Enterprise Size 12.3.6. By Vertical Type 12.4. Key Takeaways 13. Western Europe Market Analysis 2018 to 2022 and Forecast 2023 to 2033, By Country 13.1. Historical Market Size Value (US$ Million) Trend Analysis By Market Taxonomy, 2018 to 2022 13.2. Market Size Value (US$ Million) Forecast By Market Taxonomy, 2023 to 2033 13.2.1. By Country 13.2.1.1. Germany 13.2.1.2. UK 13.2.1.3. France 13.2.1.4. Spain 13.2.1.5. Italy 13.2.1.6. Rest of Western Europe 13.2.2. By Deployment Models 13.2.3. By Service Type 13.2.4. By Solution Type 13.2.5. By Enterprise Size 13.2.6. By Vertical Type 13.3. Market Attractiveness Analysis 13.3.1. By Country 13.3.2. By Deployment Models 13.3.3. By Service Type 13.3.4. By Solution Type 13.3.5. By Enterprise Size 13.3.6. By Vertical Type 13.4. Key Takeaways 14. Eastern Europe Market Analysis 2018 to 2022 and Forecast 2023 to 2033, By Country 14.1. Historical Market Size Value (US$ Million) Trend Analysis By Market Taxonomy, 2018 to 2022 14.2. Market Size Value (US$ Million) Forecast By Market Taxonomy, 2023 to 2033 14.2.1. By Country 14.2.1.1. Poland 14.2.1.2. Russia 14.2.1.3. Czech Republic 14.2.1.4. Romania 14.2.1.5. Rest of Eastern Europe 14.2.2. By Deployment Models 14.2.3. By Service Type 14.2.4. By Solution Type 14.2.5. By Enterprise Size 14.2.6. By Vertical Type 14.3. Market Attractiveness Analysis 14.3.1. By Country 14.3.2. By Deployment Models 14.3.3. By Service Type 14.3.4. By Solution Type 14.3.5. By Enterprise Size 14.3.6. By Vertical Type 14.4. Key Takeaways 15. South Asia and Pacific Market Analysis 2018 to 2022 and Forecast 2023 to 2033, By Country 15.1. Historical Market Size Value (US$ Million) Trend Analysis By Market Taxonomy, 2018 to 2022 15.2. Market Size Value (US$ Million) Forecast By Market Taxonomy, 2023 to 2033 15.2.1. By Country 15.2.1.1. India 15.2.1.2. Bangladesh 15.2.1.3. Australia 15.2.1.4. New Zealand 15.2.1.5. Rest of South Asia and Pacific 15.2.2. By Deployment Models 15.2.3. By Service Type 15.2.4. By Solution Type 15.2.5. By Enterprise Size 15.2.6. By Vertical Type 15.3. Market Attractiveness Analysis 15.3.1. By Country 15.3.2. By Deployment Models 15.3.3. By Service Type 15.3.4. By Solution Type 15.3.5. By Enterprise Size 15.3.6. By Vertical Type 15.4. Key Takeaways 16. East Asia Market Analysis 2018 to 2022 and Forecast 2023 to 2033, By Country 16.1. Historical Market Size Value (US$ Million) Trend Analysis By Market Taxonomy, 2018 to 2022 16.2. Market Size Value (US$ Million) Forecast By Market Taxonomy, 2023 to 2033 16.2.1. By Country 16.2.1.1. China 16.2.1.2. Japan 16.2.1.3. South Korea 16.2.2. By Deployment Models 16.2.3. By Service Type 16.2.4. By Solution Type 16.2.5. By Enterprise Size 16.2.6. By Vertical Type 16.3. Market Attractiveness Analysis 16.3.1. By Country 16.3.2. By Deployment Models 16.3.3. By Service Type 16.3.4. By Solution Type 16.3.5. By Enterprise Size 16.3.6. By Vertical Type 16.4. Key Takeaways 17. Middle East and Africa Market Analysis 2018 to 2022 and Forecast 2023 to 2033, By Country 17.1. Historical Market Size Value (US$ Million) Trend Analysis By Market Taxonomy, 2018 to 2022 17.2. Market Size Value (US$ Million) Forecast By Market Taxonomy, 2023 to 2033 17.2.1. By Country 17.2.1.1. GCC Countries 17.2.1.2. South Africa 17.2.1.3. Israel 17.2.1.4. Rest of MEA 17.2.2. By Deployment Models 17.2.3. By Service Type 17.2.4. By Solution Type 17.2.5. By Enterprise Size 17.2.6. By Vertical Type 17.3. Market Attractiveness Analysis 17.3.1. By Country 17.3.2. By Deployment Models 17.3.3. By Service Type 17.3.4. By Solution Type 17.3.5. By Enterprise Size 17.3.6. By Vertical Type 17.4. Key Takeaways 18. Key Countries Market Analysis 18.1. USA 18.1.1. Pricing Analysis 18.1.2. Market Share Analysis, 2022 18.1.2.1. By Deployment Models 18.1.2.2. By Service Type 18.1.2.3. By Solution Type 18.1.2.4. By Enterprise Size 18.1.2.5. By Vertical Type 18.2. Canada 18.2.1. Pricing Analysis 18.2.2. Market Share Analysis, 2022 18.2.2.1. By Deployment Models 18.2.2.2. By Service Type 18.2.2.3. By Solution Type 18.2.2.4. By Enterprise Size 18.2.2.5. By Vertical Type 18.3. Brazil 18.3.1. Pricing Analysis 18.3.2. Market Share Analysis, 2022 18.3.2.1. By Deployment Models 18.3.2.2. By Service Type 18.3.2.3. By Solution Type 18.3.2.4. By Enterprise Size 18.3.2.5. By Vertical Type 18.4. Mexico 18.4.1. Pricing Analysis 18.4.2. Market Share Analysis, 2022 18.4.2.1. By Deployment Models 18.4.2.2. By Service Type 18.4.2.3. By Solution Type 18.4.2.4. By Enterprise Size 18.4.2.5. By Vertical Type 18.5. Germany 18.5.1. Pricing Analysis 18.5.2. Market Share Analysis, 2022 18.5.2.1. By Deployment Models 18.5.2.2. By Service Type 18.5.2.3. By Solution Type 18.5.2.4. By Enterprise Size 18.5.2.5. By Vertical Type 18.6. UK 18.6.1. Pricing Analysis 18.6.2. Market Share Analysis, 2022 18.6.2.1. By Deployment Models 18.6.2.2. By Service Type 18.6.2.3. By Solution Type 18.6.2.4. By Enterprise Size 18.6.2.5. By Vertical Type 18.7. France 18.7.1. Pricing Analysis 18.7.2. Market Share Analysis, 2022 18.7.2.1. By Deployment Models 18.7.2.2. By Service Type 18.7.2.3. By Solution Type 18.7.2.4. By Enterprise Size 18.7.2.5. By Vertical Type 18.8. Spain 18.8.1. Pricing Analysis 18.8.2. Market Share Analysis, 2022 18.8.2.1. By Deployment Models 18.8.2.2. By Service Type 18.8.2.3. By Solution Type 18.8.2.4. By Enterprise Size 18.8.2.5. By Vertical Type 18.9. Italy 18.9.1. Pricing Analysis 18.9.2. Market Share Analysis, 2022 18.9.2.1. By Deployment Models 18.9.2.2. By Service Type 18.9.2.3. By Solution Type 18.9.2.4. By Enterprise Size 18.9.2.5. By Vertical Type 18.10. Poland 18.10.1. Pricing Analysis 18.10.2. Market Share Analysis, 2022 18.10.2.1. By Deployment Models 18.10.2.2. By Service Type 18.10.2.3. By Solution Type 18.10.2.4. By Enterprise Size 18.10.2.5. By Vertical Type 18.11. Russia 18.11.1. Pricing Analysis 18.11.2. Market Share Analysis, 2022 18.11.2.1. By Deployment Models 18.11.2.2. By Service Type 18.11.2.3. By Solution Type 18.11.2.4. By Enterprise Size 18.11.2.5. By Vertical Type 18.12. Czech Republic 18.12.1. Pricing Analysis 18.12.2. Market Share Analysis, 2022 18.12.2.1. By Deployment Models 18.12.2.2. By Service Type 18.12.2.3. By Solution Type 18.12.2.4. By Enterprise Size 18.12.2.5. By Vertical Type 18.13. Romania 18.13.1. Pricing Analysis 18.13.2. Market Share Analysis, 2022 18.13.2.1. By Deployment Models 18.13.2.2. By Service Type 18.13.2.3. By Solution Type 18.13.2.4. By Enterprise Size 18.13.2.5. By Vertical Type 18.14. India 18.14.1. Pricing Analysis 18.14.2. Market Share Analysis, 2022 18.14.2.1. By Deployment Models 18.14.2.2. By Service Type 18.14.2.3. By Solution Type 18.14.2.4. By Enterprise Size 18.14.2.5. By Vertical Type 18.15. Bangladesh 18.15.1. Pricing Analysis 18.15.2. Market Share Analysis, 2022 18.15.2.1. By Deployment Models 18.15.2.2. By Service Type 18.15.2.3. By Solution Type 18.15.2.4. By Enterprise Size 18.15.2.5. By Vertical Type 18.16. Australia 18.16.1. Pricing Analysis 18.16.2. Market Share Analysis, 2022 18.16.2.1. By Deployment Models 18.16.2.2. By Service Type 18.16.2.3. By Solution Type 18.16.2.4. By Enterprise Size 18.16.2.5. By Vertical Type 18.17. New Zealand 18.17.1. Pricing Analysis 18.17.2. Market Share Analysis, 2022 18.17.2.1. By Deployment Models 18.17.2.2. By Service Type 18.17.2.3. By Solution Type 18.17.2.4. By Enterprise Size 18.17.2.5. By Vertical Type 18.18. China 18.18.1. Pricing Analysis 18.18.2. Market Share Analysis, 2022 18.18.2.1. By Deployment Models 18.18.2.2. By Service Type 18.18.2.3. By Solution Type 18.18.2.4. By Enterprise Size 18.18.2.5. By Vertical Type 18.19. Japan 18.19.1. Pricing Analysis 18.19.2. Market Share Analysis, 2022 18.19.2.1. By Deployment Models 18.19.2.2. By Service Type 18.19.2.3. By Solution Type 18.19.2.4. By Enterprise Size 18.19.2.5. By Vertical Type 18.20. South Korea 18.20.1. Pricing Analysis 18.20.2. Market Share Analysis, 2022 18.20.2.1. By Deployment Models 18.20.2.2. By Service Type 18.20.2.3. By Solution Type 18.20.2.4. By Enterprise Size 18.20.2.5. By Vertical Type 18.21. GCC Countries 18.21.1. Pricing Analysis 18.21.2. Market Share Analysis, 2022 18.21.2.1. By Deployment Models 18.21.2.2. By Service Type 18.21.2.3. By Solution Type 18.21.2.4. By Enterprise Size 18.21.2.5. By Vertical Type 18.22. South Africa 18.22.1. Pricing Analysis 18.22.2. Market Share Analysis, 2022 18.22.2.1. By Deployment Models 18.22.2.2. By Service Type 18.22.2.3. By Solution Type 18.22.2.4. By Enterprise Size 18.22.2.5. By Vertical Type 18.23. Israel 18.23.1. Pricing Analysis 18.23.2. Market Share Analysis, 2022 18.23.2.1. By Deployment Models 18.23.2.2. By Service Type 18.23.2.3. By Solution Type 18.23.2.4. By Enterprise Size 18.23.2.5. By Vertical Type 19. Market Structure Analysis 19.1. Competition Dashboard 19.2. Competition Benchmarking 19.3. Market Share Analysis of Top Players 19.3.1. By Regional 19.3.2. By Deployment Models 19.3.3. By Service Type 19.3.4. By Solution Type 19.3.5. By Enterprise Size 19.3.6. By Vertical Type 20. Competition Analysis 20.1. Competition Deep Dive 20.1.1. Microsoft Corp. 20.1.1.1. Overview 20.1.1.2. Product Portfolio 20.1.1.3. Profitability by Market Segments 20.1.1.4. Sales Footprint 20.1.1.5. Strategy Overview 20.1.1.5.1. Marketing Strategy 20.1.2. Google 20.1.2.1. Overview 20.1.2.2. Product Portfolio 20.1.2.3. Profitability by Market Segments 20.1.2.4. Sales Footprint 20.1.2.5. Strategy Overview 20.1.2.5.1. Marketing Strategy 20.1.3. Slack technologies Inc. 20.1.3.1. Overview 20.1.3.2. Product Portfolio 20.1.3.3. Profitability by Market Segments 20.1.3.4. Sales Footprint 20.1.3.5. Strategy Overview 20.1.3.5.1. Marketing Strategy 20.1.4. Aspect software 20.1.4.1. Overview 20.1.4.2. Product Portfolio 20.1.4.3. Profitability by Market Segments 20.1.4.4. Sales Footprint 20.1.4.5. Strategy Overview 20.1.4.5.1. Marketing Strategy 20.1.5. Cisco Systems 20.1.5.1. Overview 20.1.5.2. Product Portfolio 20.1.5.3. Profitability by Market Segments 20.1.5.4. Sales Footprint 20.1.5.5. Strategy Overview 20.1.5.5.1. Marketing Strategy 20.1.6. Oracle 20.1.6.1. Overview 20.1.6.2. Product Portfolio 20.1.6.3. Profitability by Market Segments 20.1.6.4. Sales Footprint 20.1.6.5. Strategy Overview 20.1.6.5.1. Marketing Strategy 20.1.7. Salesforce.com Inc. 20.1.7.1. Overview 20.1.7.2. Product Portfolio 20.1.7.3. Profitability by Market Segments 20.1.7.4. Sales Footprint 20.1.7.5. Strategy Overview 20.1.7.5.1. Marketing Strategy 20.1.8. Jive software Inc. 20.1.8.1. Overview 20.1.8.2. Product Portfolio 20.1.8.3. Profitability by Market Segments 20.1.8.4. Sales Footprint 20.1.8.5. Strategy Overview 20.1.8.5.1. Marketing Strategy 20.1.9. Mitel Networks Corporation 20.1.9.1. Overview 20.1.9.2. Product Portfolio 20.1.9.3. Profitability by Market Segments 20.1.9.4. Sales Footprint 20.1.9.5. Strategy Overview 20.1.9.5.1. Marketing Strategy 20.1.10. Box Inc. 20.1.10.1. Overview 20.1.10.2. Product Portfolio 20.1.10.3. Profitability by Market Segments 20.1.10.4. Sales Footprint 20.1.10.5. Strategy Overview 20.1.10.5.1. Marketing Strategy 21. Assumptions & Acronyms Used 22. Research Methodology
Don't pay for what you don't need
Customize your report by selecting specific countries or regions and save 30%!
Table 1: Global Market Value (US$ Million) Forecast by Region, 2018 to 2033 Table 2: Global Market Value (US$ Million) Forecast by Deployment Models, 2018 to 2033 Table 3: Global Market Value (US$ Million) Forecast by Service Type, 2018 to 2033 Table 4: Global Market Value (US$ Million) Forecast by Solution Type, 2018 to 2033 Table 5: Global Market Value (US$ Million) Forecast by Enterprise Size, 2018 to 2033 Table 6: Global Market Value (US$ Million) Forecast by Vertical Type, 2018 to 2033 Table 7: North America Market Value (US$ Million) Forecast by Country, 2018 to 2033 Table 8: North America Market Value (US$ Million) Forecast by Deployment Models, 2018 to 2033 Table 9: North America Market Value (US$ Million) Forecast by Service Type, 2018 to 2033 Table 10: North America Market Value (US$ Million) Forecast by Solution Type, 2018 to 2033 Table 11: North America Market Value (US$ Million) Forecast by Enterprise Size, 2018 to 2033 Table 12: North America Market Value (US$ Million) Forecast by Vertical Type, 2018 to 2033 Table 13: Latin America Market Value (US$ Million) Forecast by Country, 2018 to 2033 Table 14: Latin America Market Value (US$ Million) Forecast by Deployment Models, 2018 to 2033 Table 15: Latin America Market Value (US$ Million) Forecast by Service Type, 2018 to 2033 Table 16: Latin America Market Value (US$ Million) Forecast by Solution Type, 2018 to 2033 Table 17: Latin America Market Value (US$ Million) Forecast by Enterprise Size, 2018 to 2033 Table 18: Latin America Market Value (US$ Million) Forecast by Vertical Type, 2018 to 2033 Table 19: Western Europe Market Value (US$ Million) Forecast by Country, 2018 to 2033 Table 20: Western Europe Market Value (US$ Million) Forecast by Deployment Models, 2018 to 2033 Table 21: Western Europe Market Value (US$ Million) Forecast by Service Type, 2018 to 2033 Table 22: Western Europe Market Value (US$ Million) Forecast by Solution Type, 2018 to 2033 Table 23: Western Europe Market Value (US$ Million) Forecast by Enterprise Size, 2018 to 2033 Table 24: Western Europe Market Value (US$ Million) Forecast by Vertical Type, 2018 to 2033 Table 25: Eastern Europe Market Value (US$ Million) Forecast by Country, 2018 to 2033 Table 26: Eastern Europe Market Value (US$ Million) Forecast by Deployment Models, 2018 to 2033 Table 27: Eastern Europe Market Value (US$ Million) Forecast by Service Type, 2018 to 2033 Table 28: Eastern Europe Market Value (US$ Million) Forecast by Solution Type, 2018 to 2033 Table 29: Eastern Europe Market Value (US$ Million) Forecast by Enterprise Size, 2018 to 2033 Table 30: Eastern Europe Market Value (US$ Million) Forecast by Vertical Type, 2018 to 2033 Table 31: South Asia and Pacific Market Value (US$ Million) Forecast by Country, 2018 to 2033 Table 32: South Asia and Pacific Market Value (US$ Million) Forecast by Deployment Models, 2018 to 2033 Table 33: South Asia and Pacific Market Value (US$ Million) Forecast by Service Type, 2018 to 2033 Table 34: South Asia and Pacific Market Value (US$ Million) Forecast by Solution Type, 2018 to 2033 Table 35: South Asia and Pacific Market Value (US$ Million) Forecast by Enterprise Size, 2018 to 2033 Table 36: South Asia and Pacific Market Value (US$ Million) Forecast by Vertical Type, 2018 to 2033 Table 37: East Asia Market Value (US$ Million) Forecast by Country, 2018 to 2033 Table 38: East Asia Market Value (US$ Million) Forecast by Deployment Models, 2018 to 2033 Table 39: East Asia Market Value (US$ Million) Forecast by Service Type, 2018 to 2033 Table 40: East Asia Market Value (US$ Million) Forecast by Solution Type, 2018 to 2033 Table 41: East Asia Market Value (US$ Million) Forecast by Enterprise Size, 2018 to 2033 Table 42: East Asia Market Value (US$ Million) Forecast by Vertical Type, 2018 to 2033 Table 43: Middle East and Africa Market Value (US$ Million) Forecast by Country, 2018 to 2033 Table 44: Middle East and Africa Market Value (US$ Million) Forecast by Deployment Models, 2018 to 2033 Table 45: Middle East and Africa Market Value (US$ Million) Forecast by Service Type, 2018 to 2033 Table 46: Middle East and Africa Market Value (US$ Million) Forecast by Solution Type, 2018 to 2033 Table 47: Middle East and Africa Market Value (US$ Million) Forecast by Enterprise Size, 2018 to 2033 Table 48: Middle East and Africa Market Value (US$ Million) Forecast by Vertical Type, 2018 to 2033
Figure 1: Global Market Value (US$ Million) by Deployment Models, 2023 to 2033 Figure 2: Global Market Value (US$ Million) by Service Type, 2023 to 2033 Figure 3: Global Market Value (US$ Million) by Solution Type, 2023 to 2033 Figure 4: Global Market Value (US$ Million) by Enterprise Size, 2023 to 2033 Figure 5: Global Market Value (US$ Million) by Vertical Type, 2023 to 2033 Figure 6: Global Market Value (US$ Million) by Region, 2023 to 2033 Figure 7: Global Market Value (US$ Million) Analysis by Region, 2018 to 2033 Figure 8: Global Market Value Share (%) and BPS Analysis by Region, 2023 to 2033 Figure 9: Global Market Y-o-Y Growth (%) Projections by Region, 2023 to 2033 Figure 10: Global Market Value (US$ Million) Analysis by Deployment Models, 2018 to 2033 Figure 11: Global Market Value Share (%) and BPS Analysis by Deployment Models, 2023 to 2033 Figure 12: Global Market Y-o-Y Growth (%) Projections by Deployment Models, 2023 to 2033 Figure 13: Global Market Value (US$ Million) Analysis by Service Type, 2018 to 2033 Figure 14: Global Market Value Share (%) and BPS Analysis by Service Type, 2023 to 2033 Figure 15: Global Market Y-o-Y Growth (%) Projections by Service Type, 2023 to 2033 Figure 16: Global Market Value (US$ Million) Analysis by Solution Type, 2018 to 2033 Figure 17: Global Market Value Share (%) and BPS Analysis by Solution Type, 2023 to 2033 Figure 18: Global Market Y-o-Y Growth (%) Projections by Solution Type, 2023 to 2033 Figure 19: Global Market Value (US$ Million) Analysis by Enterprise Size, 2018 to 2033 Figure 20: Global Market Value Share (%) and BPS Analysis by Enterprise Size, 2023 to 2033 Figure 21: Global Market Y-o-Y Growth (%) Projections by Enterprise Size, 2023 to 2033 Figure 22: Global Market Value (US$ Million) Analysis by Vertical Type, 2018 to 2033 Figure 23: Global Market Value Share (%) and BPS Analysis by Vertical Type, 2023 to 2033 Figure 24: Global Market Y-o-Y Growth (%) Projections by Vertical Type, 2023 to 2033 Figure 25: Global Market Attractiveness by Deployment Models, 2023 to 2033 Figure 26: Global Market Attractiveness by Service Type, 2023 to 2033 Figure 27: Global Market Attractiveness by Solution Type, 2023 to 2033 Figure 28: Global Market Attractiveness by Enterprise Size, 2023 to 2033 Figure 29: Global Market Attractiveness by Vertical Type, 2023 to 2033 Figure 30: Global Market Attractiveness by Region, 2023 to 2033 Figure 31: North America Market Value (US$ Million) by Deployment Models, 2023 to 2033 Figure 32: North America Market Value (US$ Million) by Service Type, 2023 to 2033 Figure 33: North America Market Value (US$ Million) by Solution Type, 2023 to 2033 Figure 34: North America Market Value (US$ Million) by Enterprise Size, 2023 to 2033 Figure 35: North America Market Value (US$ Million) by Vertical Type, 2023 to 2033 Figure 36: North America Market Value (US$ Million) by Country, 2023 to 2033 Figure 37: North America Market Value (US$ Million) Analysis by Country, 2018 to 2033 Figure 38: North America Market Value Share (%) and BPS Analysis by Country, 2023 to 2033 Figure 39: North America Market Y-o-Y Growth (%) Projections by Country, 2023 to 2033 Figure 40: North America Market Value (US$ Million) Analysis by Deployment Models, 2018 to 2033 Figure 41: North America Market Value Share (%) and BPS Analysis by Deployment Models, 2023 to 2033 Figure 42: North America Market Y-o-Y Growth (%) Projections by Deployment Models, 2023 to 2033 Figure 43: North America Market Value (US$ Million) Analysis by Service Type, 2018 to 2033 Figure 44: North America Market Value Share (%) and BPS Analysis by Service Type, 2023 to 2033 Figure 45: North America Market Y-o-Y Growth (%) Projections by Service Type, 2023 to 2033 Figure 46: North America Market Value (US$ Million) Analysis by Solution Type, 2018 to 2033 Figure 47: North America Market Value Share (%) and BPS Analysis by Solution Type, 2023 to 2033 Figure 48: North America Market Y-o-Y Growth (%) Projections by Solution Type, 2023 to 2033 Figure 49: North America Market Value (US$ Million) Analysis by Enterprise Size, 2018 to 2033 Figure 50: North America Market Value Share (%) and BPS Analysis by Enterprise Size, 2023 to 2033 Figure 51: North America Market Y-o-Y Growth (%) Projections by Enterprise Size, 2023 to 2033 Figure 52: North America Market Value (US$ Million) Analysis by Vertical Type, 2018 to 2033 Figure 53: North America Market Value Share (%) and BPS Analysis by Vertical Type, 2023 to 2033 Figure 54: North America Market Y-o-Y Growth (%) Projections by Vertical Type, 2023 to 2033 Figure 55: North America Market Attractiveness by Deployment Models, 2023 to 2033 Figure 56: North America Market Attractiveness by Service Type, 2023 to 2033 Figure 57: North America Market Attractiveness by Solution Type, 2023 to 2033 Figure 58: North America Market Attractiveness by Enterprise Size, 2023 to 2033 Figure 59: North America Market Attractiveness by Vertical Type, 2023 to 2033 Figure 60: North America Market Attractiveness by Country, 2023 to 2033 Figure 61: Latin America Market Value (US$ Million) by Deployment Models, 2023 to 2033 Figure 62: Latin America Market Value (US$ Million) by Service Type, 2023 to 2033 Figure 63: Latin America Market Value (US$ Million) by Solution Type, 2023 to 2033 Figure 64: Latin America Market Value (US$ Million) by Enterprise Size, 2023 to 2033 Figure 65: Latin America Market Value (US$ Million) by Vertical Type, 2023 to 2033 Figure 66: Latin America Market Value (US$ Million) by Country, 2023 to 2033 Figure 67: Latin America Market Value (US$ Million) Analysis by Country, 2018 to 2033 Figure 68: Latin America Market Value Share (%) and BPS Analysis by Country, 2023 to 2033 Figure 69: Latin America Market Y-o-Y Growth (%) Projections by Country, 2023 to 2033 Figure 70: Latin America Market Value (US$ Million) Analysis by Deployment Models, 2018 to 2033 Figure 71: Latin America Market Value Share (%) and BPS Analysis by Deployment Models, 2023 to 2033 Figure 72: Latin America Market Y-o-Y Growth (%) Projections by Deployment Models, 2023 to 2033 Figure 73: Latin America Market Value (US$ Million) Analysis by Service Type, 2018 to 2033 Figure 74: Latin America Market Value Share (%) and BPS Analysis by Service Type, 2023 to 2033 Figure 75: Latin America Market Y-o-Y Growth (%) Projections by Service Type, 2023 to 2033 Figure 76: Latin America Market Value (US$ Million) Analysis by Solution Type, 2018 to 2033 Figure 77: Latin America Market Value Share (%) and BPS Analysis by Solution Type, 2023 to 2033 Figure 78: Latin America Market Y-o-Y Growth (%) Projections by Solution Type, 2023 to 2033 Figure 79: Latin America Market Value (US$ Million) Analysis by Enterprise Size, 2018 to 2033 Figure 80: Latin America Market Value Share (%) and BPS Analysis by Enterprise Size, 2023 to 2033 Figure 81: Latin America Market Y-o-Y Growth (%) Projections by Enterprise Size, 2023 to 2033 Figure 82: Latin America Market Value (US$ Million) Analysis by Vertical Type, 2018 to 2033 Figure 83: Latin America Market Value Share (%) and BPS Analysis by Vertical Type, 2023 to 2033 Figure 84: Latin America Market Y-o-Y Growth (%) Projections by Vertical Type, 2023 to 2033 Figure 85: Latin America Market Attractiveness by Deployment Models, 2023 to 2033 Figure 86: Latin America Market Attractiveness by Service Type, 2023 to 2033 Figure 87: Latin America Market Attractiveness by Solution Type, 2023 to 2033 Figure 88: Latin America Market Attractiveness by Enterprise Size, 2023 to 2033 Figure 89: Latin America Market Attractiveness by Vertical Type, 2023 to 2033 Figure 90: Latin America Market Attractiveness by Country, 2023 to 2033 Figure 91: Western Europe Market Value (US$ Million) by Deployment Models, 2023 to 2033 Figure 92: Western Europe Market Value (US$ Million) by Service Type, 2023 to 2033 Figure 93: Western Europe Market Value (US$ Million) by Solution Type, 2023 to 2033 Figure 94: Western Europe Market Value (US$ Million) by Enterprise Size, 2023 to 2033 Figure 95: Western Europe Market Value (US$ Million) by Vertical Type, 2023 to 2033 Figure 96: Western Europe Market Value (US$ Million) by Country, 2023 to 2033 Figure 97: Western Europe Market Value (US$ Million) Analysis by Country, 2018 to 2033 Figure 98: Western Europe Market Value Share (%) and BPS Analysis by Country, 2023 to 2033 Figure 99: Western Europe Market Y-o-Y Growth (%) Projections by Country, 2023 to 2033 Figure 100: Western Europe Market Value (US$ Million) Analysis by Deployment Models, 2018 to 2033 Figure 101: Western Europe Market Value Share (%) and BPS Analysis by Deployment Models, 2023 to 2033 Figure 102: Western Europe Market Y-o-Y Growth (%) Projections by Deployment Models, 2023 to 2033 Figure 103: Western Europe Market Value (US$ Million) Analysis by Service Type, 2018 to 2033 Figure 104: Western Europe Market Value Share (%) and BPS Analysis by Service Type, 2023 to 2033 Figure 105: Western Europe Market Y-o-Y Growth (%) Projections by Service Type, 2023 to 2033 Figure 106: Western Europe Market Value (US$ Million) Analysis by Solution Type, 2018 to 2033 Figure 107: Western Europe Market Value Share (%) and BPS Analysis by Solution Type, 2023 to 2033 Figure 108: Western Europe Market Y-o-Y Growth (%) Projections by Solution Type, 2023 to 2033 Figure 109: Western Europe Market Value (US$ Million) Analysis by Enterprise Size, 2018 to 2033 Figure 110: Western Europe Market Value Share (%) and BPS Analysis by Enterprise Size, 2023 to 2033 Figure 111: Western Europe Market Y-o-Y Growth (%) Projections by Enterprise Size, 2023 to 2033 Figure 112: Western Europe Market Value (US$ Million) Analysis by Vertical Type, 2018 to 2033 Figure 113: Western Europe Market Value Share (%) and BPS Analysis by Vertical Type, 2023 to 2033 Figure 114: Western Europe Market Y-o-Y Growth (%) Projections by Vertical Type, 2023 to 2033 Figure 115: Western Europe Market Attractiveness by Deployment Models, 2023 to 2033 Figure 116: Western Europe Market Attractiveness by Service Type, 2023 to 2033 Figure 117: Western Europe Market Attractiveness by Solution Type, 2023 to 2033 Figure 118: Western Europe Market Attractiveness by Enterprise Size, 2023 to 2033 Figure 119: Western Europe Market Attractiveness by Vertical Type, 2023 to 2033 Figure 120: Western Europe Market Attractiveness by Country, 2023 to 2033 Figure 121: Eastern Europe Market Value (US$ Million) by Deployment Models, 2023 to 2033 Figure 122: Eastern Europe Market Value (US$ Million) by Service Type, 2023 to 2033 Figure 123: Eastern Europe Market Value (US$ Million) by Solution Type, 2023 to 2033 Figure 124: Eastern Europe Market Value (US$ Million) by Enterprise Size, 2023 to 2033 Figure 125: Eastern Europe Market Value (US$ Million) by Vertical Type, 2023 to 2033 Figure 126: Eastern Europe Market Value (US$ Million) by Country, 2023 to 2033 Figure 127: Eastern Europe Market Value (US$ Million) Analysis by Country, 2018 to 2033 Figure 128: Eastern Europe Market Value Share (%) and BPS Analysis by Country, 2023 to 2033 Figure 129: Eastern Europe Market Y-o-Y Growth (%) Projections by Country, 2023 to 2033 Figure 130: Eastern Europe Market Value (US$ Million) Analysis by Deployment Models, 2018 to 2033 Figure 131: Eastern Europe Market Value Share (%) and BPS Analysis by Deployment Models, 2023 to 2033 Figure 132: Eastern Europe Market Y-o-Y Growth (%) Projections by Deployment Models, 2023 to 2033 Figure 133: Eastern Europe Market Value (US$ Million) Analysis by Service Type, 2018 to 2033 Figure 134: Eastern Europe Market Value Share (%) and BPS Analysis by Service Type, 2023 to 2033 Figure 135: Eastern Europe Market Y-o-Y Growth (%) Projections by Service Type, 2023 to 2033 Figure 136: Eastern Europe Market Value (US$ Million) Analysis by Solution Type, 2018 to 2033 Figure 137: Eastern Europe Market Value Share (%) and BPS Analysis by Solution Type, 2023 to 2033 Figure 138: Eastern Europe Market Y-o-Y Growth (%) Projections by Solution Type, 2023 to 2033 Figure 139: Eastern Europe Market Value (US$ Million) Analysis by Enterprise Size, 2018 to 2033 Figure 140: Eastern Europe Market Value Share (%) and BPS Analysis by Enterprise Size, 2023 to 2033 Figure 141: Eastern Europe Market Y-o-Y Growth (%) Projections by Enterprise Size, 2023 to 2033 Figure 142: Eastern Europe Market Value (US$ Million) Analysis by Vertical Type, 2018 to 2033 Figure 143: Eastern Europe Market Value Share (%) and BPS Analysis by Vertical Type, 2023 to 2033 Figure 144: Eastern Europe Market Y-o-Y Growth (%) Projections by Vertical Type, 2023 to 2033 Figure 145: Eastern Europe Market Attractiveness by Deployment Models, 2023 to 2033 Figure 146: Eastern Europe Market Attractiveness by Service Type, 2023 to 2033 Figure 147: Eastern Europe Market Attractiveness by Solution Type, 2023 to 2033 Figure 148: Eastern Europe Market Attractiveness by Enterprise Size, 2023 to 2033 Figure 149: Eastern Europe Market Attractiveness by Vertical Type, 2023 to 2033 Figure 150: Eastern Europe Market Attractiveness by Country, 2023 to 2033 Figure 151: South Asia and Pacific Market Value (US$ Million) by Deployment Models, 2023 to 2033 Figure 152: South Asia and Pacific Market Value (US$ Million) by Service Type, 2023 to 2033 Figure 153: South Asia and Pacific Market Value (US$ Million) by Solution Type, 2023 to 2033 Figure 154: South Asia and Pacific Market Value (US$ Million) by Enterprise Size, 2023 to 2033 Figure 155: South Asia and Pacific Market Value (US$ Million) by Vertical Type, 2023 to 2033 Figure 156: South Asia and Pacific Market Value (US$ Million) by Country, 2023 to 2033 Figure 157: South Asia and Pacific Market Value (US$ Million) Analysis by Country, 2018 to 2033 Figure 158: South Asia and Pacific Market Value Share (%) and BPS Analysis by Country, 2023 to 2033 Figure 159: South Asia and Pacific Market Y-o-Y Growth (%) Projections by Country, 2023 to 2033 Figure 160: South Asia and Pacific Market Value (US$ Million) Analysis by Deployment Models, 2018 to 2033 Figure 161: South Asia and Pacific Market Value Share (%) and BPS Analysis by Deployment Models, 2023 to 2033 Figure 162: South Asia and Pacific Market Y-o-Y Growth (%) Projections by Deployment Models, 2023 to 2033 Figure 163: South Asia and Pacific Market Value (US$ Million) Analysis by Service Type, 2018 to 2033 Figure 164: South Asia and Pacific Market Value Share (%) and BPS Analysis by Service Type, 2023 to 2033 Figure 165: South Asia and Pacific Market Y-o-Y Growth (%) Projections by Service Type, 2023 to 2033 Figure 166: South Asia and Pacific Market Value (US$ Million) Analysis by Solution Type, 2018 to 2033 Figure 167: South Asia and Pacific Market Value Share (%) and BPS Analysis by Solution Type, 2023 to 2033 Figure 168: South Asia and Pacific Market Y-o-Y Growth (%) Projections by Solution Type, 2023 to 2033 Figure 169: South Asia and Pacific Market Value (US$ Million) Analysis by Enterprise Size, 2018 to 2033 Figure 170: South Asia and Pacific Market Value Share (%) and BPS Analysis by Enterprise Size, 2023 to 2033 Figure 171: South Asia and Pacific Market Y-o-Y Growth (%) Projections by Enterprise Size, 2023 to 2033 Figure 172: South Asia and Pacific Market Value (US$ Million) Analysis by Vertical Type, 2018 to 2033 Figure 173: South Asia and Pacific Market Value Share (%) and BPS Analysis by Vertical Type, 2023 to 2033 Figure 174: South Asia and Pacific Market Y-o-Y Growth (%) Projections by Vertical Type, 2023 to 2033 Figure 175: South Asia and Pacific Market Attractiveness by Deployment Models, 2023 to 2033 Figure 176: South Asia and Pacific Market Attractiveness by Service Type, 2023 to 2033 Figure 177: South Asia and Pacific Market Attractiveness by Solution Type, 2023 to 2033 Figure 178: South Asia and Pacific Market Attractiveness by Enterprise Size, 2023 to 2033 Figure 179: South Asia and Pacific Market Attractiveness by Vertical Type, 2023 to 2033 Figure 180: South Asia and Pacific Market Attractiveness by Country, 2023 to 2033 Figure 181: East Asia Market Value (US$ Million) by Deployment Models, 2023 to 2033 Figure 182: East Asia Market Value (US$ Million) by Service Type, 2023 to 2033 Figure 183: East Asia Market Value (US$ Million) by Solution Type, 2023 to 2033 Figure 184: East Asia Market Value (US$ Million) by Enterprise Size, 2023 to 2033 Figure 185: East Asia Market Value (US$ Million) by Vertical Type, 2023 to 2033 Figure 186: East Asia Market Value (US$ Million) by Country, 2023 to 2033 Figure 187: East Asia Market Value (US$ Million) Analysis by Country, 2018 to 2033 Figure 188: East Asia Market Value Share (%) and BPS Analysis by Country, 2023 to 2033 Figure 189: East Asia Market Y-o-Y Growth (%) Projections by Country, 2023 to 2033 Figure 190: East Asia Market Value (US$ Million) Analysis by Deployment Models, 2018 to 2033 Figure 191: East Asia Market Value Share (%) and BPS Analysis by Deployment Models, 2023 to 2033 Figure 192: East Asia Market Y-o-Y Growth (%) Projections by Deployment Models, 2023 to 2033 Figure 193: East Asia Market Value (US$ Million) Analysis by Service Type, 2018 to 2033 Figure 194: East Asia Market Value Share (%) and BPS Analysis by Service Type, 2023 to 2033 Figure 195: East Asia Market Y-o-Y Growth (%) Projections by Service Type, 2023 to 2033 Figure 196: East Asia Market Value (US$ Million) Analysis by Solution Type, 2018 to 2033 Figure 197: East Asia Market Value Share (%) and BPS Analysis by Solution Type, 2023 to 2033 Figure 198: East Asia Market Y-o-Y Growth (%) Projections by Solution Type, 2023 to 2033 Figure 199: East Asia Market Value (US$ Million) Analysis by Enterprise Size, 2018 to 2033 Figure 200: East Asia Market Value Share (%) and BPS Analysis by Enterprise Size, 2023 to 2033 Figure 201: East Asia Market Y-o-Y Growth (%) Projections by Enterprise Size, 2023 to 2033 Figure 202: East Asia Market Value (US$ Million) Analysis by Vertical Type, 2018 to 2033 Figure 203: East Asia Market Value Share (%) and BPS Analysis by Vertical Type, 2023 to 2033 Figure 204: East Asia Market Y-o-Y Growth (%) Projections by Vertical Type, 2023 to 2033 Figure 205: East Asia Market Attractiveness by Deployment Models, 2023 to 2033 Figure 206: East Asia Market Attractiveness by Service Type, 2023 to 2033 Figure 207: East Asia Market Attractiveness by Solution Type, 2023 to 2033 Figure 208: East Asia Market Attractiveness by Enterprise Size, 2023 to 2033 Figure 209: East Asia Market Attractiveness by Vertical Type, 2023 to 2033 Figure 210: East Asia Market Attractiveness by Country, 2023 to 2033 Figure 211: Middle East and Africa Market Value (US$ Million) by Deployment Models, 2023 to 2033 Figure 212: Middle East and Africa Market Value (US$ Million) by Service Type, 2023 to 2033 Figure 213: Middle East and Africa Market Value (US$ Million) by Solution Type, 2023 to 2033 Figure 214: Middle East and Africa Market Value (US$ Million) by Enterprise Size, 2023 to 2033 Figure 215: Middle East and Africa Market Value (US$ Million) by Vertical Type, 2023 to 2033 Figure 216: Middle East and Africa Market Value (US$ Million) by Country, 2023 to 2033 Figure 217: Middle East and Africa Market Value (US$ Million) Analysis by Country, 2018 to 2033 Figure 218: Middle East and Africa Market Value Share (%) and BPS Analysis by Country, 2023 to 2033 Figure 219: Middle East and Africa Market Y-o-Y Growth (%) Projections by Country, 2023 to 2033 Figure 220: Middle East and Africa Market Value (US$ Million) Analysis by Deployment Models, 2018 to 2033 Figure 221: Middle East and Africa Market Value Share (%) and BPS Analysis by Deployment Models, 2023 to 2033 Figure 222: Middle East and Africa Market Y-o-Y Growth (%) Projections by Deployment Models, 2023 to 2033 Figure 223: Middle East and Africa Market Value (US$ Million) Analysis by Service Type, 2018 to 2033 Figure 224: Middle East and Africa Market Value Share (%) and BPS Analysis by Service Type, 2023 to 2033 Figure 225: Middle East and Africa Market Y-o-Y Growth (%) Projections by Service Type, 2023 to 2033 Figure 226: Middle East and Africa Market Value (US$ Million) Analysis by Solution Type, 2018 to 2033 Figure 227: Middle East and Africa Market Value Share (%) and BPS Analysis by Solution Type, 2023 to 2033 Figure 228: Middle East and Africa Market Y-o-Y Growth (%) Projections by Solution Type, 2023 to 2033 Figure 229: Middle East and Africa Market Value (US$ Million) Analysis by Enterprise Size, 2018 to 2033 Figure 230: Middle East and Africa Market Value Share (%) and BPS Analysis by Enterprise Size, 2023 to 2033 Figure 231: Middle East and Africa Market Y-o-Y Growth (%) Projections by Enterprise Size, 2023 to 2033 Figure 232: Middle East and Africa Market Value (US$ Million) Analysis by Vertical Type, 2018 to 2033 Figure 233: Middle East and Africa Market Value Share (%) and BPS Analysis by Vertical Type, 2023 to 2033 Figure 234: Middle East and Africa Market Y-o-Y Growth (%) Projections by Vertical Type, 2023 to 2033 Figure 235: Middle East and Africa Market Attractiveness by Deployment Models, 2023 to 2033 Figure 236: Middle East and Africa Market Attractiveness by Service Type, 2023 to 2033 Figure 237: Middle East and Africa Market Attractiveness by Solution Type, 2023 to 2033 Figure 238: Middle East and Africa Market Attractiveness by Enterprise Size, 2023 to 2033 Figure 239: Middle East and Africa Market Attractiveness by Vertical Type, 2023 to 2033 Figure 240: Middle East and Africa Market Attractiveness by Country, 2023 to 2033
Recommendations
Explore Technology Insights
View Reports