Cloud Printing Services Market Snapshot (2023 to 2033)

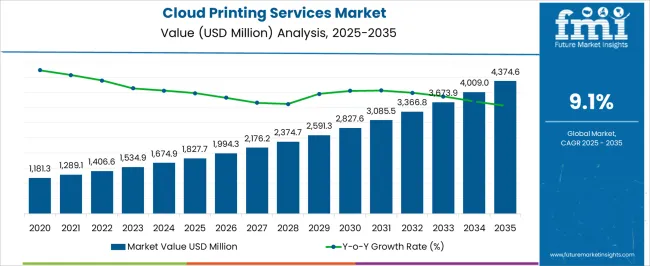
The global cloud printing services market is anticipated to be valued at USD 1,521.5 million in 2023, forecast to grow at a CAGR of 11.7% to be valued at USD 4,614.1 million from 2023 to 2033. From 2018 to 2022 a CAGR of 9.6% was registered for the biscuit mixes market.

Data Points Key Statistics
Growth Rate (2018 to 2022) 9.6% CAGR
Expected Market Value (2023) USD 1,521.5 million
Anticipated Forecast Value (2033) USD 4,614.1 million
Projected Growth Rate (2023 to 2033) 11.7% CAGR

Cloud printing enables businesses to satisfy print-on-demand requirements while also lowering printing costs and eliminating the need to purchase, deploy, and manage gear and software. Cloud printing services save time by allowing users to instantly locate a printer and print from their own device without the need for driver installation.

Cloud printing connects printer units to computers, smartphones, tablets, and workstations. It has eliminated conventional printing hurdles such as software driver issues, compatibility concerns, and device connectivity issues.

Also, cloud printing reduced printing costs and the need to buy, deploy, and manage hardware and software. Cloud printing services save time by quickly finding a printer and printing from one’s own device without the need to set up driver installations.

Cloud Printing Services Demand Analysis (2018 to 2022) Vs Market Outlook (2023 to 2033)

The global demand for cloud printing services is projected to increase at a CAGR of 11.7% during the forecast period between 2023 and 2033, reaching a total of USD 4,614.1.0 million in 2033, according to a report from Future Market Insights (FMI). From 2018 to 2022, sales witnessed significant growth, registering a CAGR of 9.6%.

Cloud printing allows users to connect any digital device to a printing station via network connectivity such as wi-fi, Bluetooth, TCP-IP, and many more, allowing them to print papers and other items on a device to the cloud. This aspect of cloud printing allows for greater flexibility inside the corporate premises.

Cloud printing eliminates the need for customers to invest in in-house servers, hardware, and software for document printing or other purposes, lowering the cost of deploying, maintaining, and replacing gear and software.

These assist firms or enterprises in lowering their operating and capital expenditures. It gives consumers control over printing and delivers rapid and efficient printing, which helps to decrease paper waste and carbon emissions.

Many cloud printing service providers give service level agreements that ensure year-round 24/7 availability, which helps to decrease downtime and issues. Geographical restrictions and physical linkages, which were previously necessary, have been eliminated by new cloud printing technology.

Printing critical papers, photos, PDFs, and other files from anywhere and at any time is possible by sending a print request from their digital devices via cloud technology, which is projected to enhance the industry in the near future.

Which are Some Prominent Drivers of Cloud Printing Services Market?

Increasing Penetration of Mobile Devices to Boost Market Growth

The increased usage of cloud printing services in small and medium-sized businesses also contributes to market development. With increased business efficiency and the penetration of mobile devices, the mobile workforce is expanding, needing continual and secure internet connection as well as a decrease in infrastructure maintenance expenses. These are some of the primary drivers of the cloud printing services industry.

Cloud printing services are extensively utilised in numerous end-user industries such as information technology, healthcare, education, hospitality, manufacturing, logistics & transportation, government, financial services, telecommunication, and others due to its flexibility.

What are the Challenges Faced by the Cloud Printing Services Market?

Privacy Concerns to Hinder Market Growth

Despite the fact that the cloud printing services market offers multiple end-uses, there are numerous barriers to market expansion. The cloud printing services industry is constrained by data-protection difficulties, privacy concerns, and management that necessitates thorough reporting on user activity.

The most significant obstacle to the cloud printing services market is constantly changing technology and platforms, which may impede market growth.

Another factor that is expected to negatively influence the growth of the cloud printing services market over the forecast period is a lack of understanding of the operational effectiveness and other benefits of technologically sophisticated systems.

Cloud printing services, such as a LAN or WAN, need a powerful internet connection. Inadequate network infrastructure in underdeveloped nations may provide a barrier to market expansion.
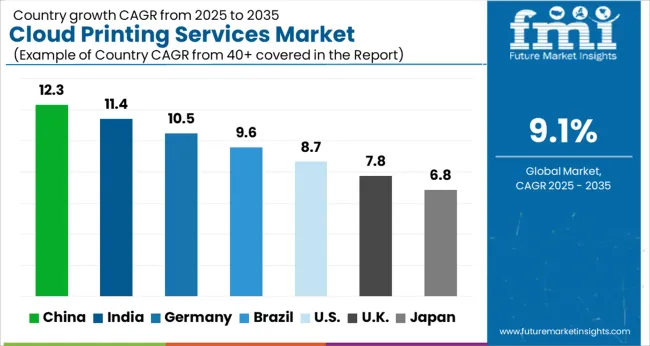
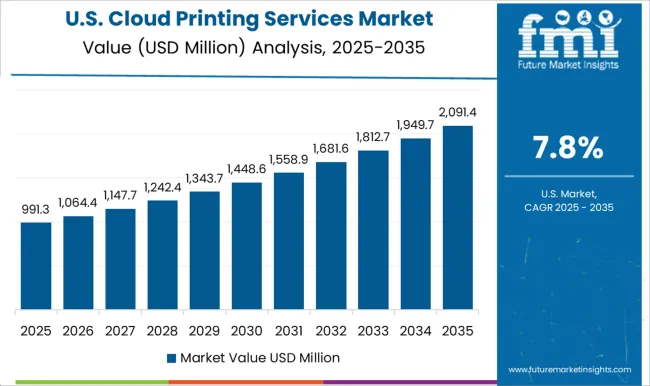
Region-wise Insights

Why is North America emerging as an Opportunistic Market for Cloud Printing Services?

Rapid Technological Progress and a Rising Number of Enterprises to Boost Market Growth

North America was the largest market for cloud printing services, and this trend is likely to continue throughout the projection period due to the region's increasing digitization. The region is expected to account for 36.7% of the cloud printing services market.

North America is predicted to be the next dominating region with strong adoption rates for the cloud printing services market. With rapid technological progress and a rising number of enterprises in North America, the region's need for cloud printing services is expected to expand. Furthermore, rising sales of mobile phones, tablets, and laptops in the area contribute to the market's expansion.
What Role Does Europe Play in the Growth of the Cloud Printing Services Market?

The Presence of Well-Known Cloud Printing Services Market Manufacturers to Widen Growth Prospects

According to Future Market Insights, due to the region's expanding business sector, Europe is predicted to create enormous potential prospects for the cloud printing services market. The market for cloud printing services is predicted to increase steadily throughout the forecast period.

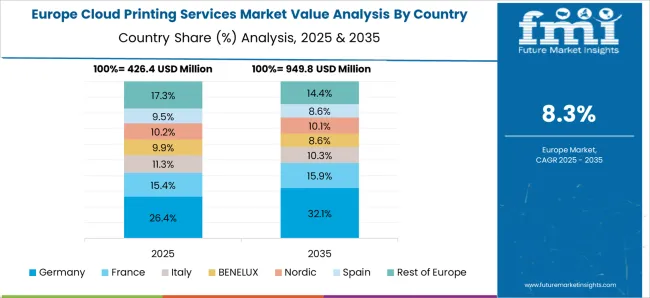
Europe accounts for 17.9% of the worldwide market for cloud printing services. The number of organisations and enterprises in the country is expanding as technology investments increase. The presence of well-known cloud printing services market manufacturers and providers boosts Europe's cloud printing services industry as well.

Category-Wise Insights

Which Cloud Type is Preferred in the Cloud Printing Services Market?

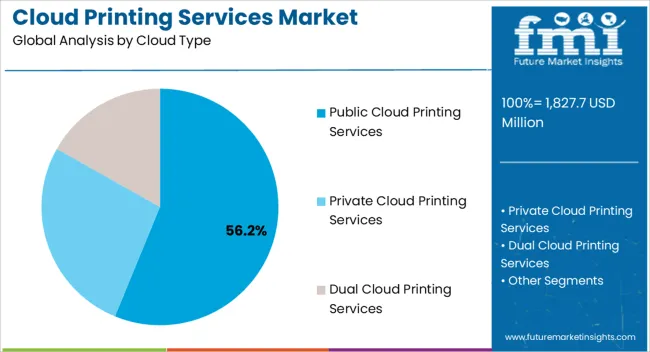
Public Cloud Printing Services Remains the Most Preferred Cloud Type in the Market

The public cloud printing services segment led the worldwide cloud services market share by cloud type in 2020 and is likely to retain its dominance in the following years. This is mostly owing to the fact that the public cloud printing services category is the most often used cloud type due to its ease of use and low cost.

However, the private cloud printing services segment is likely to develop the fastest, as private firms use cloud services to build assets. Thus, by cloud type, public cloud printing services are expected to hold 30% market share in 2022 for cloud printing services market.

Which Vertical Accounts for Maximum Sales of Cloud Printing Services Market?

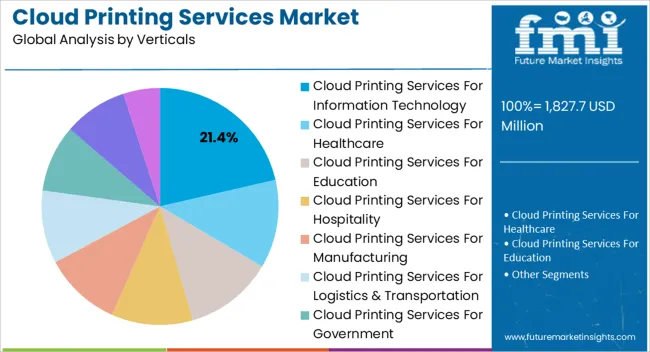
Information Technology Segment to Have the Highest Demand

The information technology segment is projected to use cloud printing services on a significant scale because cloud printing services increase company cooperation and allow team members to share information simply and securely.

In addition, the cloud provides the security of quick data recovery and huge data centres capable of failover in the event of outages. Thus, by vertical, information technology segment is expected to hold 20% market share for cloud printing services market in the forecast period 2023 to 2033.

Start-Ups For Cloud Printing Services Market

UniPrint Infinity, Printix, pharos Xerox, AirPrint, and Lexmark are some of the startup firms in the cloud printing services sector. Given the rising reliance on cloud-based platforms, particularly in the last two years, organisations are searching for effective solutions to assure business operations continuity.
  • In April 2022, Printix became an official partner of a well-known international FTSE 250 engineering firm to streamline its cloud-based print management processes. This was in reaction to the Microsoft Spool Service Print Nightmare vulnerability. The flaw underlines the age-old dilemma of security vs. usability. This appropriately called security bug affects Windows 7 and later, creating a potentially exploitable breach in an organization's infrastructure.
  • On June 29th, 2022, Pharos Xerox released a new version of the Pharos Cloud that included significant improvements. These include, among other things, delegate printing, which allows users to print documents on behalf of others for Secure Release processes; improvements to the MS Universal Print Integration for Pharos Secure release; and policy print reporting for Pharos Insights.

Market Competition

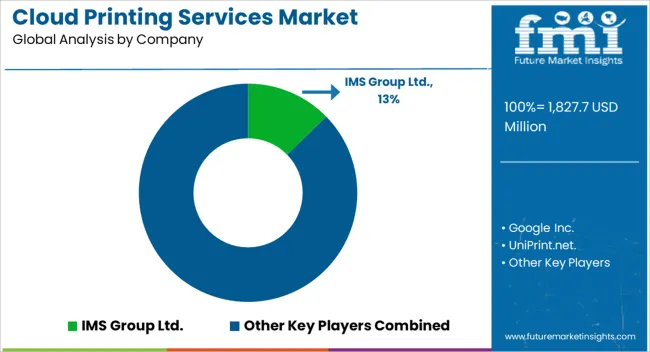
IMS Group Ltd., Google Inc., UniPrint.net, Kyocera International, Inc., ezeep GmbH, Genius Bytes Software Solutions, Cortado Inc., and Cirrato Technologies AB are some of the main players in the worldwide cloud printing services market.

Because of the large number of competitors, the market is extremely competitive. While global giants such as IMS Group Ltd., Google Inc., and UniPrint.net command a sizable market share, various regional players are also active in important development regions, notably Asia Pacific.

  • In August 2020 - Process Fusion, the creator of UniPrint Infinity and a cloud solution provider for digital transformation, announced today the availability of UniPrint InfinityCloud, their next-generation cloud print management platform, for free to all K-12 (primary and secondary) educational institutions worldwide for student printing.

Recent Developments

  • January 2023: Google Cloud Print is a cloud printing service offered by Google that enabled customers to print files from their PCs and smartphones to printers that are connected to the internet.
  • February 2023: HP PrintOS is a cloud printing solution that lets customers control their printers from anywhere.
  • March 2023: PrinterOn is a cloud printing service that enables customers to print files using their smartphone or tablet to printers that are situated anywhere on the globe.

Report Scope

Report Attributes Details
Market Value in 2023 USD 1,521.5 million
Market Value in 2033 USD 4,614.1.0 million
Growth Rate CAGR of 11.7% from 2023 to 2033
Base Year for Estimation 2022
Historical Data 2018 to 2022
Forecast Period 2023 to 2033
Quantitative Units Revenue in USD million and CAGR from 2023 to 2033
Report Coverage Revenue Forecast, Volume Forecast, Company Ranking, Competitive Landscape, Growth Factors, Trends and Pricing Analysis
Segments Covered

Cloud Type, Platform, Vertical, Region

Regions Covered

North America; Latin America; Europe; Middle East and Africa; Asia Pacific

Key Countries Profiled

United States, Canada, Brazil, Argentina, Germany, United Kingdom, France, Spain, Italy, China, Japan, South Korea, Australia, GCC, South Africa, Israel

Key Companies Profiled

IMS Group Ltd.; Google Inc.; UniPrint.net.; Kyocera International, Inc.; ezeep GmbH; Genius Bytes Software Solutions; Cortado Inc.; Levi Ray & Shoup

Customization Available Upon Request

Key Segments Profiled In The Cloud Printing Services Industry Survey

Cloud Printing Services Market by Cloud Type:

  • Public Cloud Printing Services
  • Private Cloud Printing Services
  • Dual Cloud Printing Services

Cloud Printing Services Market by Platform:

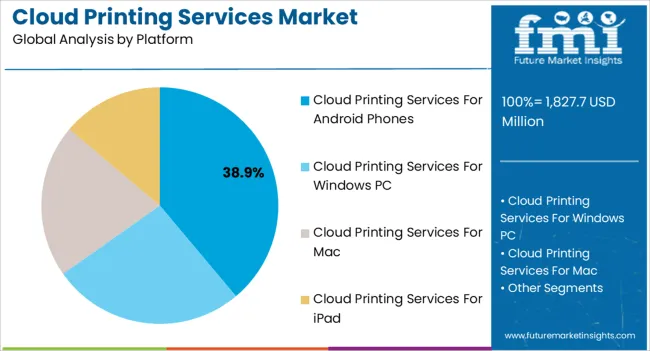
  • Cloud Printing Services for Android Phones
  • Cloud Printing Services for Windows PC
  • Cloud Printing Services for Mac
  • Cloud Printing Services for iPad

Cloud Printing Services Market by Verticals:

  • Cloud Printing Services for Information Technology
  • Cloud Printing Services for Healthcare
  • Cloud Printing Services for Education
  • Cloud Printing Services for Hospitality
  • Cloud Printing Services for Manufacturing
  • Cloud Printing Services for Logistics & Transportation
  • Cloud Printing Services for Government
  • Cloud Printing Services for Financial Services
  • Cloud Printing Services for Telecommunication

Cloud Printing Services Market by Region:

  • North America Cloud Printing Services Market
  • Latin America Cloud Printing Services Market
  • Europe Cloud Printing Services Market
  • Middle East & Africa Cloud Printing Services Market
  • Asia Pacific Cloud Printing Services Market

Table of Content

  • 1. Executive Summary
  • 2. Market Overview
  • 3. Market Background
  • 4. Global Market Analysis 2018 to 2022 and Forecast, 2023 to 2033
  • 5. Global Market Analysis 2018 to 2022 and Forecast 2023 to 2033, By Cloud Type
    • 5.1. Public
    • 5.2. Private
    • 5.3. Dual
  • 6. Global Market Analysis 2018 to 2022 and Forecast 2023 to 2033, By Platform
    • 6.1. Android Phones
    • 6.2. Windows PC
    • 6.3. Mac
    • 6.4. iPad
  • 7. Global Market Analysis 2018 to 2022 and Forecast 2023 to 2033, By Verticals
    • 7.1. Information Technology
    • 7.2. Healthcare
    • 7.3. Education
    • 7.4. Hospitality
    • 7.5. Manufacturing
    • 7.6. Logistics & Transportation
    • 7.7. Government
    • 7.8. Financial Services
    • 7.9. Telecommunication
  • 8. Global Market Analysis 2018 to 2022 and Forecast 2023 to 2033, By Region
    • 8.1. North America
    • 8.2. Latin America
    • 8.3. Western Europe
    • 8.4. Eastern Europe
    • 8.5. South Asia and Pacific
    • 8.6. East Asia
    • 8.7. Middle East and Africa
  • 9. North America Market Analysis 2018 to 2022 and Forecast 2023 to 2033, By Country
  • 10. Latin America Market Analysis 2018 to 2022 and Forecast 2023 to 2033, By Country
  • 11. Western Europe Market Analysis 2018 to 2022 and Forecast 2023 to 2033, By Country
  • 12. Eastern Europe Market Analysis 2018 to 2022 and Forecast 2023 to 2033, By Country
  • 13. South Asia and Pacific Market Analysis 2018 to 2022 and Forecast 2023 to 2033, By Country
  • 14. East Asia Market Analysis 2018 to 2022 and Forecast 2023 to 2033, By Country
  • 15. Middle East and Africa Market Analysis 2018 to 2022 and Forecast 2023 to 2033, By Country
  • 16. Key Countries Market Analysis
  • 17. Market Structure Analysis
  • 18. Competition Analysis
    • 18.1. IMS Group Ltd.
    • 18.2. Google Inc.
    • 18.3. UniPrint.net.
    • 18.4. Kyocera International, Inc.
    • 18.5. Ezeep GmbH
    • 18.6. Genius Bytes Software Solutions
    • 18.7. Cortado Inc.
    • 18.8. Levi Ray & Shoup
    • 18.9. Ray & Shoup(cirrato)
    • 18.10. Xerox
  • 19. Assumptions & Acronyms Used
  • 20. Research Methodology

List of Tables

Table 1: Global Market Value (US$ Million) Forecast by Region, 2018 to 2033

Table 2: Global Market Value (US$ Million) Forecast by Cloud Type, 2018 to 2033

Table 3: Global Market Value (US$ Million) Forecast by Platform, 2018 to 2033

Table 4: Global Market Value (US$ Million) Forecast by Verticals , 2018 to 2033

Table 5: North America Market Value (US$ Million) Forecast by Country, 2018 to 2033

Table 6: North America Market Value (US$ Million) Forecast by Cloud Type, 2018 to 2033

Table 7: North America Market Value (US$ Million) Forecast by Platform, 2018 to 2033

Table 8: North America Market Value (US$ Million) Forecast by Verticals , 2018 to 2033

Table 9: Latin America Market Value (US$ Million) Forecast by Country, 2018 to 2033

Table 10: Latin America Market Value (US$ Million) Forecast by Cloud Type, 2018 to 2033

Table 11: Latin America Market Value (US$ Million) Forecast by Platform, 2018 to 2033

Table 12: Latin America Market Value (US$ Million) Forecast by Verticals , 2018 to 2033

Table 13: Western Europe Market Value (US$ Million) Forecast by Country, 2018 to 2033

Table 14: Western Europe Market Value (US$ Million) Forecast by Cloud Type, 2018 to 2033

Table 15: Western Europe Market Value (US$ Million) Forecast by Platform, 2018 to 2033

Table 16: Western Europe Market Value (US$ Million) Forecast by Verticals , 2018 to 2033

Table 17: Eastern Europe Market Value (US$ Million) Forecast by Country, 2018 to 2033

Table 18: Eastern Europe Market Value (US$ Million) Forecast by Cloud Type, 2018 to 2033

Table 19: Eastern Europe Market Value (US$ Million) Forecast by Platform, 2018 to 2033

Table 20: Eastern Europe Market Value (US$ Million) Forecast by Verticals , 2018 to 2033

Table 21: South Asia and Pacific Market Value (US$ Million) Forecast by Country, 2018 to 2033

Table 22: South Asia and Pacific Market Value (US$ Million) Forecast by Cloud Type, 2018 to 2033

Table 23: South Asia and Pacific Market Value (US$ Million) Forecast by Platform, 2018 to 2033

Table 24: South Asia and Pacific Market Value (US$ Million) Forecast by Verticals , 2018 to 2033

Table 25: East Asia Market Value (US$ Million) Forecast by Country, 2018 to 2033

Table 26: East Asia Market Value (US$ Million) Forecast by Cloud Type, 2018 to 2033

Table 27: East Asia Market Value (US$ Million) Forecast by Platform, 2018 to 2033

Table 28: East Asia Market Value (US$ Million) Forecast by Verticals , 2018 to 2033

Table 29: Middle East and Africa Market Value (US$ Million) Forecast by Country, 2018 to 2033

Table 30: Middle East and Africa Market Value (US$ Million) Forecast by Cloud Type, 2018 to 2033

Table 31: Middle East and Africa Market Value (US$ Million) Forecast by Platform, 2018 to 2033

Table 32: Middle East and Africa Market Value (US$ Million) Forecast by Verticals , 2018 to 2033

List of Figures

Figure 1: Global Market Value (US$ Million) by Cloud Type, 2023 to 2033

Figure 2: Global Market Value (US$ Million) by Platform, 2023 to 2033

Figure 3: Global Market Value (US$ Million) by Verticals , 2023 to 2033

Figure 4: Global Market Value (US$ Million) by Region, 2023 to 2033

Figure 5: Global Market Value (US$ Million) Analysis by Region, 2018 to 2033

Figure 6: Global Market Value Share (%) and BPS Analysis by Region, 2023 to 2033

Figure 7: Global Market Y-o-Y Growth (%) Projections by Region, 2023 to 2033

Figure 8: Global Market Value (US$ Million) Analysis by Cloud Type, 2018 to 2033

Figure 9: Global Market Value Share (%) and BPS Analysis by Cloud Type, 2023 to 2033

Figure 10: Global Market Y-o-Y Growth (%) Projections by Cloud Type, 2023 to 2033

Figure 11: Global Market Value (US$ Million) Analysis by Platform, 2018 to 2033

Figure 12: Global Market Value Share (%) and BPS Analysis by Platform, 2023 to 2033

Figure 13: Global Market Y-o-Y Growth (%) Projections by Platform, 2023 to 2033

Figure 14: Global Market Value (US$ Million) Analysis by Verticals , 2018 to 2033

Figure 15: Global Market Value Share (%) and BPS Analysis by Verticals , 2023 to 2033

Figure 16: Global Market Y-o-Y Growth (%) Projections by Verticals , 2023 to 2033

Figure 17: Global Market Attractiveness by Cloud Type, 2023 to 2033

Figure 18: Global Market Attractiveness by Platform, 2023 to 2033

Figure 19: Global Market Attractiveness by Verticals , 2023 to 2033

Figure 20: Global Market Attractiveness by Region, 2023 to 2033

Figure 21: North America Market Value (US$ Million) by Cloud Type, 2023 to 2033

Figure 22: North America Market Value (US$ Million) by Platform, 2023 to 2033

Figure 23: North America Market Value (US$ Million) by Verticals , 2023 to 2033

Figure 24: North America Market Value (US$ Million) by Country, 2023 to 2033

Figure 25: North America Market Value (US$ Million) Analysis by Country, 2018 to 2033

Figure 26: North America Market Value Share (%) and BPS Analysis by Country, 2023 to 2033

Figure 27: North America Market Y-o-Y Growth (%) Projections by Country, 2023 to 2033

Figure 28: North America Market Value (US$ Million) Analysis by Cloud Type, 2018 to 2033

Figure 29: North America Market Value Share (%) and BPS Analysis by Cloud Type, 2023 to 2033

Figure 30: North America Market Y-o-Y Growth (%) Projections by Cloud Type, 2023 to 2033

Figure 31: North America Market Value (US$ Million) Analysis by Platform, 2018 to 2033

Figure 32: North America Market Value Share (%) and BPS Analysis by Platform, 2023 to 2033

Figure 33: North America Market Y-o-Y Growth (%) Projections by Platform, 2023 to 2033

Figure 34: North America Market Value (US$ Million) Analysis by Verticals , 2018 to 2033

Figure 35: North America Market Value Share (%) and BPS Analysis by Verticals , 2023 to 2033

Figure 36: North America Market Y-o-Y Growth (%) Projections by Verticals , 2023 to 2033

Figure 37: North America Market Attractiveness by Cloud Type, 2023 to 2033

Figure 38: North America Market Attractiveness by Platform, 2023 to 2033

Figure 39: North America Market Attractiveness by Verticals , 2023 to 2033

Figure 40: North America Market Attractiveness by Country, 2023 to 2033

Figure 41: Latin America Market Value (US$ Million) by Cloud Type, 2023 to 2033

Figure 42: Latin America Market Value (US$ Million) by Platform, 2023 to 2033

Figure 43: Latin America Market Value (US$ Million) by Verticals , 2023 to 2033

Figure 44: Latin America Market Value (US$ Million) by Country, 2023 to 2033

Figure 45: Latin America Market Value (US$ Million) Analysis by Country, 2018 to 2033

Figure 46: Latin America Market Value Share (%) and BPS Analysis by Country, 2023 to 2033

Figure 47: Latin America Market Y-o-Y Growth (%) Projections by Country, 2023 to 2033

Figure 48: Latin America Market Value (US$ Million) Analysis by Cloud Type, 2018 to 2033

Figure 49: Latin America Market Value Share (%) and BPS Analysis by Cloud Type, 2023 to 2033

Figure 50: Latin America Market Y-o-Y Growth (%) Projections by Cloud Type, 2023 to 2033

Figure 51: Latin America Market Value (US$ Million) Analysis by Platform, 2018 to 2033

Figure 52: Latin America Market Value Share (%) and BPS Analysis by Platform, 2023 to 2033

Figure 53: Latin America Market Y-o-Y Growth (%) Projections by Platform, 2023 to 2033

Figure 54: Latin America Market Value (US$ Million) Analysis by Verticals , 2018 to 2033

Figure 55: Latin America Market Value Share (%) and BPS Analysis by Verticals , 2023 to 2033

Figure 56: Latin America Market Y-o-Y Growth (%) Projections by Verticals , 2023 to 2033

Figure 57: Latin America Market Attractiveness by Cloud Type, 2023 to 2033

Figure 58: Latin America Market Attractiveness by Platform, 2023 to 2033

Figure 59: Latin America Market Attractiveness by Verticals , 2023 to 2033

Figure 60: Latin America Market Attractiveness by Country, 2023 to 2033

Figure 61: Western Europe Market Value (US$ Million) by Cloud Type, 2023 to 2033

Figure 62: Western Europe Market Value (US$ Million) by Platform, 2023 to 2033

Figure 63: Western Europe Market Value (US$ Million) by Verticals , 2023 to 2033

Figure 64: Western Europe Market Value (US$ Million) by Country, 2023 to 2033

Figure 65: Western Europe Market Value (US$ Million) Analysis by Country, 2018 to 2033

Figure 66: Western Europe Market Value Share (%) and BPS Analysis by Country, 2023 to 2033

Figure 67: Western Europe Market Y-o-Y Growth (%) Projections by Country, 2023 to 2033

Figure 68: Western Europe Market Value (US$ Million) Analysis by Cloud Type, 2018 to 2033

Figure 69: Western Europe Market Value Share (%) and BPS Analysis by Cloud Type, 2023 to 2033

Figure 70: Western Europe Market Y-o-Y Growth (%) Projections by Cloud Type, 2023 to 2033

Figure 71: Western Europe Market Value (US$ Million) Analysis by Platform, 2018 to 2033

Figure 72: Western Europe Market Value Share (%) and BPS Analysis by Platform, 2023 to 2033

Figure 73: Western Europe Market Y-o-Y Growth (%) Projections by Platform, 2023 to 2033

Figure 74: Western Europe Market Value (US$ Million) Analysis by Verticals , 2018 to 2033

Figure 75: Western Europe Market Value Share (%) and BPS Analysis by Verticals , 2023 to 2033

Figure 76: Western Europe Market Y-o-Y Growth (%) Projections by Verticals , 2023 to 2033

Figure 77: Western Europe Market Attractiveness by Cloud Type, 2023 to 2033

Figure 78: Western Europe Market Attractiveness by Platform, 2023 to 2033

Figure 79: Western Europe Market Attractiveness by Verticals , 2023 to 2033

Figure 80: Western Europe Market Attractiveness by Country, 2023 to 2033

Figure 81: Eastern Europe Market Value (US$ Million) by Cloud Type, 2023 to 2033

Figure 82: Eastern Europe Market Value (US$ Million) by Platform, 2023 to 2033

Figure 83: Eastern Europe Market Value (US$ Million) by Verticals , 2023 to 2033

Figure 84: Eastern Europe Market Value (US$ Million) by Country, 2023 to 2033

Figure 85: Eastern Europe Market Value (US$ Million) Analysis by Country, 2018 to 2033

Figure 86: Eastern Europe Market Value Share (%) and BPS Analysis by Country, 2023 to 2033

Figure 87: Eastern Europe Market Y-o-Y Growth (%) Projections by Country, 2023 to 2033

Figure 88: Eastern Europe Market Value (US$ Million) Analysis by Cloud Type, 2018 to 2033

Figure 89: Eastern Europe Market Value Share (%) and BPS Analysis by Cloud Type, 2023 to 2033

Figure 90: Eastern Europe Market Y-o-Y Growth (%) Projections by Cloud Type, 2023 to 2033

Figure 91: Eastern Europe Market Value (US$ Million) Analysis by Platform, 2018 to 2033

Figure 92: Eastern Europe Market Value Share (%) and BPS Analysis by Platform, 2023 to 2033

Figure 93: Eastern Europe Market Y-o-Y Growth (%) Projections by Platform, 2023 to 2033

Figure 94: Eastern Europe Market Value (US$ Million) Analysis by Verticals , 2018 to 2033

Figure 95: Eastern Europe Market Value Share (%) and BPS Analysis by Verticals , 2023 to 2033

Figure 96: Eastern Europe Market Y-o-Y Growth (%) Projections by Verticals , 2023 to 2033

Figure 97: Eastern Europe Market Attractiveness by Cloud Type, 2023 to 2033

Figure 98: Eastern Europe Market Attractiveness by Platform, 2023 to 2033

Figure 99: Eastern Europe Market Attractiveness by Verticals , 2023 to 2033

Figure 100: Eastern Europe Market Attractiveness by Country, 2023 to 2033

Figure 101: South Asia and Pacific Market Value (US$ Million) by Cloud Type, 2023 to 2033

Figure 102: South Asia and Pacific Market Value (US$ Million) by Platform, 2023 to 2033

Figure 103: South Asia and Pacific Market Value (US$ Million) by Verticals , 2023 to 2033

Figure 104: South Asia and Pacific Market Value (US$ Million) by Country, 2023 to 2033

Figure 105: South Asia and Pacific Market Value (US$ Million) Analysis by Country, 2018 to 2033

Figure 106: South Asia and Pacific Market Value Share (%) and BPS Analysis by Country, 2023 to 2033

Figure 107: South Asia and Pacific Market Y-o-Y Growth (%) Projections by Country, 2023 to 2033

Figure 108: South Asia and Pacific Market Value (US$ Million) Analysis by Cloud Type, 2018 to 2033

Figure 109: South Asia and Pacific Market Value Share (%) and BPS Analysis by Cloud Type, 2023 to 2033

Figure 110: South Asia and Pacific Market Y-o-Y Growth (%) Projections by Cloud Type, 2023 to 2033

Figure 111: South Asia and Pacific Market Value (US$ Million) Analysis by Platform, 2018 to 2033

Figure 112: South Asia and Pacific Market Value Share (%) and BPS Analysis by Platform, 2023 to 2033

Figure 113: South Asia and Pacific Market Y-o-Y Growth (%) Projections by Platform, 2023 to 2033

Figure 114: South Asia and Pacific Market Value (US$ Million) Analysis by Verticals , 2018 to 2033

Figure 115: South Asia and Pacific Market Value Share (%) and BPS Analysis by Verticals , 2023 to 2033

Figure 116: South Asia and Pacific Market Y-o-Y Growth (%) Projections by Verticals , 2023 to 2033

Figure 117: South Asia and Pacific Market Attractiveness by Cloud Type, 2023 to 2033

Figure 118: South Asia and Pacific Market Attractiveness by Platform, 2023 to 2033

Figure 119: South Asia and Pacific Market Attractiveness by Verticals , 2023 to 2033

Figure 120: South Asia and Pacific Market Attractiveness by Country, 2023 to 2033

Figure 121: East Asia Market Value (US$ Million) by Cloud Type, 2023 to 2033

Figure 122: East Asia Market Value (US$ Million) by Platform, 2023 to 2033

Figure 123: East Asia Market Value (US$ Million) by Verticals , 2023 to 2033

Figure 124: East Asia Market Value (US$ Million) by Country, 2023 to 2033

Figure 125: East Asia Market Value (US$ Million) Analysis by Country, 2018 to 2033

Figure 126: East Asia Market Value Share (%) and BPS Analysis by Country, 2023 to 2033

Figure 127: East Asia Market Y-o-Y Growth (%) Projections by Country, 2023 to 2033

Figure 128: East Asia Market Value (US$ Million) Analysis by Cloud Type, 2018 to 2033

Figure 129: East Asia Market Value Share (%) and BPS Analysis by Cloud Type, 2023 to 2033

Figure 130: East Asia Market Y-o-Y Growth (%) Projections by Cloud Type, 2023 to 2033

Figure 131: East Asia Market Value (US$ Million) Analysis by Platform, 2018 to 2033

Figure 132: East Asia Market Value Share (%) and BPS Analysis by Platform, 2023 to 2033

Figure 133: East Asia Market Y-o-Y Growth (%) Projections by Platform, 2023 to 2033

Figure 134: East Asia Market Value (US$ Million) Analysis by Verticals , 2018 to 2033

Figure 135: East Asia Market Value Share (%) and BPS Analysis by Verticals , 2023 to 2033

Figure 136: East Asia Market Y-o-Y Growth (%) Projections by Verticals , 2023 to 2033

Figure 137: East Asia Market Attractiveness by Cloud Type, 2023 to 2033

Figure 138: East Asia Market Attractiveness by Platform, 2023 to 2033

Figure 139: East Asia Market Attractiveness by Verticals , 2023 to 2033

Figure 140: East Asia Market Attractiveness by Country, 2023 to 2033

Figure 141: Middle East and Africa Market Value (US$ Million) by Cloud Type, 2023 to 2033

Figure 142: Middle East and Africa Market Value (US$ Million) by Platform, 2023 to 2033

Figure 143: Middle East and Africa Market Value (US$ Million) by Verticals , 2023 to 2033

Figure 144: Middle East and Africa Market Value (US$ Million) by Country, 2023 to 2033

Figure 145: Middle East and Africa Market Value (US$ Million) Analysis by Country, 2018 to 2033

Figure 146: Middle East and Africa Market Value Share (%) and BPS Analysis by Country, 2023 to 2033

Figure 147: Middle East and Africa Market Y-o-Y Growth (%) Projections by Country, 2023 to 2033

Figure 148: Middle East and Africa Market Value (US$ Million) Analysis by Cloud Type, 2018 to 2033

Figure 149: Middle East and Africa Market Value Share (%) and BPS Analysis by Cloud Type, 2023 to 2033

Figure 150: Middle East and Africa Market Y-o-Y Growth (%) Projections by Cloud Type, 2023 to 2033

Figure 151: Middle East and Africa Market Value (US$ Million) Analysis by Platform, 2018 to 2033

Figure 152: Middle East and Africa Market Value Share (%) and BPS Analysis by Platform, 2023 to 2033

Figure 153: Middle East and Africa Market Y-o-Y Growth (%) Projections by Platform, 2023 to 2033

Figure 154: Middle East and Africa Market Value (US$ Million) Analysis by Verticals , 2018 to 2033

Figure 155: Middle East and Africa Market Value Share (%) and BPS Analysis by Verticals , 2023 to 2033

Figure 156: Middle East and Africa Market Y-o-Y Growth (%) Projections by Verticals , 2023 to 2033

Figure 157: Middle East and Africa Market Attractiveness by Cloud Type, 2023 to 2033

Figure 158: Middle East and Africa Market Attractiveness by Platform, 2023 to 2033

Figure 159: Middle East and Africa Market Attractiveness by Verticals , 2023 to 2033

Figure 160: Middle East and Africa Market Attractiveness by Country, 2023 to 2033

Frequently Asked Questions

What is the Cloud Printing Services Market value in 2023?

The market is valued at USD 1,521.5 million in 2023.

What is the CAGR from 2023 to 2033?

The market will expand at an 11.7% CAGR through 2033.

What drives Cloud Printing Services market growth?

The growing use of mobile devices is driving growth.

What was the CAGR from 2018 to 2022?

From 2018 to 2022, the market expanded at a 9.6% CAGR.

Which is the key Cloud Type?

Public cloud printing services is the key cloud type.

Explore Similar Insights

Future Market Insights

Cloud Printing Services Market