Reports
- Global Locations -
Headquarters
Future Market Insights, Inc.
Christiana Corporate, 200
Continental Drive, Suite 401,
Newark, Delaware - 19713,
United States
Americas
Future Market Insights, Inc.
616 Corporate Way, Suite 2-9018,
Valley Cottage, NY 10989, United States
MEA
Future Market Insights
1602-6 Jumeirah Bay X2 Tower, Plot No: JLT-PH2-X2A,
Jumeirah Lakes Towers, Dubai,
United Arab Emirates
Europe
Future Market Insights
3rd Floor, 207 Regent Street,
W1B 3HH London
United Kingdom
Asia Pacific
Future Market Insights
Office No. 401-A, 4th Floor,
VANTAGE 9, S.No. 36/1/1,
Baner, Pune 411045, India
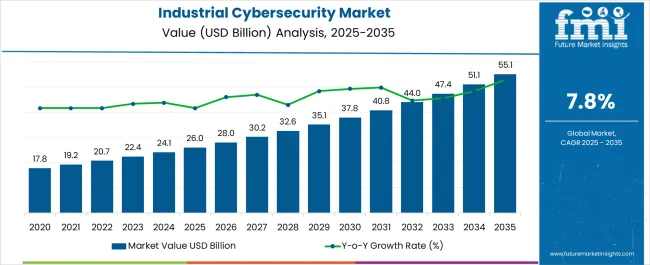
The industrial cybersecurity market is expected to expand its roots at a steady CAGR of 7.8% during the forecast period. The market is likely to hold a revenue of US$ 22.36 billion in 2023 while it is anticipated to cross a value of US$ 46.96 billion by 2033.
Increased internet penetration in various regions of the globe is anticipated to contribute to the growth of the industrial cybersecurity market share. The increased adoption of Internet of Things (IoT) solutions in industrial control systems and cloud security applications is driving the industrial cybersecurity market size. The market is also predicted to develop due to the increasing adoption of emerging technologies such as 5G networks, big data, and artificial intelligence (AI) across industries.
The demand for cybersecurity solutions across industries is predicted to increase as the demand for advanced solutions such as firewalls, antivirus, and intrusion detection systems (IDS) grows.
Attributes | Details |
---|---|
Industrial Cybersecurity Market CAGR (2023 to 2033) | 7.8% |
Industrial Cybersecurity Market Size (2023) | US$ 22.36 billion |
Industrial Cybersecurity Market Size (2033) | US$ 46.96 billion |
Don't pay for what you don't need
Customize your report by selecting specific countries or regions and save 30%!
The demand for industrial cybersecurity solutions and services is rising as it helps firms in a variety of industries safeguard their data and other secret information from cyber-attacks. These industrial cybersecurity services assist businesses in monitoring and controlling a wide range of process outputs and inputs on the job site.
To carry out their core operations, numerous firms around the world have chosen cloud-based and connection equipment. This shift has put a significant strain on cyber security operations, as well as raising the risk of cyber-attacks.
Manufacturing and industrial facilities are increasingly adopting cloud-based ICS-as-a-service and industrial robots based on artificial intelligence platforms. This is driving the demand for industrial cybersecurity solutions. Industrial robots have cybersecurity solutions installed to protect them from cyber-attacks and keep them running properly.
According to the International Federation of Robotics, roughly 125.6 thousand industry robots were deployed in the automotive sector in 2018. Where, 105.2 thousand were in the electrical industry, and 43.6 thousand were in the metal and mining industries worldwide in 2018.
As a result, firms in the global market for industrial cybersecurity solutions are obtaining significant sales opportunities. The rising use of the internet in all parts of the world has resulted in a significant increase in cybercrime incidents in a variety of industries. Including discrete and process management.
As a result, businesses in a variety of industries, including oil and gas, automotive, energy and power, and aerospace and defense, are increasingly adopting industrial cyber security solutions. In the industrial cybersecurity services market, this scenario is likely to provide significant demand prospects.
In the years ahead, rising acceptance of cloud security solutions and IoT in industrial cybersecurity systems are anticipated to drive market expansion. As vast volumes of data and information are generated across sectors daily. One of the developing market trends is integrating industrial cybersecurity solutions with modern cloud services.
Advanced cloud services are necessary to monitor and analyze this data. The market's key players are concentrating on creating and integrating cloud-based cybersecurity solutions for OT and ICS applications across various sectors.
Over the last several years, government entities in several nations throughout the world have increased financial support for activities that aid in the reduction of cyber security breaches. The global market for industrial cybersecurity solutions is growing as a result of the mentioned factors.
Industrial Cybersecurity Market:
Attributes | Industrial Cybersecurity Market |
---|---|
CAGR (2023 to 2033) | 7.8% |
Market Value (2033) | US$ 46.96 billion |
Growth Factor | The increased adoption of Internet of Things (IoT) solutions in industrial control systems and cloud security applications is driving the market size of industrial cybersecurity. |
Opportunity | The cyber security market is growing due to rising threats such as computer intrusion (hacking), virus deployment, and denial of service. |
Key Trends | The market's key players are concentrating their efforts on creating and integrating cloud-based cybersecurity solutions for OT and ICS applications across various sectors. |
Operational Technology (OT) Security Market:
Attributes | Operational Technology (OT) Security Market |
---|---|
CAGR (2023 to 2033) | 8.6% |
Market Value (2033) | US$ 41.17 billion |
Growth Factor | The increased threat of cyber-attacks on vital infrastructure is propelling the OT security market forward. |
Opportunity | To carry out their core operations, a wide range of firms globally have chosen cloud-based and connection equipment. |
Key Trends | The widespread usage of BYOD devices, IIoT, WFH, and internet penetration across many industrial verticals are all key trends in the OT security market. |
Cyber Security Market:
Attributes | Cyber Security Market |
---|---|
CAGR (2023 to 2033) | 10.4% |
Market Value (2033) | US$ 629.50 billion |
Growth Factor | The cyber security market is growing due to rising threats such as computer intrusion (hacking), virus deployment, and denial of service. |
Opportunity | These technologies help enterprises in guaranteeing business continuity and staying safe from hostile threat actors and cybercrime threats. |
Key Trends | Multiple end users collect and secure data on computers and send it over networks. IT security strategy is required to protect data from cyber-attack. |
Industrial cybersecurity is designed to protect industrial environments from cyber threats at various stages. The demand for industrial cybersecurity solutions and the protection of industrial networks is rapidly growing as it is an important area of concern. It covers the security of the organization, advanced control frameworks, and product and equipment arrangements.
These cybersecurity solutions are designed to keep plants and machinery in businesses safe. Modern systems must be monitored and secured to prevent any risk or attack, controlling physical establishments. The global use and availability of cloud administrations such as Amazon Web Services to store sensitive and personal information are increasing the risks associated with network security.
The growth in modern digital criminals, along with the unavoidable helplessness of cloud services, implies that the likelihood of a corporation being subjected to a successful digital attack or data breach is on the rise. The days of free antivirus and firewall software, which solely provided data and system security, are long gone.
The demand for industrial cybersecurity solutions is rising as top businesses do not entrust their data security to online security specialists. Digital dangers might develop in any firm at any time. Simple social engineering methods like phishing should be taught to staff. As well as advanced internet protection attacks like ransomware (think WannaCry) or other viruses, which are aimed to steal licensed or specific data.
Countries | Revenue Share % (2022) |
---|---|
United States | 18.5% |
Germany | 9.3% |
Japan | 5.7% |
Australia | 2.9% |
North America | 27.4% |
Europe | 23.1% |
Countries | CAGR % (2023 to 2033) |
---|---|
China | 9.3% |
India | 9.5% |
United Kingdom | 7.8% |
North America held a significant market share of 27.4% in 2022. Leading players have contributed to the region's success. Furthermore, increased investment by key companies to extend their global footprint is likely to drive demand for industrial cybersecurity solutions in North America.
CyberArk Software Ltd. introduced CyberArk, Cloud Entitlements Manager, an artificial intelligence-based service, in November 2020. The solution was created to improve cloud infrastructure security layers across businesses. The country is safeguarded from foreign trade vulnerabilities thanks to the implementation of modern cybersecurity solutions across industrial applications.
During the anticipated period, the demand for industrial cybersecurity solutions in the Asia Pacific is expected to increase at a swift rate. Key firms in China, India, Taiwan, Japan, Australia, South Korea, and other ASEAN nations are concentrating their efforts on cloud-based security applications. In the manufacturing industry, these countries have several small and medium companies (SMEs) and startups.
During the forecasted period, the demand for industrial cybersecurity solutions in Europe is expected to increase at a significant rate. The rise in investment for the expansion of secure IT infrastructure across the automotive industry is largely responsible for the region's success.
Category | By Component |
---|---|
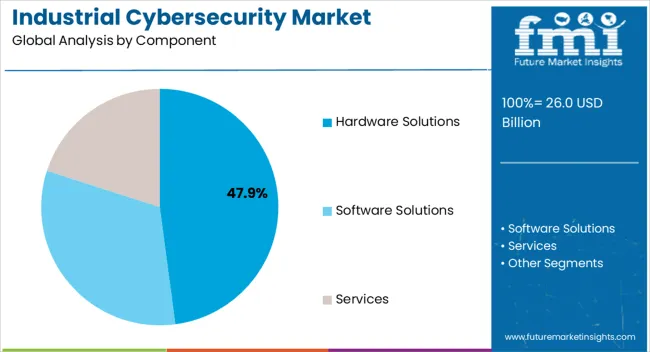
Leading Segment | Hardware |
Market Share (2023) | 46.1% |
Category | By End-use Industry |
---|---|
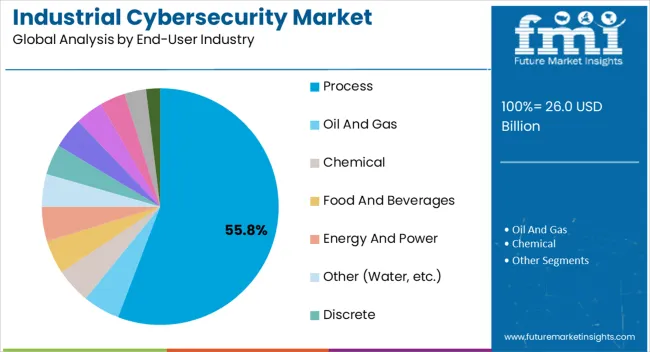
Leading Segment | Discrete |
Market Share (2023) | 54.6% |
Due to the rising demand for industrial cybersecurity solutions like firewalls, SCADA encryption, and others, the software segment is expected to lead.
The software is anticipated to hold a substantial market share. DDoS, firewall, SCADA encryption, virtualization security, antivirus/malware, backup & recovery, and other software solutions are all seeing increased demand.
Key businesses are concentrating their efforts on creating and delivering advanced industrial security software solutions for a variety of industries. Including automotive, oil & gas, energy, and others.
Check Point Software Technologies Ltd., for example, introduced Check Point R81, a unified cybersecurity platform for industrial applications, in November. The technology aids IT workers in efficiently managing complicated network configurations by delivering pre-programmed threat protection notifications.
Get the data you need at a Fraction of the cost
Personalize your report by choosing insights you need
and save 40%!
During the projected period, cloud application security is expected to increase substantially. This is primarily due to the heavy manufacturing industry's increased usage of cloud technologies.
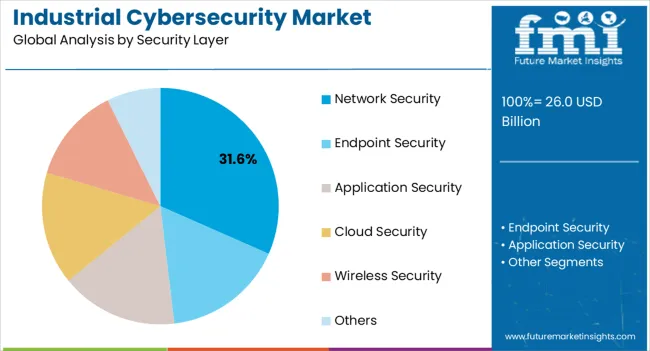
During the forecast period, the network security, end-point security, and internet security segments are predicted to increase at a steady rate. Increased demand for dependable and safe security solutions across industries such as energy, food, beverages, automotive, and others is driving the segment's expansion.
During the projected period, the discrete industry is expected to dominate the market. The demand for IoT-enabled devices, 5G networks, and industry 4.0 solutions are driving the increase.
The discrete sector is further divided into automotive, electronics, heavy manufacturing, packaging, and other categories (aerospace and defense, and others).
Coronavirus had a negative influence on cybersecurity spending in the industrial sector around the world. The top players are concentrating on finishing pending investments and business initiatives to reclaim the market position.
Furthermore, in the near future, spending on infrastructure as a service (IaaS) and cloud computing tools is expected to rise. These investments may help to foster a variety of growth prospects and demand for industrial cybersecurity in industrial applications.
Market Developments
1. Executive Summary 1.1. Global Market Outlook 1.2. Demand-side Trends 1.3. Supply-side Trends 1.4. Technology Roadmap Analysis 1.5. Analysis and Recommendations 2. Market Overview 2.1. Market Coverage / Taxonomy 2.2. Market Definition / Scope / Limitations 3. Market Background 3.1. Market Dynamics 3.1.1. Drivers 3.1.2. Restraints 3.1.3. Opportunity 3.1.4. Trends 3.2. Scenario Forecast 3.2.1. Demand in Optimistic Scenario 3.2.2. Demand in Likely Scenario 3.2.3. Demand in Conservative Scenario 3.3. Opportunity Map Analysis 3.4. Investment Feasibility Matrix 3.5. PESTLE and Porter’s Analysis 3.6. Regulatory Landscape 3.6.1. By Key Regions 3.6.2. By Key Countries 3.7. Regional Parent Market Outlook 4. Global Market Analysis 2018 to 2022 and Forecast, 2023 to 2033 4.1. Historical Market Size Value (US$ Million) Analysis, 2018 to 2022 4.2. Current and Future Market Size Value (US$ Million) Projections, 2023 to 2033 4.2.1. Y-o-Y Growth Trend Analysis 4.2.2. Absolute $ Opportunity Analysis 5. Global Market Analysis 2018 to 2022 and Forecast 2023 to 2033, By Component 5.1. Introduction / Key Findings 5.2. Historical Market Size Value (US$ Million) Analysis By Component, 2018 to 2022 5.3. Current and Future Market Size Value (US$ Million) Analysis and Forecast By Component, 2023 to 2033 5.3.1. Hardware Solutions 5.3.2. Software Solutions 5.3.3. Services 5.4. Y-o-Y Growth Trend Analysis By Component, 2018 to 2022 5.5. Absolute $ Opportunity Analysis By Component, 2023 to 2033 6. Global Market Analysis 2018 to 2022 and Forecast 2023 to 2033, By Security Layer 6.1. Introduction / Key Findings 6.2. Historical Market Size Value (US$ Million) Analysis By Security Layer, 2018 to 2022 6.3. Current and Future Market Size Value (US$ Million) Analysis and Forecast By Security Layer, 2023 to 2033 6.3.1. Network Security 6.3.2. Endpoint Security 6.3.3. Application Security 6.3.4. Cloud Security 6.3.5. Wireless Security 6.3.6. Others 6.4. Y-o-Y Growth Trend Analysis By Security Layer, 2018 to 2022 6.5. Absolute $ Opportunity Analysis By Security Layer, 2023 to 2033 7. Global Market Analysis 2018 to 2022 and Forecast 2023 to 2033, By End-User Industry 7.1. Introduction / Key Findings 7.2. Historical Market Size Value (US$ Million) Analysis By End-User Industry, 2018 to 2022 7.3. Current and Future Market Size Value (US$ Million) Analysis and Forecast By End-User Industry, 2023 to 2033 7.3.1. Process 7.3.1.1. Oil and Gas 7.3.1.2. Chemical 7.3.1.3. Food and Beverages 7.3.1.4. Energy and Power 7.3.1.5. Other 7.3.2. Discrete 7.3.2.1. Automotive 7.3.2.2. Electronics 7.3.2.3. Heavy Manufacturing 7.3.2.4. Packaging 7.3.2.5. Others 7.4. Y-o-Y Growth Trend Analysis By End-User Industry, 2018 to 2022 7.5. Absolute $ Opportunity Analysis By End-User Industry, 2023 to 2033 8. Global Market Analysis 2018 to 2022 and Forecast 2023 to 2033, By Region 8.1. Introduction 8.2. Historical Market Size Value (US$ Million) Analysis By Region, 2018 to 2022 8.3. Current Market Size Value (US$ Million) Analysis and Forecast By Region, 2023 to 2033 8.3.1. North America 8.3.2. Latin America 8.3.3. Europe 8.3.4. South Asia 8.3.5. East Asia 8.3.6. Oceania 8.3.7. MEA 8.4. Market Attractiveness Analysis By Region 9. North America Market Analysis 2018 to 2022 and Forecast 2023 to 2033, By Country 9.1. Historical Market Size Value (US$ Million) Trend Analysis By Market Taxonomy, 2018 to 2022 9.2. Market Size Value (US$ Million) Forecast By Market Taxonomy, 2023 to 2033 9.2.1. By Country 9.2.1.1. U.S. 9.2.1.2. Canada 9.2.2. By Component 9.2.3. By Security Layer 9.2.4. By End-User Industry 9.3. Market Attractiveness Analysis 9.3.1. By Country 9.3.2. By Component 9.3.3. By Security Layer 9.3.4. By End-User Industry 9.4. Key Takeaways 10. Latin America Market Analysis 2018 to 2022 and Forecast 2023 to 2033, By Country 10.1. Historical Market Size Value (US$ Million) Trend Analysis By Market Taxonomy, 2018 to 2022 10.2. Market Size Value (US$ Million) Forecast By Market Taxonomy, 2023 to 2033 10.2.1. By Country 10.2.1.1. Brazil 10.2.1.2. Mexico 10.2.1.3. Rest of Latin America 10.2.2. By Component 10.2.3. By Security Layer 10.2.4. By End-User Industry 10.3. Market Attractiveness Analysis 10.3.1. By Country 10.3.2. By Component 10.3.3. By Security Layer 10.3.4. By End-User Industry 10.4. Key Takeaways 11. Europe Market Analysis 2018 to 2022 and Forecast 2023 to 2033, By Country 11.1. Historical Market Size Value (US$ Million) Trend Analysis By Market Taxonomy, 2018 to 2022 11.2. Market Size Value (US$ Million) Forecast By Market Taxonomy, 2023 to 2033 11.2.1. By Country 11.2.1.1. Germany 11.2.1.2. U.K. 11.2.1.3. France 11.2.1.4. Spain 11.2.1.5. Italy 11.2.1.6. Rest of Europe 11.2.2. By Component 11.2.3. By Security Layer 11.2.4. By End-User Industry 11.3. Market Attractiveness Analysis 11.3.1. By Country 11.3.2. By Component 11.3.3. By Security Layer 11.3.4. By End-User Industry 11.4. Key Takeaways 12. South Asia Market Analysis 2018 to 2022 and Forecast 2023 to 2033, By Country 12.1. Historical Market Size Value (US$ Million) Trend Analysis By Market Taxonomy, 2018 to 2022 12.2. Market Size Value (US$ Million) Forecast By Market Taxonomy, 2023 to 2033 12.2.1. By Country 12.2.1.1. India 12.2.1.2. Malaysia 12.2.1.3. Singapore 12.2.1.4. Thailand 12.2.1.5. Rest of South Asia 12.2.2. By Component 12.2.3. By Security Layer 12.2.4. By End-User Industry 12.3. Market Attractiveness Analysis 12.3.1. By Country 12.3.2. By Component 12.3.3. By Security Layer 12.3.4. By End-User Industry 12.4. Key Takeaways 13. East Asia Market Analysis 2018 to 2022 and Forecast 2023 to 2033, By Country 13.1. Historical Market Size Value (US$ Million) Trend Analysis By Market Taxonomy, 2018 to 2022 13.2. Market Size Value (US$ Million) Forecast By Market Taxonomy, 2023 to 2033 13.2.1. By Country 13.2.1.1. China 13.2.1.2. Japan 13.2.1.3. South Korea 13.2.2. By Component 13.2.3. By Security Layer 13.2.4. By End-User Industry 13.3. Market Attractiveness Analysis 13.3.1. By Country 13.3.2. By Component 13.3.3. By Security Layer 13.3.4. By End-User Industry 13.4. Key Takeaways 14. Oceania Market Analysis 2018 to 2022 and Forecast 2023 to 2033, By Country 14.1. Historical Market Size Value (US$ Million) Trend Analysis By Market Taxonomy, 2018 to 2022 14.2. Market Size Value (US$ Million) Forecast By Market Taxonomy, 2023 to 2033 14.2.1. By Country 14.2.1.1. Australia 14.2.1.2. New Zealand 14.2.2. By Component 14.2.3. By Security Layer 14.2.4. By End-User Industry 14.3. Market Attractiveness Analysis 14.3.1. By Country 14.3.2. By Component 14.3.3. By Security Layer 14.3.4. By End-User Industry 14.4. Key Takeaways 15. MEA Market Analysis 2018 to 2022 and Forecast 2023 to 2033, By Country 15.1. Historical Market Size Value (US$ Million) Trend Analysis By Market Taxonomy, 2018 to 2022 15.2. Market Size Value (US$ Million) Forecast By Market Taxonomy, 2023 to 2033 15.2.1. By Country 15.2.1.1. GCC Countries 15.2.1.2. South Africa 15.2.1.3. Israel 15.2.1.4. Rest of MEA 15.2.2. By Component 15.2.3. By Security Layer 15.2.4. By End-User Industry 15.3. Market Attractiveness Analysis 15.3.1. By Country 15.3.2. By Component 15.3.3. By Security Layer 15.3.4. By End-User Industry 15.4. Key Takeaways 16. Key Countries Market Analysis 16.1. U.S. 16.1.1. Pricing Analysis 16.1.2. Market Share Analysis, 2022 16.1.2.1. By Component 16.1.2.2. By Security Layer 16.1.2.3. By End-User Industry 16.2. Canada 16.2.1. Pricing Analysis 16.2.2. Market Share Analysis, 2022 16.2.2.1. By Component 16.2.2.2. By Security Layer 16.2.2.3. By End-User Industry 16.3. Brazil 16.3.1. Pricing Analysis 16.3.2. Market Share Analysis, 2022 16.3.2.1. By Component 16.3.2.2. By Security Layer 16.3.2.3. By End-User Industry 16.4. Mexico 16.4.1. Pricing Analysis 16.4.2. Market Share Analysis, 2022 16.4.2.1. By Component 16.4.2.2. By Security Layer 16.4.2.3. By End-User Industry 16.5. Germany 16.5.1. Pricing Analysis 16.5.2. Market Share Analysis, 2022 16.5.2.1. By Component 16.5.2.2. By Security Layer 16.5.2.3. By End-User Industry 16.6. U.K. 16.6.1. Pricing Analysis 16.6.2. Market Share Analysis, 2022 16.6.2.1. By Component 16.6.2.2. By Security Layer 16.6.2.3. By End-User Industry 16.7. France 16.7.1. Pricing Analysis 16.7.2. Market Share Analysis, 2022 16.7.2.1. By Component 16.7.2.2. By Security Layer 16.7.2.3. By End-User Industry 16.8. Spain 16.8.1. Pricing Analysis 16.8.2. Market Share Analysis, 2022 16.8.2.1. By Component 16.8.2.2. By Security Layer 16.8.2.3. By End-User Industry 16.9. Italy 16.9.1. Pricing Analysis 16.9.2. Market Share Analysis, 2022 16.9.2.1. By Component 16.9.2.2. By Security Layer 16.9.2.3. By End-User Industry 16.10. India 16.10.1. Pricing Analysis 16.10.2. Market Share Analysis, 2022 16.10.2.1. By Component 16.10.2.2. By Security Layer 16.10.2.3. By End-User Industry 16.11. Malaysia 16.11.1. Pricing Analysis 16.11.2. Market Share Analysis, 2022 16.11.2.1. By Component 16.11.2.2. By Security Layer 16.11.2.3. By End-User Industry 16.12. Singapore 16.12.1. Pricing Analysis 16.12.2. Market Share Analysis, 2022 16.12.2.1. By Component 16.12.2.2. By Security Layer 16.12.2.3. By End-User Industry 16.13. Thailand 16.13.1. Pricing Analysis 16.13.2. Market Share Analysis, 2022 16.13.2.1. By Component 16.13.2.2. By Security Layer 16.13.2.3. By End-User Industry 16.14. China 16.14.1. Pricing Analysis 16.14.2. Market Share Analysis, 2022 16.14.2.1. By Component 16.14.2.2. By Security Layer 16.14.2.3. By End-User Industry 16.15. Japan 16.15.1. Pricing Analysis 16.15.2. Market Share Analysis, 2022 16.15.2.1. By Component 16.15.2.2. By Security Layer 16.15.2.3. By End-User Industry 16.16. South Korea 16.16.1. Pricing Analysis 16.16.2. Market Share Analysis, 2022 16.16.2.1. By Component 16.16.2.2. By Security Layer 16.16.2.3. By End-User Industry 16.17. Australia 16.17.1. Pricing Analysis 16.17.2. Market Share Analysis, 2022 16.17.2.1. By Component 16.17.2.2. By Security Layer 16.17.2.3. By End-User Industry 16.18. New Zealand 16.18.1. Pricing Analysis 16.18.2. Market Share Analysis, 2022 16.18.2.1. By Component 16.18.2.2. By Security Layer 16.18.2.3. By End-User Industry 16.19. GCC Countries 16.19.1. Pricing Analysis 16.19.2. Market Share Analysis, 2022 16.19.2.1. By Component 16.19.2.2. By Security Layer 16.19.2.3. By End-User Industry 16.20. South Africa 16.20.1. Pricing Analysis 16.20.2. Market Share Analysis, 2022 16.20.2.1. By Component 16.20.2.2. By Security Layer 16.20.2.3. By End-User Industry 16.21. Israel 16.21.1. Pricing Analysis 16.21.2. Market Share Analysis, 2022 16.21.2.1. By Component 16.21.2.2. By Security Layer 16.21.2.3. By End-User Industry 17. Market Structure Analysis 17.1. Competition Dashboard 17.2. Competition Benchmarking 17.3. Market Share Analysis of Top Players 17.3.1. By Regional 17.3.2. By Component 17.3.3. By Security Layer 17.3.4. By End-User Industry 18. Competition Analysis 18.1. Competition Deep Dive 18.1.1. Schneider Electric SE 18.1.1.1. Overview 18.1.1.2. Product Portfolio 18.1.1.3. Profitability by Market Segments 18.1.1.4. Sales Footprint 18.1.1.5. Strategy Overview 18.1.1.5.1. Marketing Strategy 18.1.2. Rockwell Automation Inc. 18.1.2.1. Overview 18.1.2.2. Product Portfolio 18.1.2.3. Profitability by Market Segments 18.1.2.4. Sales Footprint 18.1.2.5. Strategy Overview 18.1.2.5.1. Marketing Strategy 18.1.3. CyberArk Software Ltd. 18.1.3.1. Overview 18.1.3.2. Product Portfolio 18.1.3.3. Profitability by Market Segments 18.1.3.4. Sales Footprint 18.1.3.5. Strategy Overview 18.1.3.5.1. Marketing Strategy 18.1.4. ABB Ltd. 18.1.4.1. Overview 18.1.4.2. Product Portfolio 18.1.4.3. Profitability by Market Segments 18.1.4.4. Sales Footprint 18.1.4.5. Strategy Overview 18.1.4.5.1. Marketing Strategy 18.1.5. Bayshore Networks Inc. 18.1.5.1. Overview 18.1.5.2. Product Portfolio 18.1.5.3. Profitability by Market Segments 18.1.5.4. Sales Footprint 18.1.5.5. Strategy Overview 18.1.5.5.1. Marketing Strategy 18.1.6. Cisco Systems, Inc. 18.1.6.1. Overview 18.1.6.2. Product Portfolio 18.1.6.3. Profitability by Market Segments 18.1.6.4. Sales Footprint 18.1.6.5. Strategy Overview 18.1.6.5.1. Marketing Strategy 18.1.7. Honeywell International Inc. 18.1.7.1. Overview 18.1.7.2. Product Portfolio 18.1.7.3. Profitability by Market Segments 18.1.7.4. Sales Footprint 18.1.7.5. Strategy Overview 18.1.7.5.1. Marketing Strategy 18.1.8. IBM Corporation 18.1.8.1. Overview 18.1.8.2. Product Portfolio 18.1.8.3. Profitability by Market Segments 18.1.8.4. Sales Footprint 18.1.8.5. Strategy Overview 18.1.8.5.1. Marketing Strategy 18.1.9. McAfee, LLC 18.1.9.1. Overview 18.1.9.2. Product Portfolio 18.1.9.3. Profitability by Market Segments 18.1.9.4. Sales Footprint 18.1.9.5. Strategy Overview 18.1.9.5.1. Marketing Strategy 18.1.10. Siemens AG 18.1.10.1. Overview 18.1.10.2. Product Portfolio 18.1.10.3. Profitability by Market Segments 18.1.10.4. Sales Footprint 18.1.10.5. Strategy Overview 18.1.10.5.1. Marketing Strategy 19. Assumptions & Acronyms Used 20. Research Methodology
Don't pay for what you don't need
Customize your report by selecting specific countries or regions and save 30%!
Table 1: Global Market Value (US$ Million) Forecast by Region, 2018 to 2033 Table 2: Global Market Value (US$ Million) Forecast by Component, 2018 to 2033 Table 3: Global Market Value (US$ Million) Forecast by Security Layer, 2018 to 2033 Table 4: Global Market Value (US$ Million) Forecast by End-User Industry, 2018 to 2033 Table 5: North America Market Value (US$ Million) Forecast by Country, 2018 to 2033 Table 6: North America Market Value (US$ Million) Forecast by Component, 2018 to 2033 Table 7: North America Market Value (US$ Million) Forecast by Security Layer, 2018 to 2033 Table 8: North America Market Value (US$ Million) Forecast by End-User Industry, 2018 to 2033 Table 9: Latin America Market Value (US$ Million) Forecast by Country, 2018 to 2033 Table 10: Latin America Market Value (US$ Million) Forecast by Component, 2018 to 2033 Table 11: Latin America Market Value (US$ Million) Forecast by Security Layer, 2018 to 2033 Table 12: Latin America Market Value (US$ Million) Forecast by End-User Industry, 2018 to 2033 Table 13: Europe Market Value (US$ Million) Forecast by Country, 2018 to 2033 Table 14: Europe Market Value (US$ Million) Forecast by Component, 2018 to 2033 Table 15: Europe Market Value (US$ Million) Forecast by Security Layer, 2018 to 2033 Table 16: Europe Market Value (US$ Million) Forecast by End-User Industry, 2018 to 2033 Table 17: South Asia Market Value (US$ Million) Forecast by Country, 2018 to 2033 Table 18: South Asia Market Value (US$ Million) Forecast by Component, 2018 to 2033 Table 19: South Asia Market Value (US$ Million) Forecast by Security Layer, 2018 to 2033 Table 20: South Asia Market Value (US$ Million) Forecast by End-User Industry, 2018 to 2033 Table 21: East Asia Market Value (US$ Million) Forecast by Country, 2018 to 2033 Table 22: East Asia Market Value (US$ Million) Forecast by Component, 2018 to 2033 Table 23: East Asia Market Value (US$ Million) Forecast by Security Layer, 2018 to 2033 Table 24: East Asia Market Value (US$ Million) Forecast by End-User Industry, 2018 to 2033 Table 25: Oceania Market Value (US$ Million) Forecast by Country, 2018 to 2033 Table 26: Oceania Market Value (US$ Million) Forecast by Component, 2018 to 2033 Table 27: Oceania Market Value (US$ Million) Forecast by Security Layer, 2018 to 2033 Table 28: Oceania Market Value (US$ Million) Forecast by End-User Industry, 2018 to 2033 Table 29: MEA Market Value (US$ Million) Forecast by Country, 2018 to 2033 Table 30: MEA Market Value (US$ Million) Forecast by Component, 2018 to 2033 Table 31: MEA Market Value (US$ Million) Forecast by Security Layer, 2018 to 2033 Table 32: MEA Market Value (US$ Million) Forecast by End-User Industry, 2018 to 2033
Figure 1: Global Market Value (US$ Million) by Component, 2023 to 2033 Figure 2: Global Market Value (US$ Million) by Security Layer, 2023 to 2033 Figure 3: Global Market Value (US$ Million) by End-User Industry, 2023 to 2033 Figure 4: Global Market Value (US$ Million) by Region, 2023 to 2033 Figure 5: Global Market Value (US$ Million) Analysis by Region, 2018 to 2033 Figure 6: Global Market Value Share (%) and BPS Analysis by Region, 2023 to 2033 Figure 7: Global Market Y-o-Y Growth (%) Projections by Region, 2023 to 2033 Figure 8: Global Market Value (US$ Million) Analysis by Component, 2018 to 2033 Figure 9: Global Market Value Share (%) and BPS Analysis by Component, 2023 to 2033 Figure 10: Global Market Y-o-Y Growth (%) Projections by Component, 2023 to 2033 Figure 11: Global Market Value (US$ Million) Analysis by Security Layer, 2018 to 2033 Figure 12: Global Market Value Share (%) and BPS Analysis by Security Layer, 2023 to 2033 Figure 13: Global Market Y-o-Y Growth (%) Projections by Security Layer, 2023 to 2033 Figure 14: Global Market Value (US$ Million) Analysis by End-User Industry, 2018 to 2033 Figure 15: Global Market Value Share (%) and BPS Analysis by End-User Industry, 2023 to 2033 Figure 16: Global Market Y-o-Y Growth (%) Projections by End-User Industry, 2023 to 2033 Figure 17: Global Market Attractiveness by Component, 2023 to 2033 Figure 18: Global Market Attractiveness by Security Layer, 2023 to 2033 Figure 19: Global Market Attractiveness by End-User Industry, 2023 to 2033 Figure 20: Global Market Attractiveness by Region, 2023 to 2033 Figure 21: North America Market Value (US$ Million) by Component, 2023 to 2033 Figure 22: North America Market Value (US$ Million) by Security Layer, 2023 to 2033 Figure 23: North America Market Value (US$ Million) by End-User Industry, 2023 to 2033 Figure 24: North America Market Value (US$ Million) by Country, 2023 to 2033 Figure 25: North America Market Value (US$ Million) Analysis by Country, 2018 to 2033 Figure 26: North America Market Value Share (%) and BPS Analysis by Country, 2023 to 2033 Figure 27: North America Market Y-o-Y Growth (%) Projections by Country, 2023 to 2033 Figure 28: North America Market Value (US$ Million) Analysis by Component, 2018 to 2033 Figure 29: North America Market Value Share (%) and BPS Analysis by Component, 2023 to 2033 Figure 30: North America Market Y-o-Y Growth (%) Projections by Component, 2023 to 2033 Figure 31: North America Market Value (US$ Million) Analysis by Security Layer, 2018 to 2033 Figure 32: North America Market Value Share (%) and BPS Analysis by Security Layer, 2023 to 2033 Figure 33: North America Market Y-o-Y Growth (%) Projections by Security Layer, 2023 to 2033 Figure 34: North America Market Value (US$ Million) Analysis by End-User Industry, 2018 to 2033 Figure 35: North America Market Value Share (%) and BPS Analysis by End-User Industry, 2023 to 2033 Figure 36: North America Market Y-o-Y Growth (%) Projections by End-User Industry, 2023 to 2033 Figure 37: North America Market Attractiveness by Component, 2023 to 2033 Figure 38: North America Market Attractiveness by Security Layer, 2023 to 2033 Figure 39: North America Market Attractiveness by End-User Industry, 2023 to 2033 Figure 40: North America Market Attractiveness by Country, 2023 to 2033 Figure 41: Latin America Market Value (US$ Million) by Component, 2023 to 2033 Figure 42: Latin America Market Value (US$ Million) by Security Layer, 2023 to 2033 Figure 43: Latin America Market Value (US$ Million) by End-User Industry, 2023 to 2033 Figure 44: Latin America Market Value (US$ Million) by Country, 2023 to 2033 Figure 45: Latin America Market Value (US$ Million) Analysis by Country, 2018 to 2033 Figure 46: Latin America Market Value Share (%) and BPS Analysis by Country, 2023 to 2033 Figure 47: Latin America Market Y-o-Y Growth (%) Projections by Country, 2023 to 2033 Figure 48: Latin America Market Value (US$ Million) Analysis by Component, 2018 to 2033 Figure 49: Latin America Market Value Share (%) and BPS Analysis by Component, 2023 to 2033 Figure 50: Latin America Market Y-o-Y Growth (%) Projections by Component, 2023 to 2033 Figure 51: Latin America Market Value (US$ Million) Analysis by Security Layer, 2018 to 2033 Figure 52: Latin America Market Value Share (%) and BPS Analysis by Security Layer, 2023 to 2033 Figure 53: Latin America Market Y-o-Y Growth (%) Projections by Security Layer, 2023 to 2033 Figure 54: Latin America Market Value (US$ Million) Analysis by End-User Industry, 2018 to 2033 Figure 55: Latin America Market Value Share (%) and BPS Analysis by End-User Industry, 2023 to 2033 Figure 56: Latin America Market Y-o-Y Growth (%) Projections by End-User Industry, 2023 to 2033 Figure 57: Latin America Market Attractiveness by Component, 2023 to 2033 Figure 58: Latin America Market Attractiveness by Security Layer, 2023 to 2033 Figure 59: Latin America Market Attractiveness by End-User Industry, 2023 to 2033 Figure 60: Latin America Market Attractiveness by Country, 2023 to 2033 Figure 61: Europe Market Value (US$ Million) by Component, 2023 to 2033 Figure 62: Europe Market Value (US$ Million) by Security Layer, 2023 to 2033 Figure 63: Europe Market Value (US$ Million) by End-User Industry, 2023 to 2033 Figure 64: Europe Market Value (US$ Million) by Country, 2023 to 2033 Figure 65: Europe Market Value (US$ Million) Analysis by Country, 2018 to 2033 Figure 66: Europe Market Value Share (%) and BPS Analysis by Country, 2023 to 2033 Figure 67: Europe Market Y-o-Y Growth (%) Projections by Country, 2023 to 2033 Figure 68: Europe Market Value (US$ Million) Analysis by Component, 2018 to 2033 Figure 69: Europe Market Value Share (%) and BPS Analysis by Component, 2023 to 2033 Figure 70: Europe Market Y-o-Y Growth (%) Projections by Component, 2023 to 2033 Figure 71: Europe Market Value (US$ Million) Analysis by Security Layer, 2018 to 2033 Figure 72: Europe Market Value Share (%) and BPS Analysis by Security Layer, 2023 to 2033 Figure 73: Europe Market Y-o-Y Growth (%) Projections by Security Layer, 2023 to 2033 Figure 74: Europe Market Value (US$ Million) Analysis by End-User Industry, 2018 to 2033 Figure 75: Europe Market Value Share (%) and BPS Analysis by End-User Industry, 2023 to 2033 Figure 76: Europe Market Y-o-Y Growth (%) Projections by End-User Industry, 2023 to 2033 Figure 77: Europe Market Attractiveness by Component, 2023 to 2033 Figure 78: Europe Market Attractiveness by Security Layer, 2023 to 2033 Figure 79: Europe Market Attractiveness by End-User Industry, 2023 to 2033 Figure 80: Europe Market Attractiveness by Country, 2023 to 2033 Figure 81: South Asia Market Value (US$ Million) by Component, 2023 to 2033 Figure 82: South Asia Market Value (US$ Million) by Security Layer, 2023 to 2033 Figure 83: South Asia Market Value (US$ Million) by End-User Industry, 2023 to 2033 Figure 84: South Asia Market Value (US$ Million) by Country, 2023 to 2033 Figure 85: South Asia Market Value (US$ Million) Analysis by Country, 2018 to 2033 Figure 86: South Asia Market Value Share (%) and BPS Analysis by Country, 2023 to 2033 Figure 87: South Asia Market Y-o-Y Growth (%) Projections by Country, 2023 to 2033 Figure 88: South Asia Market Value (US$ Million) Analysis by Component, 2018 to 2033 Figure 89: South Asia Market Value Share (%) and BPS Analysis by Component, 2023 to 2033 Figure 90: South Asia Market Y-o-Y Growth (%) Projections by Component, 2023 to 2033 Figure 91: South Asia Market Value (US$ Million) Analysis by Security Layer, 2018 to 2033 Figure 92: South Asia Market Value Share (%) and BPS Analysis by Security Layer, 2023 to 2033 Figure 93: South Asia Market Y-o-Y Growth (%) Projections by Security Layer, 2023 to 2033 Figure 94: South Asia Market Value (US$ Million) Analysis by End-User Industry, 2018 to 2033 Figure 95: South Asia Market Value Share (%) and BPS Analysis by End-User Industry, 2023 to 2033 Figure 96: South Asia Market Y-o-Y Growth (%) Projections by End-User Industry, 2023 to 2033 Figure 97: South Asia Market Attractiveness by Component, 2023 to 2033 Figure 98: South Asia Market Attractiveness by Security Layer, 2023 to 2033 Figure 99: South Asia Market Attractiveness by End-User Industry, 2023 to 2033 Figure 100: South Asia Market Attractiveness by Country, 2023 to 2033 Figure 101: East Asia Market Value (US$ Million) by Component, 2023 to 2033 Figure 102: East Asia Market Value (US$ Million) by Security Layer, 2023 to 2033 Figure 103: East Asia Market Value (US$ Million) by End-User Industry, 2023 to 2033 Figure 104: East Asia Market Value (US$ Million) by Country, 2023 to 2033 Figure 105: East Asia Market Value (US$ Million) Analysis by Country, 2018 to 2033 Figure 106: East Asia Market Value Share (%) and BPS Analysis by Country, 2023 to 2033 Figure 107: East Asia Market Y-o-Y Growth (%) Projections by Country, 2023 to 2033 Figure 108: East Asia Market Value (US$ Million) Analysis by Component, 2018 to 2033 Figure 109: East Asia Market Value Share (%) and BPS Analysis by Component, 2023 to 2033 Figure 110: East Asia Market Y-o-Y Growth (%) Projections by Component, 2023 to 2033 Figure 111: East Asia Market Value (US$ Million) Analysis by Security Layer, 2018 to 2033 Figure 112: East Asia Market Value Share (%) and BPS Analysis by Security Layer, 2023 to 2033 Figure 113: East Asia Market Y-o-Y Growth (%) Projections by Security Layer, 2023 to 2033 Figure 114: East Asia Market Value (US$ Million) Analysis by End-User Industry, 2018 to 2033 Figure 115: East Asia Market Value Share (%) and BPS Analysis by End-User Industry, 2023 to 2033 Figure 116: East Asia Market Y-o-Y Growth (%) Projections by End-User Industry, 2023 to 2033 Figure 117: East Asia Market Attractiveness by Component, 2023 to 2033 Figure 118: East Asia Market Attractiveness by Security Layer, 2023 to 2033 Figure 119: East Asia Market Attractiveness by End-User Industry, 2023 to 2033 Figure 120: East Asia Market Attractiveness by Country, 2023 to 2033 Figure 121: Oceania Market Value (US$ Million) by Component, 2023 to 2033 Figure 122: Oceania Market Value (US$ Million) by Security Layer, 2023 to 2033 Figure 123: Oceania Market Value (US$ Million) by End-User Industry, 2023 to 2033 Figure 124: Oceania Market Value (US$ Million) by Country, 2023 to 2033 Figure 125: Oceania Market Value (US$ Million) Analysis by Country, 2018 to 2033 Figure 126: Oceania Market Value Share (%) and BPS Analysis by Country, 2023 to 2033 Figure 127: Oceania Market Y-o-Y Growth (%) Projections by Country, 2023 to 2033 Figure 128: Oceania Market Value (US$ Million) Analysis by Component, 2018 to 2033 Figure 129: Oceania Market Value Share (%) and BPS Analysis by Component, 2023 to 2033 Figure 130: Oceania Market Y-o-Y Growth (%) Projections by Component, 2023 to 2033 Figure 131: Oceania Market Value (US$ Million) Analysis by Security Layer, 2018 to 2033 Figure 132: Oceania Market Value Share (%) and BPS Analysis by Security Layer, 2023 to 2033 Figure 133: Oceania Market Y-o-Y Growth (%) Projections by Security Layer, 2023 to 2033 Figure 134: Oceania Market Value (US$ Million) Analysis by End-User Industry, 2018 to 2033 Figure 135: Oceania Market Value Share (%) and BPS Analysis by End-User Industry, 2023 to 2033 Figure 136: Oceania Market Y-o-Y Growth (%) Projections by End-User Industry, 2023 to 2033 Figure 137: Oceania Market Attractiveness by Component, 2023 to 2033 Figure 138: Oceania Market Attractiveness by Security Layer, 2023 to 2033 Figure 139: Oceania Market Attractiveness by End-User Industry, 2023 to 2033 Figure 140: Oceania Market Attractiveness by Country, 2023 to 2033 Figure 141: MEA Market Value (US$ Million) by Component, 2023 to 2033 Figure 142: MEA Market Value (US$ Million) by Security Layer, 2023 to 2033 Figure 143: MEA Market Value (US$ Million) by End-User Industry, 2023 to 2033 Figure 144: MEA Market Value (US$ Million) by Country, 2023 to 2033 Figure 145: MEA Market Value (US$ Million) Analysis by Country, 2018 to 2033 Figure 146: MEA Market Value Share (%) and BPS Analysis by Country, 2023 to 2033 Figure 147: MEA Market Y-o-Y Growth (%) Projections by Country, 2023 to 2033 Figure 148: MEA Market Value (US$ Million) Analysis by Component, 2018 to 2033 Figure 149: MEA Market Value Share (%) and BPS Analysis by Component, 2023 to 2033 Figure 150: MEA Market Y-o-Y Growth (%) Projections by Component, 2023 to 2033 Figure 151: MEA Market Value (US$ Million) Analysis by Security Layer, 2018 to 2033 Figure 152: MEA Market Value Share (%) and BPS Analysis by Security Layer, 2023 to 2033 Figure 153: MEA Market Y-o-Y Growth (%) Projections by Security Layer, 2023 to 2033 Figure 154: MEA Market Value (US$ Million) Analysis by End-User Industry, 2018 to 2033 Figure 155: MEA Market Value Share (%) and BPS Analysis by End-User Industry, 2023 to 2033 Figure 156: MEA Market Y-o-Y Growth (%) Projections by End-User Industry, 2023 to 2033 Figure 157: MEA Market Attractiveness by Component, 2023 to 2033 Figure 158: MEA Market Attractiveness by Security Layer, 2023 to 2033 Figure 159: MEA Market Attractiveness by End-User Industry, 2023 to 2033 Figure 160: MEA Market Attractiveness by Country, 2023 to 2033
Recommendations
Explore Technology Insights
View Reports