Cloud API and Management Platforms and Middleware Market Outlook (2023 to 2033)

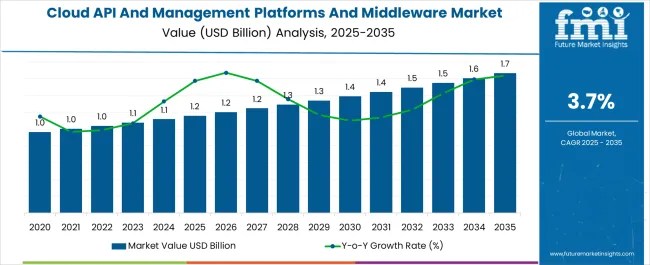
The global cloud API, management platforms, and middleware market are likely to reach USD 1,553.7 million by 2033, up from USD 1,077.0 million in 2023, advancing at a CAGR of 3.7% during the forecast period.

During the forecasting period, the development of Internet of things (IoT) holds the potential to expand new cloud API and management platforms and middleware opportunities, eventually increasing the market growth.

The market cloud API, management platforms, and middleware are expected to enhance in the coming years due to the rise in demand for high operational efficiency and DevOps automation among development engineers to shorten the time to market for product launches.

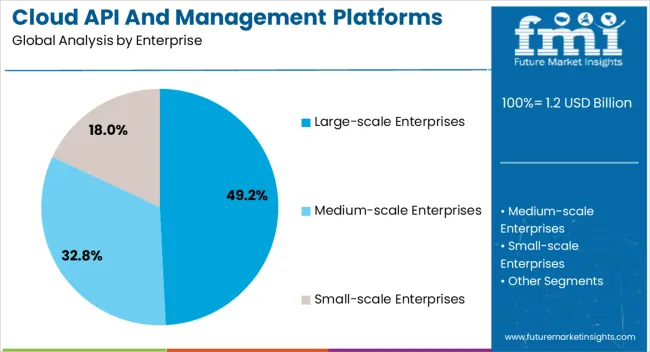
Moreover, it has been observed that a number of standalone API vendors (pure-plays) have been acquired by large-scale enterprises in order to capitalize on the opportunity in cloud API and management platforms and the middleware market in the long run.

Attribute Details
Market Value (2023) USD 1,077.0 million
Market Anticipated Forecast Value (2033) USD 1,553.7 million
Market Projected Growth Rate (2023 to 2033) 3.7%

The primary growth factor behind the rise of cloud API market is identified as the emergence of the Internet of Things. As connected devices increase with the rise of IoT, the need of analysis and monitoring of those devices are also increasing, which can be done though cloud APIs.

In addition to this, several start-ups and small-scale enterprises are adopting assemble from components methodology that enables end users to use APIs to connect apps to IT assets, resulting in growth in the usage of cloud APIs.

Owing to the widespread use of cloud computing and the rise in the business demand of micro-services, the cloud API and management platforms and middleware market is expected to grow. On the other hand, rise in digitization and intense adoption of analytics and cloud technologies are also having positive impact on the market.

What are Various Drivers and Restraints in the Cloud API and Management Platforms and Middleware Market?

Cloud API and management platforms and the middleware market are fast picking up due to the wide adoption of mobile and cloud applications for back-end services and the wide adoption of microservices-based architectures by enterprises.

These applications comprise small, independent processes that communicate via API, creating demand for cloud API and management platforms and middleware.

The challenge faced by the market is that many large-scale enterprises have applications with point-to-point integration, which is not well documented, thereby making integrating these applications with modern apps. Hence, if there is a restriction on the company's IT budget (spending), the companies tend to side-line services comprising cloud APIs.

What Components as a Part Cloud API Management Solution are Offered by a Cloud API Platform Vendor?

  • API developer portal: Developers can explore APIs, register for access and obtain keys. It also contains documentation, policies and rules on the usage of the cloud APIs.
  • API gateway: It includes the design and deployment of cloud APIs with the ability to route requests to and from endpoints and between gateway instances
  • Life-cycle management and operations: The life-cycle manager manages the entire life-cycle of the cloud API platform, i.e., build, test and stage, production, and operations.

Apart from this, the cloud API management solutions also offer additional services such as security, analytics, and platform add-ons such as bot prevention by stopping bad bot traffic, internet of thing APIs by building apps that connect to multiple devices, and monetization by offering flexible rate plans.

Which Region Is Projected To Lead The Cloud API And Management Platforms And Middleware Market?

Cloud API and management platforms and middleware market share are currently dominated by the North American region and account for over 50% in 2022 on account of the increase in the use of cloud-based services. Due to the presence of advanced IT infrastructure, several significant players are operating in this area, shaping the market trends.

Additionally, during the projected period, North American nations' high IT expenditure capacity significantly contributes to the expansion of cloud API and management platforms and the middleware market in this region.

What are the Growth Prospects for Europe Cloud API and Management Platforms and Middleware Market?

By 2022, Europe is anticipated to get hold of cloud API and management platforms and a middleware market share of 25.5% in 2022 as healthcare and government sectors are shifting towards the usage of cloud-based services.

The European Union (EU) Information and Communication Technology (ICT) sector contributed USD 644.75 billion to the market for cloud API and management platforms and middleware in 2015, indicating that it is experiencing a period of sustained expansion.

How is the Start-Up Ecosystem in the Cloud API and Management Platforms and Middleware Market?

Business models vary throughout time, sometimes due to market shifts and other times due to technological advancements, which leads to the birth of exciting new trends.

Such cloud API and management platforms and middleware market trends are brought about by numerous start-ups that are emerging in the market lately.

Upbound is a cloud-native computing firm offering businesses a multi-cloud platform to combine various cloud environments into a single cloud environment.

Users can use multiple private and public cloud environments to run, scale, and optimize their services. It offers a platform for automation that enables businesses to create scalable cloud services. Cost optimization, capacity overflow, failover, policy enforcement, and portability between clouds are among the features.
What is the Competition Landscape in the Cloud API and Management Platforms and Middleware Market?

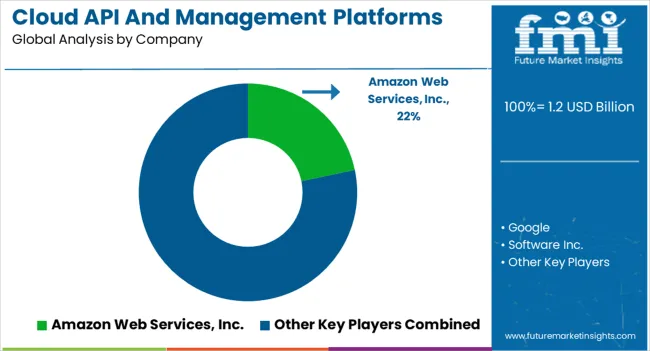
Top companies in the cloud API and management platforms and middleware market are involved in various organic and inorganic strategies, including mergers and acquisitions, partnerships, and collaborations, thereby augmenting the market share.

A few of the recent developments in cloud API and management platforms and the middleware market are listed below:

  • January 2023: Google Cloud confirmed the broad release of Apigee Edge, their next-generation API management platform. Apigee Edge delivers a variety of additional features and capabilities, like support for microservices, analytics in real-time, and machine learning.
  • February 2023: IBM confirmed the purchase of TIBCO Mashery, a popular API management tool. The purchase will assist IBM to extend its API management portfolio and give clients a complete solution.

Key Players

  • Google
  • Software Inc.
  • IBM
  • Microsoft
  • TIBCO
  • Amazon Web Services, Inc.
  • Broadcom
  • Dell Inc.
  • Oracle
  • Salesforce
  • Axway
  • SAP SE
  • VMware, Inc.
  • Red Hat, Inc.
  • TWILIO INC.
  • UpCloud Ltd.
  • RACKSPACE US, INC.
  • Mulesoft, LLC
  • Informatica
  • Celigo, Inc.
  • Boomi, Inc.

Report Scope

Attribute Details
Growth Rate CAGR of 3.7% from 2023 to 2033
Base Year for Estimation 2022
Historical Data 2018 to 2022
Forecast Period 2023 to 2033
Quantitative Units Revenue in USD million and CAGR from 2023 to 2033
Report Coverage Revenue Forecast, Volume Forecast, Company Ranking, Competitive Landscape, Growth Factors, Trends and Pricing Analysis
Segments Covered Enterprises, Industry, Region
Regions Covered North America; Latin America; Asia Pacific; The Middle East and Africa; Europe
Key Countries Profiled USA, Canada, Brazil, Argentina, Germany, United Kingdom, France, Spain, Italy, Nordics, BENELUX, Australia & New Zealand, China, India, ASEAN, GCC, South Africa
Key Companies Profiled Google; Software Inc.; IBM; Microsoft; TIBCO; Amazon Web Services, Inc.; Broadcom; Dell Inc.; Oracle; Salesforce; Axway; SAP SE; VMware, Inc.; Red Hat, Inc.; TWILIO INC.; UpCloud Ltd.; RACKSPACE US, INC.; Mulesoft, LLC; Informatica; Celigo, Inc.; Boomi, Inc.

Key Segments Profiled In The Cloud API And Management Platforms And Middleware Market Survey

By Enterprise:

  • Large-scale Enterprises
  • Medium-scale Enterprises
  • Small-scale Enterprises

By Industry:

  • Retail
  • Healthcare
  • Telecom
  • BFSI
  • Media & Entertainment
  • Hospitality
  • Education
  • Others

By Region:

  • North America
  • Latin America
  • Asia Pacific
  • The Middle East and Africa
  • Europe

Table of Content

  • 1. Executive Summary
  • 2. Market Overview
  • 3. Market Background
  • 4. Global Market Analysis 2018 to 2022 and Forecast, 2023 to 2033
  • 5. Global Market Analysis 2018 to 2022 and Forecast 2023 to 2033, By Enterprise
    • 5.1. Large-scale Enterprises
    • 5.2. Medium-scale Enterprises
    • 5.3. Small-scale Enterprises
  • 6. Global Market Analysis 2018 to 2022 and Forecast 2023 to 2033, By Industry
    • 6.1. Retail
    • 6.2. Healthcare
    • 6.3. Telecom
    • 6.4. BFSI
    • 6.5. Media & Entertainment
    • 6.6. Hospitality
    • 6.7. Education
    • 6.8. Others
  • 7. Global Market Analysis 2018 to 2022 and Forecast 2023 to 2033, By Region
    • 7.1. North America
    • 7.2. Latin America
    • 7.3. Western Europe
    • 7.4. Eastern Europe
    • 7.5. South Asia and Pacific
    • 7.6. East Asia
    • 7.7. Middle East and Africa
  • 8. North America Market Analysis 2018 to 2022 and Forecast 2023 to 2033, By Country
  • 9. Latin America Market Analysis 2018 to 2022 and Forecast 2023 to 2033, By Country
  • 10. Western Europe Market Analysis 2018 to 2022 and Forecast 2023 to 2033, By Country
  • 11. Eastern Europe Market Analysis 2018 to 2022 and Forecast 2023 to 2033, By Country
  • 12. South Asia and Pacific Market Analysis 2018 to 2022 and Forecast 2023 to 2033, By Country
  • 13. East Asia Market Analysis 2018 to 2022 and Forecast 2023 to 2033, By Country
  • 14. Middle East and Africa Market Analysis 2018 to 2022 and Forecast 2023 to 2033, By Country
  • 15. Key Countries Market Analysis
  • 16. Market Structure Analysis
  • 17. Competition Analysis
    • 17.1. Google
    • 17.2. Software Inc.
    • 17.3. IBM
    • 17.4. Microsoft
    • 17.5. TIBCO
    • 17.6. Amazon Web Services, Inc.
    • 17.7. Broadcom
    • 17.8. Dell Inc.
    • 17.9. Oracle
    • 17.10. Salesforce
    • 17.11. Axway
    • 17.12. SAP SE
    • 17.13. VMware, Inc.
    • 17.14. Red Hat, Inc.
    • 17.15. TWILIO INC.
    • 17.16. UpCloud Ltd.
    • 17.17. RACKSPACE US, INC.
    • 17.18. Mulesoft, LLC
    • 17.19. Informatica
    • 17.20. Celigo, Inc.
  • 18. Assumptions & Acronyms Used
  • 19. Research Methodology

List of Tables

Table 1: Global Market Value (US$ Million) Forecast by Region, 2018 to 2033

Table 2: Global Market Value (US$ Million) Forecast by Enterprise, 2018 to 2033

Table 3: Global Market Value (US$ Million) Forecast by Industry, 2018 to 2033

Table 4: North America Market Value (US$ Million) Forecast by Country, 2018 to 2033

Table 5: North America Market Value (US$ Million) Forecast by Enterprise, 2018 to 2033

Table 6: North America Market Value (US$ Million) Forecast by Industry, 2018 to 2033

Table 7: Latin America Market Value (US$ Million) Forecast by Country, 2018 to 2033

Table 8: Latin America Market Value (US$ Million) Forecast by Enterprise, 2018 to 2033

Table 9: Latin America Market Value (US$ Million) Forecast by Industry, 2018 to 2033

Table 10: Western Europe Market Value (US$ Million) Forecast by Country, 2018 to 2033

Table 11: Western Europe Market Value (US$ Million) Forecast by Enterprise, 2018 to 2033

Table 12: Western Europe Market Value (US$ Million) Forecast by Industry, 2018 to 2033

Table 13: Eastern Europe Market Value (US$ Million) Forecast by Country, 2018 to 2033

Table 14: Eastern Europe Market Value (US$ Million) Forecast by Enterprise, 2018 to 2033

Table 15: Eastern Europe Market Value (US$ Million) Forecast by Industry, 2018 to 2033

Table 16: South Asia and Pacific Market Value (US$ Million) Forecast by Country, 2018 to 2033

Table 17: South Asia and Pacific Market Value (US$ Million) Forecast by Enterprise, 2018 to 2033

Table 18: South Asia and Pacific Market Value (US$ Million) Forecast by Industry, 2018 to 2033

Table 19: East Asia Market Value (US$ Million) Forecast by Country, 2018 to 2033

Table 20: East Asia Market Value (US$ Million) Forecast by Enterprise, 2018 to 2033

Table 21: East Asia Market Value (US$ Million) Forecast by Industry, 2018 to 2033

Table 22: Middle East and Africa Market Value (US$ Million) Forecast by Country, 2018 to 2033

Table 23: Middle East and Africa Market Value (US$ Million) Forecast by Enterprise, 2018 to 2033

Table 24: Middle East and Africa Market Value (US$ Million) Forecast by Industry, 2018 to 2033

List of Figures

Figure 1: Global Market Value (US$ Million) by Enterprise, 2023 to 2033

Figure 2: Global Market Value (US$ Million) by Industry, 2023 to 2033

Figure 3: Global Market Value (US$ Million) by Region, 2023 to 2033

Figure 4: Global Market Value (US$ Million) Analysis by Region, 2018 to 2033

Figure 5: Global Market Value Share (%) and BPS Analysis by Region, 2023 to 2033

Figure 6: Global Market Y-o-Y Growth (%) Projections by Region, 2023 to 2033

Figure 7: Global Market Value (US$ Million) Analysis by Enterprise, 2018 to 2033

Figure 8: Global Market Value Share (%) and BPS Analysis by Enterprise, 2023 to 2033

Figure 9: Global Market Y-o-Y Growth (%) Projections by Enterprise, 2023 to 2033

Figure 10: Global Market Value (US$ Million) Analysis by Industry, 2018 to 2033

Figure 11: Global Market Value Share (%) and BPS Analysis by Industry, 2023 to 2033

Figure 12: Global Market Y-o-Y Growth (%) Projections by Industry, 2023 to 2033

Figure 13: Global Market Attractiveness by Enterprise, 2023 to 2033

Figure 14: Global Market Attractiveness by Industry, 2023 to 2033

Figure 15: Global Market Attractiveness by Region, 2023 to 2033

Figure 16: North America Market Value (US$ Million) by Enterprise, 2023 to 2033

Figure 17: North America Market Value (US$ Million) by Industry, 2023 to 2033

Figure 18: North America Market Value (US$ Million) by Country, 2023 to 2033

Figure 19: North America Market Value (US$ Million) Analysis by Country, 2018 to 2033

Figure 20: North America Market Value Share (%) and BPS Analysis by Country, 2023 to 2033

Figure 21: North America Market Y-o-Y Growth (%) Projections by Country, 2023 to 2033

Figure 22: North America Market Value (US$ Million) Analysis by Enterprise, 2018 to 2033

Figure 23: North America Market Value Share (%) and BPS Analysis by Enterprise, 2023 to 2033

Figure 24: North America Market Y-o-Y Growth (%) Projections by Enterprise, 2023 to 2033

Figure 25: North America Market Value (US$ Million) Analysis by Industry, 2018 to 2033

Figure 26: North America Market Value Share (%) and BPS Analysis by Industry, 2023 to 2033

Figure 27: North America Market Y-o-Y Growth (%) Projections by Industry, 2023 to 2033

Figure 28: North America Market Attractiveness by Enterprise, 2023 to 2033

Figure 29: North America Market Attractiveness by Industry, 2023 to 2033

Figure 30: North America Market Attractiveness by Country, 2023 to 2033

Figure 31: Latin America Market Value (US$ Million) by Enterprise, 2023 to 2033

Figure 32: Latin America Market Value (US$ Million) by Industry, 2023 to 2033

Figure 33: Latin America Market Value (US$ Million) by Country, 2023 to 2033

Figure 34: Latin America Market Value (US$ Million) Analysis by Country, 2018 to 2033

Figure 35: Latin America Market Value Share (%) and BPS Analysis by Country, 2023 to 2033

Figure 36: Latin America Market Y-o-Y Growth (%) Projections by Country, 2023 to 2033

Figure 37: Latin America Market Value (US$ Million) Analysis by Enterprise, 2018 to 2033

Figure 38: Latin America Market Value Share (%) and BPS Analysis by Enterprise, 2023 to 2033

Figure 39: Latin America Market Y-o-Y Growth (%) Projections by Enterprise, 2023 to 2033

Figure 40: Latin America Market Value (US$ Million) Analysis by Industry, 2018 to 2033

Figure 41: Latin America Market Value Share (%) and BPS Analysis by Industry, 2023 to 2033

Figure 42: Latin America Market Y-o-Y Growth (%) Projections by Industry, 2023 to 2033

Figure 43: Latin America Market Attractiveness by Enterprise, 2023 to 2033

Figure 44: Latin America Market Attractiveness by Industry, 2023 to 2033

Figure 45: Latin America Market Attractiveness by Country, 2023 to 2033

Figure 46: Western Europe Market Value (US$ Million) by Enterprise, 2023 to 2033

Figure 47: Western Europe Market Value (US$ Million) by Industry, 2023 to 2033

Figure 48: Western Europe Market Value (US$ Million) by Country, 2023 to 2033

Figure 49: Western Europe Market Value (US$ Million) Analysis by Country, 2018 to 2033

Figure 50: Western Europe Market Value Share (%) and BPS Analysis by Country, 2023 to 2033

Figure 51: Western Europe Market Y-o-Y Growth (%) Projections by Country, 2023 to 2033

Figure 52: Western Europe Market Value (US$ Million) Analysis by Enterprise, 2018 to 2033

Figure 53: Western Europe Market Value Share (%) and BPS Analysis by Enterprise, 2023 to 2033

Figure 54: Western Europe Market Y-o-Y Growth (%) Projections by Enterprise, 2023 to 2033

Figure 55: Western Europe Market Value (US$ Million) Analysis by Industry, 2018 to 2033

Figure 56: Western Europe Market Value Share (%) and BPS Analysis by Industry, 2023 to 2033

Figure 57: Western Europe Market Y-o-Y Growth (%) Projections by Industry, 2023 to 2033

Figure 58: Western Europe Market Attractiveness by Enterprise, 2023 to 2033

Figure 59: Western Europe Market Attractiveness by Industry, 2023 to 2033

Figure 60: Western Europe Market Attractiveness by Country, 2023 to 2033

Figure 61: Eastern Europe Market Value (US$ Million) by Enterprise, 2023 to 2033

Figure 62: Eastern Europe Market Value (US$ Million) by Industry, 2023 to 2033

Figure 63: Eastern Europe Market Value (US$ Million) by Country, 2023 to 2033

Figure 64: Eastern Europe Market Value (US$ Million) Analysis by Country, 2018 to 2033

Figure 65: Eastern Europe Market Value Share (%) and BPS Analysis by Country, 2023 to 2033

Figure 66: Eastern Europe Market Y-o-Y Growth (%) Projections by Country, 2023 to 2033

Figure 67: Eastern Europe Market Value (US$ Million) Analysis by Enterprise, 2018 to 2033

Figure 68: Eastern Europe Market Value Share (%) and BPS Analysis by Enterprise, 2023 to 2033

Figure 69: Eastern Europe Market Y-o-Y Growth (%) Projections by Enterprise, 2023 to 2033

Figure 70: Eastern Europe Market Value (US$ Million) Analysis by Industry, 2018 to 2033

Figure 71: Eastern Europe Market Value Share (%) and BPS Analysis by Industry, 2023 to 2033

Figure 72: Eastern Europe Market Y-o-Y Growth (%) Projections by Industry, 2023 to 2033

Figure 73: Eastern Europe Market Attractiveness by Enterprise, 2023 to 2033

Figure 74: Eastern Europe Market Attractiveness by Industry, 2023 to 2033

Figure 75: Eastern Europe Market Attractiveness by Country, 2023 to 2033

Figure 76: South Asia and Pacific Market Value (US$ Million) by Enterprise, 2023 to 2033

Figure 77: South Asia and Pacific Market Value (US$ Million) by Industry, 2023 to 2033

Figure 78: South Asia and Pacific Market Value (US$ Million) by Country, 2023 to 2033

Figure 79: South Asia and Pacific Market Value (US$ Million) Analysis by Country, 2018 to 2033

Figure 80: South Asia and Pacific Market Value Share (%) and BPS Analysis by Country, 2023 to 2033

Figure 81: South Asia and Pacific Market Y-o-Y Growth (%) Projections by Country, 2023 to 2033

Figure 82: South Asia and Pacific Market Value (US$ Million) Analysis by Enterprise, 2018 to 2033

Figure 83: South Asia and Pacific Market Value Share (%) and BPS Analysis by Enterprise, 2023 to 2033

Figure 84: South Asia and Pacific Market Y-o-Y Growth (%) Projections by Enterprise, 2023 to 2033

Figure 85: South Asia and Pacific Market Value (US$ Million) Analysis by Industry, 2018 to 2033

Figure 86: South Asia and Pacific Market Value Share (%) and BPS Analysis by Industry, 2023 to 2033

Figure 87: South Asia and Pacific Market Y-o-Y Growth (%) Projections by Industry, 2023 to 2033

Figure 88: South Asia and Pacific Market Attractiveness by Enterprise, 2023 to 2033

Figure 89: South Asia and Pacific Market Attractiveness by Industry, 2023 to 2033

Figure 90: South Asia and Pacific Market Attractiveness by Country, 2023 to 2033

Figure 91: East Asia Market Value (US$ Million) by Enterprise, 2023 to 2033

Figure 92: East Asia Market Value (US$ Million) by Industry, 2023 to 2033

Figure 93: East Asia Market Value (US$ Million) by Country, 2023 to 2033

Figure 94: East Asia Market Value (US$ Million) Analysis by Country, 2018 to 2033

Figure 95: East Asia Market Value Share (%) and BPS Analysis by Country, 2023 to 2033

Figure 96: East Asia Market Y-o-Y Growth (%) Projections by Country, 2023 to 2033

Figure 97: East Asia Market Value (US$ Million) Analysis by Enterprise, 2018 to 2033

Figure 98: East Asia Market Value Share (%) and BPS Analysis by Enterprise, 2023 to 2033

Figure 99: East Asia Market Y-o-Y Growth (%) Projections by Enterprise, 2023 to 2033

Figure 100: East Asia Market Value (US$ Million) Analysis by Industry, 2018 to 2033

Figure 101: East Asia Market Value Share (%) and BPS Analysis by Industry, 2023 to 2033

Figure 102: East Asia Market Y-o-Y Growth (%) Projections by Industry, 2023 to 2033

Figure 103: East Asia Market Attractiveness by Enterprise, 2023 to 2033

Figure 104: East Asia Market Attractiveness by Industry, 2023 to 2033

Figure 105: East Asia Market Attractiveness by Country, 2023 to 2033

Figure 106: Middle East and Africa Market Value (US$ Million) by Enterprise, 2023 to 2033

Figure 107: Middle East and Africa Market Value (US$ Million) by Industry, 2023 to 2033

Figure 108: Middle East and Africa Market Value (US$ Million) by Country, 2023 to 2033

Figure 109: Middle East and Africa Market Value (US$ Million) Analysis by Country, 2018 to 2033

Figure 110: Middle East and Africa Market Value Share (%) and BPS Analysis by Country, 2023 to 2033

Figure 111: Middle East and Africa Market Y-o-Y Growth (%) Projections by Country, 2023 to 2033

Figure 112: Middle East and Africa Market Value (US$ Million) Analysis by Enterprise, 2018 to 2033

Figure 113: Middle East and Africa Market Value Share (%) and BPS Analysis by Enterprise, 2023 to 2033

Figure 114: Middle East and Africa Market Y-o-Y Growth (%) Projections by Enterprise, 2023 to 2033

Figure 115: Middle East and Africa Market Value (US$ Million) Analysis by Industry, 2018 to 2033

Figure 116: Middle East and Africa Market Value Share (%) and BPS Analysis by Industry, 2023 to 2033

Figure 117: Middle East and Africa Market Y-o-Y Growth (%) Projections by Industry, 2023 to 2033

Figure 118: Middle East and Africa Market Attractiveness by Enterprise, 2023 to 2033

Figure 119: Middle East and Africa Market Attractiveness by Industry, 2023 to 2033

Figure 120: Middle East and Africa Market Attractiveness by Country, 2023 to 2033

Frequently Asked Questions

What is the Growth Potential of the Market?

The growth potential of the market is 3.7% through 2033.

What Hinders the Market Growth?

Budget limits drive enterprises to skip cloud API due to undocumented integrations.

Which Region is Projected to Lead the Market?

North America is projected to lead the market.

What is the Key Trend of the Market?

Rapid adoption of mobile/cloud apps, and microservices in enterprises.

What is the Growth Prospect for Europe’s Market?

Cloud services adoption in healthcare and government sectors propels Europe’s growth.

Explore Similar Insights

Future Market Insights

Cloud API And Management Platforms And Middleware Market