Public Cloud Application Services Market Size, Share, and Forecast Outlook 2025 to 2035

The public cloud application services market is estimated to be valued at USD 245.9 million in 2025 and is projected to reach USD 2,024.6 million by 2035, registering a compound annual growth rate (CAGR) of 23.5%.

The market is expected to add an absolute dollar opportunity of USD 1,778.7 million during this period. This reflects an 8.23 times growth at a compound annual growth rate of 23.5%.The market evolution is expected to be shaped by enterprises strong preference for scalable infrastructure, accelerated digital transformation, and the rapid adoption of evolving cloud technologies across diverse industries.

By 2030, the market is likely to reach USD 779.9 million, accounting for USD 534.0 million in incremental valueover the first half of the decade.The remaining USD 1,244.7 million is expected during the second half, suggesting an accelerated growth pattern driven by large-scale workload migration, advanced cloud-native innovations, and increasing reliance on flexible, on-demand cloud services worldwide.

Companies such as Amazon Web Services (AWS) are advancing their competitive positions through continuous innovation in cloud infrastructure and service offerings. Investments in scalable public cloud platforms and enhanced cloud-native application services support rapid enterprise adoption. Innovation-led service models, including AI integration and advanced analytics, are driving expansion across industry verticals such as government, BFSI, and healthcare. Market performance will remain anchored in data security, regulatory compliance, and service reliability. These factors are critical for sustaining enterprise trust and supporting large-scale cloud deployments.
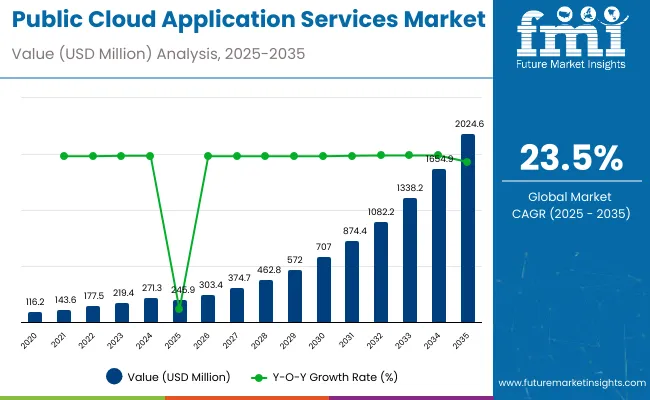
Quick Stats for Public Cloud Application Services Market

  • Public Cloud Application Services Market Value (2025): USD 245.9 million
  • Public Cloud Application Services Market Forecast Value (2035): USD 2,024.6 million
  • Public Cloud Application Services Market Forecast CAGR: 23.5%
  • Leading Segment in Public Cloud Application Services Market (2025): Customer Relationship Management (35%)
  • Key Growth Regions in Public Cloud Application Services Market: Asia Pacific and North America
  • Key Players in Public Cloud Application Services Market: Amazon Web Services, Alphabet, Inc., International Business Machines Corp., and NetSuite, Inc.

Public Cloud Application Services Market

Metric Value
Estimated Market Value (2025E) USD 245.9 million
Forecast Market Value (2035F) USD 2,024.6 million
Forecast CAGR (2025 to 2035) 23.5%

The market holds a strong position within the broader enterprise IT and cloud services landscape, reflecting its scalability, flexibility, and cost-efficiency. Within enterprise IT spending, public cloud represents about 45% of total cloud-related expenditures, underscoring its critical role in digital transformation strategies. In vertical adoption, it accounts for nearly 30% in BFSI, supported by its application in secure transactions, compliance, and customer-facing platforms.

The healthcare sector contributes 18%, leveraging public cloud for patient data management, telehealth, and advanced analytics. In the retail sector, its share is around 22%, driven by e-commerce growth, omnichannel experiences, and real-time insights. Across digital ecosystems, public cloud enables over 50% of AI, business intelligence, and CRM workloads, highlighting its central role in next-gen enterprise innovation.

The market is experiencing transformational growth driven by increasing cloud adoption, enhanced service offerings, and expanding geographic penetration. Innovations in cloud-native technologies, containerization, and AI integration have increased platform efficiency and service personalization.

Cloud providers are continuously evolving security, compliance, and data governance practices to meet stringent enterprise requirements. Strategic partnerships and industry collaborations are accelerating enterprise migration to public cloud platforms. Regulatory adherence and service-level agreements support the trusted positioning of public cloud services among large-scale businesses and government agencies.

Why is the Public Cloud Application Services Market Growing?

The market is expanding rapidly due to the increasing demand for scalable, flexible, and cost-effective infrastructure solutions across industries. Organizations are prioritizing digital transformation, agility, and operational efficiency. Public cloud platforms support these priorities through on-demand resources and seamless integration. Growing adoption of cloud-native applications, big data analytics, artificial intelligence, and Internet of Things (IoT) technologies further fuels market growth.

Additionally, enterprises are shifting from traditional on-premises systems to cloud services to reduce capital expenditure and improve scalability. Innovations in cloud security, compliance, and hybrid cloud deployment options enhance trust and broaden adoption. As businesses continue to embrace digital innovation and require flexible IT infrastructure, the public cloud application services market is poised for sustained, robust growth.

Public Cloud Application Services Market by Top Investment Segments

The market is segmented by application, enterprise, vertical, and region. By application, the market is categorized into business intelligence application, customer relationship management, digital content application, ERP application, enterprise content management, office suites, project management, supply chain management, social software suites, and application software. Based on enterprise size, the market is bifurcated into large enterprise and small & medium enterprise.

In terms of vertical, the market is segmented into BFSI, healthcare, telecommunication, media & entertainment, energy & utilities, retail/wholesale, manufacturing, transportation, and others (education, government, and hospitality). Regionally, the market spans across North America, Latin America, Europe, East Asia, South Asia & Pacific, and Middle East and Africa (MEA).
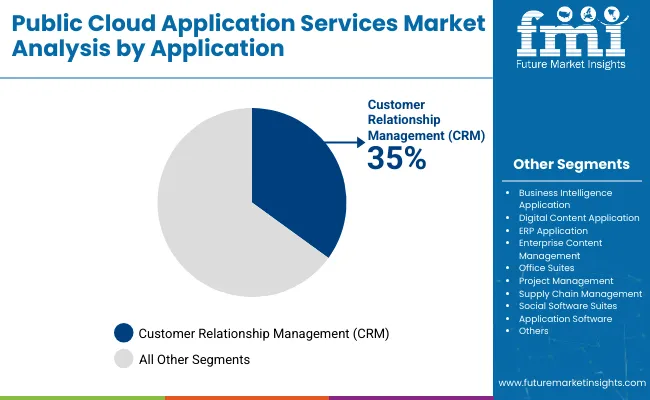
By Application, Customer Relationship Management (CRM) Holds 35% Market Share in 2025

Public Cloud Application Services Market By Application

The most lucrative segment in the market is customer relationship management (CRM), with a market share of 35% in 2025. This segment commands a substantial share due to the critical role CRM software plays in managing customer interactions, sales, and marketing functions. Its importance continues to grow as businesses seek to improve customer engagement, personalize marketing campaigns, and streamline sales processes. The shift to cloud-based CRM solutions enables organizations to access real-time data, collaborate across remote teams, and leverage AI-driven insights for better decision-making.

Large enterprises contribute the majority of revenue, but adoption among small and medium enterprises (SMEs) is rapidly increasing as cloud CRM platforms become more affordable and scalable. Major vendors like Salesforce, Microsoft, and Oracle lead the market, continuously innovating with new features and integrations. Overall, CRM is expected to remain the largest and most strategically important segment in the public cloud application services landscape for the foreseeable future.
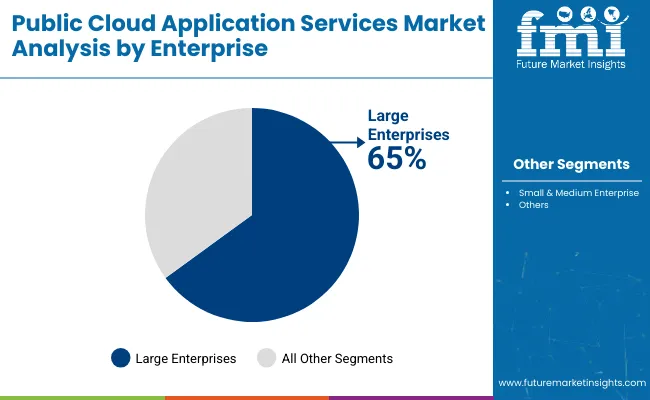
By Enterprise, Large Enterprises Lead with 65% Market Share in 2025

Public Cloud Application Services Market By Enterprise

Large enterprises are the leading segment in the market, accounting for 65% of the market share in 2025. These organizations have substantial IT budgets and complex infrastructure needs, driving extensive adoption of public cloud services. Large enterprises leverage cloud platforms to support digital transformation initiatives, enhance scalability, improve security, and enable global operations.

Their focus on mission-critical applications and the need for advanced collaboration tools further boosts cloud service adoption. Additionally, large enterprises benefit from the ability to customize and integrate cloud solutions with existing systems, making them the primary drivers of revenue and innovation in the public cloud application services market. With increasing digitalization across industries, their investment in cloud technologies is expected to accelerate, reinforcing their dominant position in the market.

What are the Drivers, Restraints, and Key Trends of the Public Cloud Application Services Market? 

From 2025 to 2035, enterprises across industries are accelerating their digital transformation initiatives to enhance agility, scalability, and operational efficiency. This shift drives widespread adoption of public cloud application services as organizations seek flexible, on-demand infrastructure and software solutions that support remote work, data analytics, and AI integration.

Cloud Security and Compliance Innovations Enhance Market Expansion Opportunities

In recent years, advancements in cloud security protocols, compliance frameworks, and data privacy measures have significantly boosted enterprise confidence in public cloud adoption. Integration of AI-powered threat detection and automated compliance tools ensures robust protection of sensitive information, addressing regulatory requirements across sectors.

This ongoing innovation enables organizations to safely migrate critical workloads and scale cloud deployments, thereby expanding the public cloud application services market. Providers offering secure, compliant, and integrated cloud solutions are well-positioned to capture growing demand and solidify market leadership.

Emergence of Industry-Specific Cloud Solutions Drives Market Diversification

The increasing demand for tailored cloud application services is driving the development of industry-specific solutions across sectors such as healthcare, finance, retail, and manufacturing. These specialized cloud offerings address unique compliance, data management, and operational needs, enabling businesses to optimize workflows and enhance customer experiences. As organizations prioritize digital innovation in competitive markets, the growth of customized public cloud applications creates new opportunities for service providers to differentiate themselves.
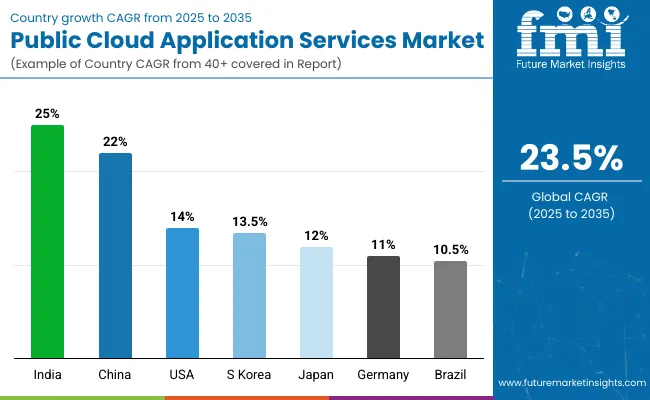
Public Cloud Application Services Market Analysis by Key Countries

Country Wise Analysis Public Cloud Application Services Market

Countries CAGR (%)
India 25
China 22
United States 14
South Korea 13.5
Japan 12
Germany 11
Brazil 10.5

The market shows significant variation in growth rates across leading countries, reflecting differences in digital maturity and cloud adoption. India leads with the highest CAGR of 25%, driven by rapid digital transformation, strong government support, and a vibrant startup ecosystem. China follows closely with a 22% CAGR, fueled by large-scale enterprise cloud migrations and government-backed smart city initiatives. The United States, with a mature cloud infrastructure, shows a solid CAGR of 14%, supported by advanced cloud innovations and widespread enterprise adoption.

South Korea and Japan display steady growth with CAGRs of 13.5% and 12%, respectively, leveraging 5G rollout and AI integration in cloud services. Germany’s market grows at around 11%, propelled by industry 4.0 and data privacy compliance, while Brazil’s growth stands at 10.5%, supported by rapid digital adoption and expanding cloud infrastructure. Overall, emerging economies like India and China outpace developed markets, driven by aggressive cloud deployment and digitalization initiatives.

The report covers an in-depth analysis of 40+ countries; seven top-performing OECD countries are highlighted below.

Growth Outlook of the Public Cloud Application Services Market in India

The public cloud application services market in India is projected to expand at a CAGR of 25% from 2025 to 2035, driven by increased cloud adoption among SMEs and large enterprises seeking scalable and cost-efficient IT solutions. The expansion of data center infrastructure and supportive government policies promoting cloud-first strategies are key catalysts.

Additionally, the thriving startup ecosystem in India is leveraging cloud technologies extensively for innovation and growth. The demand for AI, machine learning, and analytics within cloud platforms is rising sharply, boosting the overall market expansion. Major global and local cloud providers are investing heavily in the country to capitalize on this growth opportunity.

  • Growing government initiatives promoting cloud adoption
  • Expanding startup ecosystem leveraging cloud solutions
  • Increasing investments in cloud infrastructure and data centers

China Public Cloud Application Services Market Outlook

Revenue from public cloud application services in China is expected to grow at a CAGR of 22% from 2025 to 2035, fueled by its vast digital economy and intense focus on technological innovation. Enterprises across industries are rapidly migrating traditional IT workloads to the cloud to improve agility and operational efficiency. Government-backed smart city projects and digital infrastructure initiatives accelerate cloud adoption further.

The integration of AI, IoT, and big data into cloud platforms supports new applications and services, driving demand. Additionally, hybrid and multi-cloud models are gaining traction in China, with local cloud providers like Alibaba Cloud and Tencent Cloud competing strongly alongside global players.

  • Rapid digitization of traditional industries
  • Government support for cloud-based smart city initiatives
  • Increasing enterprise adoption of hybrid and multi-cloud models

Dynamics of the USA Public Cloud Application Services Market

Sales of public cloud application services in the USA are expected to expand at a CAGR of 14% from 2025 to 2035, driven by the country’s mature cloud infrastructure and technological leadership. Large enterprises lead adoption due to their extensive IT needs and focus on digital innovation, leveraging cloud platforms for mission-critical applications.

The growth is bolstered by advancements in SaaS, PaaS, and IaaS offerings. Increasing emphasis on cloud security, compliance, and hybrid cloud deployment supports further uptake. SMBs are also rapidly adopting cloud solutions as affordability and flexibility improve. Leading providers such as AWS, Microsoft Azure, and Google Cloud innovate continuously to maintain competitive advantage in this dynamic market.

  • High penetration of cloud services in enterprise IT
  • Continuous innovation by leading cloud vendors
  • Strong demand for SaaS, PaaS, and IaaS offerings

South Korea Public Cloud Application Services Market Outlook

Revenue from public cloud application services in South Korea is projected to grow at a CAGR of 13.5% from 2025 to 2035, driven by its advanced industrial base and government initiatives promoting cloud adoption. The nation’s aggressive rollout of 5G technology enhances cloud capabilities, leading to increased demand for cloud-hosted IoT and real-time analytics solutions.

Manufacturing, finance, and telecommunications sectors are the leading adopters, leveraging cloud platforms for operational efficiency and innovation. The government’s cloud-first policies encourage digital transformation across public and private domains. Collaboration between cloud providers and local enterprises fosters customized cloud solutions, supporting sustained market growth.

  • Government policies encouraging cloud transformation
  • Rising use of cloud in manufacturing and finance
  • Collaboration between cloud vendors and local enterprises

Growth Outlook of Public Cloud Application Services Market in Japan

Demand for public cloud application services in Japan is expected to grow at a CAGR of 12% from 2025 to 2035, propelled by steady digital modernization in enterprise and government sectors. There is significant investment in AI and machine learning applications integrated into cloud platforms to enhance business intelligence and automation.

Hybridity in cloud deployment, combining on-premises and public cloud resources, remains popular due to stringent security and compliance requirements. Japan’s enterprises also prioritize improving cloud security frameworks to safeguard sensitive data. Partnerships between global cloud providers and Japanese companies enable advanced, localized cloud solutions, supporting market expansion and innovation in this mature but evolving landscape.

  • Adoption of cloud for digital government services
  • Focus on AI and machine learning in cloud applications
  • Partnerships between global and local cloud providers

Expansion of Public Cloud Application Services Market in Germany

Revenue from public cloud application services in Germany is projected to expand at a CAGR of 11% from 2025 to 2035, driven by the country’s strong industrial base and commitment to digital innovation. Enterprises across manufacturing, automotive, and finance sectors are accelerating cloud adoption to enhance operational efficiency and support Industry 4.0 initiatives.

The government’s emphasis on data privacy and compliance shapes cloud strategies, with hybrid cloud solutions gaining prevalence. German organizations increasingly adopt cloud services to improve scalability, reduce costs, and foster agile business models. Additionally, investments in cloud security and IT infrastructure enable companies to transition confidently to cloud environments, contributing to steady market growth.

  • Strong industrial focus on digital transformation
  • Growing investments in cloud security and energy-efficient infrastructure
  • Expansion of cloud use in manufacturing and finance sectors

Dynamics of Public Cloud Application Services Market in Brazil

Demand for public cloud application services in Brazil is expected to grow at a CAGR of 10.5% from 2025 to 2035, supported by rapid digital adoption and expansion of internet connectivity. Brazilian enterprises, especially in retail, financial services, and government sectors, are migrating to the cloud to improve service delivery and increase operational flexibility. The country benefits from growing investments in data center infrastructure and cloud ecosystems, alongside supportive regulatory reforms aimed at boosting digital economy growth. Cloud adoption in Brazil is driven by demand for scalable, cost-efficient IT resources, enabling organizations to innovate and adapt swiftly to evolving market demands.
  • Rapid digital adoption across industries
  • Expansion of cloud infrastructure and data centers
  • Growing emphasis on cost optimization and agility

Competitive Landscape of Public Cloud Application Services Market

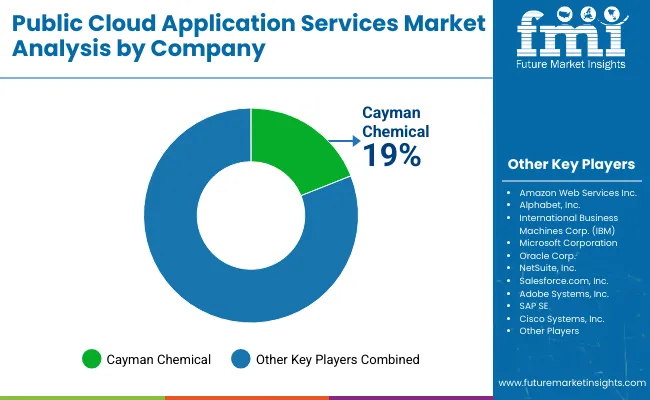
Public Cloud Application Services Market By Company

The market is moderately consolidated, featuring leading cloud providers with varying strengths in infrastructure, service offerings, and industry specialization. Amazon Web Services (AWS), Microsoft Azure, and Google Cloud dominate the market, leveraging their vast global infrastructure, advanced AI and analytics capabilities, and broad enterprise service portfolios. Their competitive edge lies in innovation, scalability, regulatory compliance, and integrated security features.

Other key players like IBM Cloud and Oracle Cloud differentiate through hybrid cloud solutions, catering to industries with strict data residency and compliance needs. Regional providers such as Alibaba Cloud and Tencent Cloud focus on local market expertise, tailoring services to domestic enterprise demands and regulatory environments, especially in Asia-Pacific regions. Smaller specialized cloud vendors carve niches by providing customized cloud applications and vertical-specific solutions.

Entry barriers in this market are significant due to the high capital investment in data centers, technology innovation, and stringent security and compliance standards. Market competitiveness increasingly hinges on global network reach, service reliability, customer support, and continuous technological advancements to meet evolving enterprise requirements.

Key Developments in the Public Cloud Application Services Market

In April 2025, TCS launched three India-focused offerings, TCS SovereignSecure™ Cloud, TCS DigiBOLT™, and TCS Cyber Defense Suite, at its “Accelerating India” event in New Delhi, reinforcing its commitment to secure, sovereign, and sustainable digital growth for India’s AI-driven future.

Report Scope - Public Cloud Application Services Market

Items Values
Quantitative Units (2025) USD 245.9 million
Application Business Intelligence Application, Customer Relationship Management, Digital Content Application, ERP Application, Enterprise Content Management, Office Suites, Project Management, Supply Chain Management, Social Software Suites, and Application Software
Enterprise Large Enterprises and Small & Medium Enterprises (SMEs)
Vertical BFSI, Healthcare, Telecommunication, Media & Entertainment, Energy & Utilities, Retail/Wholesale, Manufacturing, Transportation, and Others (including Education, Government, and Hospitality)
Regions Covered North America, Europe, Asia-Pacific, Latin America, and Middle East & Africa
Countries Covered United States, Canada, Germany, France, United Kingdom, China, Japan, India, Brazil, South Africa, Australia and 40+ countries
Key Companies Profiled Amazon Web Services Inc., Alphabet, Inc., International Business Machines Corp. (IBM), Microsoft Corporation, Oracle Corp., NetSuite, Inc., Salesforce.com, Inc., Adobe Systems, Inc., SAP SE, and Cisco Systems, Inc.
Additional Attributes Dollar sales by application and enterprise , regional demand trends, competitive landscape, enterprise adoption drivers for cloud migration, integration with compliance and security frameworks, innovations in AI/ML, serverless and edge technologies, standardization of performance and service quality across diverse industry verticals

Key Segments

By Application:

  • Business Intelligence Application
  • Customer Relationship Management
  • Digital Content Application
  • ERP Application
  • Enterprise Content Management
  • Office Suites
  • Project Management
  • Supply Chain Management
  • Social Software Suites
  • Application Software

By Enterprise:

  • Large Enterprise
  • Small & Medium Enterprise

By Vertical:

  • Government
  • BFSI
  • Healthcare
  • Telecommunication
  • Media & Entertainment
  • Energy & Utilities
  • Retail/ Wholesale
  • Manufacturing
  • Transportation
  • Others

By Region:

  • North America
  • Latin America
  • Europe
  • East Asia
  • South Asia & Pacific
  • MEA

Table of Content

  1. Executive Summary
    • Global Market Outlook
    • Demand-side Trends
    • Supply-side Trends
    • Technology Roadmap Analysis
    • Analysis and Recommendations
  2. Market Overview
    • Market Coverage / Taxonomy
    • Market Definition / Scope / Limitations
  3. Market Background
    • Market Dynamics
      • Drivers
      • Restraints
      • Opportunity
      • Trends
    • Scenario Forecast
      • Demand in Optimistic Scenario
      • Demand in Likely Scenario
      • Demand in Conservative Scenario
    • Opportunity Map Analysis
    • Product Life Cycle Analysis
    • Supply Chain Analysis
      • Supply Side Participants and their Roles
        • Producers
        • Mid-Level Participants (Traders/ Agents/ Brokers)
        • Wholesalers and Distributors
      • Value Added and Value Created at Node in the Supply Chain
      • List of Raw Material Suppliers
      • List of Existing and Potential Buyer’s
    • Investment Feasibility Matrix
    • Value Chain Analysis
      • Profit Margin Analysis
      • Wholesalers and Distributors
      • Retailers
    • PESTLE and Porter’s Analysis
    • Regulatory Landscape
      • By Key Regions
      • By Key Countries
    • Regional Parent Market Outlook
    • Production and Consumption Statistics
    • Import and Export Statistics
  4. Global Market Analysis 2020-2024 and Forecast, 2025-2035
    • Historical Market Size Value (USD Million) & Volume (Kilobytes) Analysis, 2020-2024
    • Current and Future Market Size Value (USD Million) & Volume (Kilobytes) Projections, 2025-2035
      • Y-o-Y Growth Trend Analysis
      • Absolute $ Opportunity Analysis
  5. Global Market Pricing Analysis 2020-2024 and Forecast 2025-2035
  6. Global Market Analysis 2020-2024 and Forecast 2025-2035, By Application
    • Introduction / Key Findings
    • Historical Market Size Value (USD Million) & Volume (Kilobytes) Analysis By Application, 2020-2024
    • Current and Future Market Size Value (USD Million) & Volume (Kilobytes) Analysis and Forecast By Application, 2025-2035
      • Business Intelligence Application
      • Customer Relationship Management
      • Digital Content Application
      • ERP Application
      • Enterprise Content Management
      • Office Suites
      • Project Management
      • Supply Chain Management
      • Social Software Suites
      • Application Software
    • Y-o-Y Growth Trend Analysis By Application, 2020-2024
    • Absolute $ Opportunity Analysis By Application, 2025-2035
  7. Global Market Analysis 2020-2024 and Forecast 2025-2035, By Enterprise
    • Introduction / Key Findings
    • Historical Market Size Value (USD Million) & Volume (Kilobytes) Analysis By Enterprise, 2020-2024
    • Current and Future Market Size Value (USD Million) & Volume (Kilobytes) Analysis and Forecast By Enterprise, 2025-2035
      • Large Enterprise
      • Small & Medium Enterprise
    • Y-o-Y Growth Trend Analysis By Enterprise, 2020-2024
    • Absolute $ Opportunity Analysis By Enterprise, 2025-2035
  8. Global Market Analysis 2020-2024 and Forecast 2025-2035, By Vertical
    • Introduction / Key Findings
    • Historical Market Size Value (USD Million) & Volume (Kilobytes) Analysis By Vertical, 2020-2024
    • Current and Future Market Size Value (USD Million) & Volume (Kilobytes) Analysis and Forecast By Vertical, 2025-2035
      • BFSI
      • Healthcare
      • Telecommunication
      • Media & Entertainment
      • Energy & Utilities
      • Retail/ Wholesale
      • Manufacturing
      • Transportation
      • Others (Education, Government, and Hospitality)
    • Y-o-Y Growth Trend Analysis By Vertical, 2020-2024
    • Absolute $ Opportunity Analysis By Vertical, 2025-2035
  9. Global Market Analysis 2020-2024 and Forecast 2025-2035, By Region
    • Introduction
    • Historical Market Size Value (USD Million) & Volume (Kilobytes) Analysis By Region, 2020-2024
    • Current Market Size Value (USD Million) & Volume (Kilobytes) Analysis and Forecast By Region, 2025-2035
      • North America
      • Latin America
      • Western Europe
      • Eastern Europe
      • East Asia
      • South Asia & Pacific
      • Middle East and Africa
    • Market Attractiveness Analysis By Region
  10. North America Market Analysis 2020-2024 and Forecast 2025-2035, By Country
    • Historical Market Size Value (USD Million) & Volume (Kilobytes) Trend Analysis By Market Taxonomy, 2020-2024
    • Market Size Value (USD Million) & Volume (Kilobytes) Forecast By Market Taxonomy, 2025-2035
      • By Country
        • U.S.
        • Canada
        • Mexico
      • By Application
      • By Enterprise
      • By Vertical
    • Market Attractiveness Analysis
      • By Country
      • By Application
      • By Enterprise
      • By Vertical
    • Key Takeaways
  11. Latin America Market Analysis 2020-2024 and Forecast 2025-2035, By Country
    • Historical Market Size Value (USD Million) & Volume (Kilobytes) Trend Analysis By Market Taxonomy, 2020-2024
    • Market Size Value (USD Million) & Volume (Kilobytes) Forecast By Market Taxonomy, 2025-2035
      • By Country
        • Brazil
        • Argentina
        • Rest of LATAM
      • By Application
      • By Enterprise
      • By Vertical
    • Market Attractiveness Analysis
      • By Country
      • By Application
      • By Enterprise
      • By Vertical
    • Key Takeaways
  12. Western Europe Market Analysis 2020-2024 and Forecast 2025-2035, By Country
    • Historical Market Size Value (USD Million) & Volume (Kilobytes) Trend Analysis By Market Taxonomy, 2020-2024
    • Market Size Value (USD Million) & Volume (Kilobytes) Forecast By Market Taxonomy, 2025-2035
      • By Country
        • Germany
        • Italy
        • France
        • UK
        • Spain
        • BENELUX
        • Nordic
        • Rest of W.Europe
      • By Application
      • By Enterprise
      • By Vertical
    • Market Attractiveness Analysis
      • By Country
      • By Application
      • By Enterprise
      • By Vertical
    • Key Takeaways
  13. Eastern Europe Market Analysis 2020-2024 and Forecast 2025-2035, By Country
    • Historical Market Size Value (USD Million) & Volume (Kilobytes) Trend Analysis By Market Taxonomy, 2020-2024
    • Market Size Value (USD Million) & Volume (Kilobytes) Forecast By Market Taxonomy, 2025-2035
      • By Country
        • Russia
        • Hungary
        • Poland
        • Balkan & Baltics
        • Rest of E. Europe
      • By Application
      • By Enterprise
      • By Vertical
    • Market Attractiveness Analysis
      • By Country
      • By Application
      • By Enterprise
      • By Vertical
    • Key Takeaways
  14. East Asia Market Analysis 2020-2024 and Forecast 2025-2035, By Country
    • Historical Market Size Value (USD Million) & Volume (Kilobytes) Trend Analysis By Market Taxonomy, 2020-2024
    • Market Size Value (USD Million) & Volume (Kilobytes) Forecast By Market Taxonomy, 2025-2035
      • By Country
        • China
        • Japan
        • South Korea
      • By Application
      • By Enterprise
      • By Vertical
    • Market Attractiveness Analysis
      • By Country
      • By Application
      • By Enterprise
      • By Vertical
    • Key Takeaways
  15. South Asia & Pacific Market Analysis 2020-2024 and Forecast 2025-2035, By Country
    • Historical Market Size Value (USD Million) & Volume (Kilobytes) Trend Analysis By Market Taxonomy, 2020-2024
    • Market Size Value (USD Million) & Volume (Kilobytes) Forecast By Market Taxonomy, 2025-2035
      • By Country
        • India
        • Australia & New Zealand
        • ASEAN
        • Rest of SAP
      • By Application
      • By Enterprise
      • By Vertical
    • Market Attractiveness Analysis
      • By Country
      • By Application
      • By Enterprise
      • By Vertical
    • Key Takeaways
  16. Middle East and Africa Market Analysis 2020-2024 and Forecast 2025-2035, By Country
    • Historical Market Size Value (USD Million) & Volume (Kilobytes) Trend Analysis By Market Taxonomy, 2020-2024
    • Market Size Value (USD Million) & Volume (Kilobytes) Forecast By Market Taxonomy, 2025-2035
      • By Country
        • GCC Countries
        • Northern Africa
        • South Africa
        • Turkiye
        • Rest of MEA
      • By Application
      • By Enterprise
      • By Vertical
    • Market Attractiveness Analysis
      • By Country
      • By Application
      • By Enterprise
      • By Vertical
    • Key Takeaways
  17. Key Countries Market Analysis
    • U.S.
      • Pricing Analysis
      • Market Share Analysis, 2024
        • By Application
        • By Enterprise
        • By Vertical
    • Canada
      • Pricing Analysis
      • Market Share Analysis, 2024
        • By Application
        • By Enterprise
        • By Vertical
    • Brazil
      • Pricing Analysis
      • Market Share Analysis, 2024
        • By Application
        • By Enterprise
        • By Vertical
    • Mexico
      • Pricing Analysis
      • Market Share Analysis, 2024
        • By Application
        • By Enterprise
        • By Vertical
    • Argentina
      • Pricing Analysis
      • Market Share Analysis, 2024
        • By Application
        • By Enterprise
        • By Vertical
  18. Market Structure Analysis
    • Competition Dashboard
    • Competition Benchmarking
    • Market Share Analysis of Top Players
      • By Regional
      • By Application
      • By Enterprise
      • By Vertical
  19. Competition Analysis
    • Competition Deep Dive
      • Amazon Web Services Inc.
        • Overview
        • Product Portfolio
        • Profitability by Market Segments (Product/Age /Sales Channel/Region)
        • Sales Footprint
        • Strategy Overview
          • Marketing Strategy
          • Product Strategy
          • Channel Strategy
      • Alphabet, Inc.
        • Overview
        • Product Portfolio
        • Profitability by Market Segments (Product/Age /Sales Channel/Region)
        • Sales Footprint
        • Strategy Overview
          • Marketing Strategy
          • Product Strategy
          • Channel Strategy
      • International Business Machines Corp.
        • Overview
        • Product Portfolio
        • Profitability by Market Segments (Product/Age /Sales Channel/Region)
        • Sales Footprint
        • Strategy Overview
          • Marketing Strategy
          • Product Strategy
          • Channel Strategy
      • Microsoft Corporation
        • Overview
        • Product Portfolio
        • Profitability by Market Segments (Product/Age /Sales Channel/Region)
        • Sales Footprint
        • Strategy Overview
          • Marketing Strategy
          • Product Strategy
          • Channel Strategy
      • Oracle Corp.
        • Overview
        • Product Portfolio
        • Profitability by Market Segments (Product/Age /Sales Channel/Region)
        • Sales Footprint
        • Strategy Overview
          • Marketing Strategy
          • Product Strategy
          • Channel Strategy
      • NetSuite, Inc.
        • Overview
        • Product Portfolio
        • Profitability by Market Segments (Product/Age /Sales Channel/Region)
        • Sales Footprint
        • Strategy Overview
          • Marketing Strategy
          • Product Strategy
          • Channel Strategy
      • Salesforce.com, Inc.
        • Overview
        • Product Portfolio
        • Profitability by Market Segments (Product/Age /Sales Channel/Region)
        • Sales Footprint
        • Strategy Overview
          • Marketing Strategy
          • Product Strategy
          • Channel Strategy
      • Adobe Systems, Inc.
        • Overview
        • Product Portfolio
        • Profitability by Market Segments (Product/Age /Sales Channel/Region)
        • Sales Footprint
        • Strategy Overview
          • Marketing Strategy
          • Product Strategy
          • Channel Strategy
      • SAP SE
        • Overview
        • Product Portfolio
        • Profitability by Market Segments (Product/Age /Sales Channel/Region)
        • Sales Footprint
        • Strategy Overview
          • Marketing Strategy
          • Product Strategy
          • Channel Strategy
      • Cisco Systems, Inc.
        • Overview
        • Product Portfolio
        • Profitability by Market Segments (Product/Age /Sales Channel/Region)
        • Sales Footprint
        • Strategy Overview
          • Marketing Strategy
          • Product Strategy
          • Channel Strategy
  20. Assumptions & Acronyms Used
  21. Research Methodology

List of Tables

  • Table 1: Global Market Value (USD Million) Forecast by Region, 2020-2035
  • Table 2: Global Market Volume (Kilobytes) Forecast by Region, 2020-2035
  • Table 3: Global Market Value (USD Million) Forecast by Application, 2020-2035
  • Table 4: Global Market Volume (Kilobytes) Forecast by Application, 2020-2035
  • Table 5: Global Market Value (USD Million) Forecast by Enterprise, 2020-2035
  • Table 6: Global Market Volume (Kilobytes) Forecast by Enterprise, 2020-2035
  • Table 7: Global Market Value (USD Million) Forecast by Vertical, 2020-2035
  • Table 8: Global Market Volume (Kilobytes) Forecast by Vertical, 2020-2035
  • Table 9: North America Market Value (USD Million) Forecast by Country, 2020-2035
  • Table 10: North America Market Volume (Kilobytes) Forecast by Country, 2020-2035
  • Table 11: North America Market Value (USD Million) Forecast by Application, 2020-2035
  • Table 12: North America Market Volume (Kilobytes) Forecast by Application, 2020-2035
  • Table 13: North America Market Value (USD Million) Forecast by Enterprise, 2020-2035
  • Table 14: North America Market Volume (Kilobytes) Forecast by Enterprise, 2020-2035
  • Table 15: North America Market Value (USD Million) Forecast by Vertical, 2020-2035
  • Table 16: North America Market Volume (Kilobytes) Forecast by Vertical, 2020-2035
  • Table 17: Latin America Market Value (USD Million) Forecast by Country, 2020-2035
  • Table 18: Latin America Market Volume (Kilobytes) Forecast by Country, 2020-2035
  • Table 19: Latin America Market Value (USD Million) Forecast by Application, 2020-2035
  • Table 20: Latin America Market Volume (Kilobytes) Forecast by Application, 2020-2035
  • Table 21: Latin America Market Value (USD Million) Forecast by Enterprise, 2020-2035
  • Table 22: Latin America Market Volume (Kilobytes) Forecast by Enterprise, 2020-2035
  • Table 23: Latin America Market Value (USD Million) Forecast by Vertical, 2020-2035
  • Table 24: Latin America Market Volume (Kilobytes) Forecast by Vertical, 2020-2035
  • Table 25: Western Europe Market Value (USD Million) Forecast by Country, 2020-2035
  • Table 26: Western Europe Market Volume (Kilobytes) Forecast by Country, 2020-2035
  • Table 27: Western Europe Market Value (USD Million) Forecast by Application, 2020-2035
  • Table 28: Western Europe Market Volume (Kilobytes) Forecast by Application, 2020-2035
  • Table 29: Western Europe Market Value (USD Million) Forecast by Enterprise, 2020-2035
  • Table 30: Western Europe Market Volume (Kilobytes) Forecast by Enterprise, 2020-2035
  • Table 31: Western Europe Market Value (USD Million) Forecast by Vertical, 2020-2035
  • Table 32: Western Europe Market Volume (Kilobytes) Forecast by Vertical, 2020-2035
  • Table 33: Eastern Europe Market Value (USD Million) Forecast by Country, 2020-2035
  • Table 34: Eastern Europe Market Volume (Kilobytes) Forecast by Country, 2020-2035
  • Table 35: Eastern Europe Market Value (USD Million) Forecast by Application, 2020-2035
  • Table 36: Eastern Europe Market Volume (Kilobytes) Forecast by Application, 2020-2035
  • Table 37: Eastern Europe Market Value (USD Million) Forecast by Enterprise, 2020-2035
  • Table 38: Eastern Europe Market Volume (Kilobytes) Forecast by Enterprise, 2020-2035
  • Table 39: Eastern Europe Market Value (USD Million) Forecast by Vertical, 2020-2035
  • Table 40: Eastern Europe Market Volume (Kilobytes) Forecast by Vertical, 2020-2035
  • Table 41: East Asia Market Value (USD Million) Forecast by Country, 2020-2035
  • Table 42: East Asia Market Volume (Kilobytes) Forecast by Country, 2020-2035
  • Table 43: East Asia Market Value (USD Million) Forecast by Application, 2020-2035
  • Table 44: East Asia Market Volume (Kilobytes) Forecast by Application, 2020-2035
  • Table 45: East Asia Market Value (USD Million) Forecast by Enterprise, 2020-2035
  • Table 46: East Asia Market Volume (Kilobytes) Forecast by Enterprise, 2020-2035
  • Table 47: East Asia Market Value (USD Million) Forecast by Vertical, 2020-2035
  • Table 48: East Asia Market Volume (Kilobytes) Forecast by Vertical, 2020-2035
  • Table 49: South Asia & Pacific Market Value (USD Million) Forecast by Country, 2020-2035
  • Table 50: South Asia & Pacific Market Volume (Kilobytes) Forecast by Country, 2020-2035
  • Table 51: South Asia & Pacific Market Value (USD Million) Forecast by Application, 2020-2035
  • Table 52: South Asia & Pacific Market Volume (Kilobytes) Forecast by Application, 2020-2035
  • Table 53: South Asia & Pacific Market Value (USD Million) Forecast by Enterprise, 2020-2035
  • Table 54: South Asia & Pacific Market Volume (Kilobytes) Forecast by Enterprise, 2020-2035
  • Table 55: South Asia & Pacific Market Value (USD Million) Forecast by Vertical, 2020-2035
  • Table 56: South Asia & Pacific Market Volume (Kilobytes) Forecast by Vertical, 2020-2035
  • Table 57: Middle East and Africa Market Value (USD Million) Forecast by Country, 2020-2035
  • Table 58: Middle East and Africa Market Volume (Kilobytes) Forecast by Country, 2020-2035
  • Table 59: Middle East and Africa Market Value (USD Million) Forecast by Application, 2020-2035
  • Table 60: Middle East and Africa Market Volume (Kilobytes) Forecast by Application, 2020-2035
  • Table 61: Middle East and Africa Market Value (USD Million) Forecast by Enterprise, 2020-2035
  • Table 62: Middle East and Africa Market Volume (Kilobytes) Forecast by Enterprise, 2020-2035
  • Table 63: Middle East and Africa Market Value (USD Million) Forecast by Vertical, 2020-2035
  • Table 64: Middle East and Africa Market Volume (Kilobytes) Forecast by Vertical, 2020-2035

List of Figures

  • Figure 1: Global Market Volume (Kilobytes) Forecast 2020-2035
  • Figure 2: Global Market Pricing Analysis
  • Figure 3: Global Market Value (USD Million) Forecast 2020-2035
  • Figure 4: Global Market Value Share and BPS Analysis by Application, 2025 and 2035
  • Figure 5: Global Market Y-o-Y Growth Comparison by Application, 2025-2035
  • Figure 6: Global Market Attractiveness Analysis by Application
  • Figure 7: Global Market Value Share and BPS Analysis by Enterprise, 2025 and 2035
  • Figure 8: Global Market Y-o-Y Growth Comparison by Enterprise, 2025-2035
  • Figure 9: Global Market Attractiveness Analysis by Enterprise
  • Figure 10: Global Market Value Share and BPS Analysis by Vertical, 2025 and 2035
  • Figure 11: Global Market Y-o-Y Growth Comparison by Vertical, 2025-2035
  • Figure 12: Global Market Attractiveness Analysis by Vertical
  • Figure 13: Global Market Value (USD Million) Share and BPS Analysis by Region, 2025 and 2035
  • Figure 14: Global Market Y-o-Y Growth Comparison by Region, 2025-2035
  • Figure 15: Global Market Attractiveness Analysis by Region
  • Figure 16: North America Market Incremental $ Opportunity, 2025-2035
  • Figure 17: Latin America Market Incremental $ Opportunity, 2025-2035
  • Figure 18: Western Europe Market Incremental $ Opportunity, 2025-2035
  • Figure 19: Eastern Europe Market Incremental $ Opportunity, 2025-2035
  • Figure 20: East Asia Market Incremental $ Opportunity, 2025-2035
  • Figure 21: South Asia & Pacific Market Incremental $ Opportunity, 2025-2035
  • Figure 22: Middle East and Africa Market Incremental $ Opportunity, 2025-2035
  • Figure 23: North America Market Value Share and BPS Analysis by Country, 2025 and 2035
  • Figure 24: North America Market Value Share and BPS Analysis by Application, 2025 and 2035
  • Figure 25: North America Market Y-o-Y Growth Comparison by Application, 2025-2035
  • Figure 26: North America Market Attractiveness Analysis by Application
  • Figure 27: North America Market Value Share and BPS Analysis by Enterprise, 2025 and 2035
  • Figure 28: North America Market Y-o-Y Growth Comparison by Enterprise, 2025-2035
  • Figure 29: North America Market Attractiveness Analysis by Enterprise
  • Figure 30: North America Market Value Share and BPS Analysis by Vertical, 2025 and 2035
  • Figure 31: North America Market Y-o-Y Growth Comparison by Vertical, 2025-2035
  • Figure 32: North America Market Attractiveness Analysis by Vertical
  • Figure 33: Latin America Market Value Share and BPS Analysis by Country, 2025 and 2035
  • Figure 34: Latin America Market Value Share and BPS Analysis by Application, 2025 and 2035
  • Figure 35: Latin America Market Y-o-Y Growth Comparison by Application, 2025-2035
  • Figure 36: Latin America Market Attractiveness Analysis by Application
  • Figure 37: Latin America Market Value Share and BPS Analysis by Enterprise, 2025 and 2035
  • Figure 38: Latin America Market Y-o-Y Growth Comparison by Enterprise, 2025-2035
  • Figure 39: Latin America Market Attractiveness Analysis by Enterprise
  • Figure 40: Latin America Market Value Share and BPS Analysis by Vertical, 2025 and 2035
  • Figure 41: Latin America Market Y-o-Y Growth Comparison by Vertical, 2025-2035
  • Figure 42: Latin America Market Attractiveness Analysis by Vertical
  • Figure 43: Western Europe Market Value Share and BPS Analysis by Country, 2025 and 2035
  • Figure 44: Western Europe Market Value Share and BPS Analysis by Application, 2025 and 2035
  • Figure 45: Western Europe Market Y-o-Y Growth Comparison by Application, 2025-2035
  • Figure 46: Western Europe Market Attractiveness Analysis by Application
  • Figure 47: Western Europe Market Value Share and BPS Analysis by Enterprise, 2025 and 2035
  • Figure 48: Western Europe Market Y-o-Y Growth Comparison by Enterprise, 2025-2035
  • Figure 49: Western Europe Market Attractiveness Analysis by Enterprise
  • Figure 50: Western Europe Market Value Share and BPS Analysis by Vertical, 2025 and 2035
  • Figure 51: Western Europe Market Y-o-Y Growth Comparison by Vertical, 2025-2035
  • Figure 52: Western Europe Market Attractiveness Analysis by Vertical
  • Figure 53: Eastern Europe Market Value Share and BPS Analysis by Country, 2025 and 2035
  • Figure 54: Eastern Europe Market Value Share and BPS Analysis by Application, 2025 and 2035
  • Figure 55: Eastern Europe Market Y-o-Y Growth Comparison by Application, 2025-2035
  • Figure 56: Eastern Europe Market Attractiveness Analysis by Application
  • Figure 57: Eastern Europe Market Value Share and BPS Analysis by Enterprise, 2025 and 2035
  • Figure 58: Eastern Europe Market Y-o-Y Growth Comparison by Enterprise, 2025-2035
  • Figure 59: Eastern Europe Market Attractiveness Analysis by Enterprise
  • Figure 60: Eastern Europe Market Value Share and BPS Analysis by Vertical, 2025 and 2035
  • Figure 61: Eastern Europe Market Y-o-Y Growth Comparison by Vertical, 2025-2035
  • Figure 62: Eastern Europe Market Attractiveness Analysis by Vertical
  • Figure 63: East Asia Market Value Share and BPS Analysis by Country, 2025 and 2035
  • Figure 64: East Asia Market Value Share and BPS Analysis by Application, 2025 and 2035
  • Figure 65: East Asia Market Y-o-Y Growth Comparison by Application, 2025-2035
  • Figure 66: East Asia Market Attractiveness Analysis by Application
  • Figure 67: East Asia Market Value Share and BPS Analysis by Enterprise, 2025 and 2035
  • Figure 68: East Asia Market Y-o-Y Growth Comparison by Enterprise, 2025-2035
  • Figure 69: East Asia Market Attractiveness Analysis by Enterprise
  • Figure 70: East Asia Market Value Share and BPS Analysis by Vertical, 2025 and 2035
  • Figure 71: East Asia Market Y-o-Y Growth Comparison by Vertical, 2025-2035
  • Figure 72: East Asia Market Attractiveness Analysis by Vertical
  • Figure 73: South Asia & Pacific Market Value Share and BPS Analysis by Country, 2025 and 2035
  • Figure 74: South Asia & Pacific Market Value Share and BPS Analysis by Application, 2025 and 2035
  • Figure 75: South Asia & Pacific Market Y-o-Y Growth Comparison by Application, 2025-2035
  • Figure 76: South Asia & Pacific Market Attractiveness Analysis by Application
  • Figure 77: South Asia & Pacific Market Value Share and BPS Analysis by Enterprise, 2025 and 2035
  • Figure 78: South Asia & Pacific Market Y-o-Y Growth Comparison by Enterprise, 2025-2035
  • Figure 79: South Asia & Pacific Market Attractiveness Analysis by Enterprise
  • Figure 80: South Asia & Pacific Market Value Share and BPS Analysis by Vertical, 2025 and 2035
  • Figure 81: South Asia & Pacific Market Y-o-Y Growth Comparison by Vertical, 2025-2035
  • Figure 82: South Asia & Pacific Market Attractiveness Analysis by Vertical
  • Figure 83: Middle East and Africa Market Value Share and BPS Analysis by Country, 2025 and 2035
  • Figure 84: Middle East and Africa Market Value Share and BPS Analysis by Application, 2025 and 2035
  • Figure 85: Middle East and Africa Market Y-o-Y Growth Comparison by Application, 2025-2035
  • Figure 86: Middle East and Africa Market Attractiveness Analysis by Application
  • Figure 87: Middle East and Africa Market Value Share and BPS Analysis by Enterprise, 2025 and 2035
  • Figure 88: Middle East and Africa Market Y-o-Y Growth Comparison by Enterprise, 2025-2035
  • Figure 89: Middle East and Africa Market Attractiveness Analysis by Enterprise
  • Figure 90: Middle East and Africa Market Value Share and BPS Analysis by Vertical, 2025 and 2035
  • Figure 91: Middle East and Africa Market Y-o-Y Growth Comparison by Vertical, 2025-2035
  • Figure 92: Middle East and Africa Market Attractiveness Analysis by Vertical
  • Figure 93: Global Market - Tier Structure Analysis
  • Figure 94: Global Market - Company Share Analysis

Frequently Asked Questions

How is the Public Cloud Application Services Market Growing?

The public cloud application services market is predicted to grow at 23.5% CAGR through 2032.

Which Region Holds the Highest Revenue Potential in the Public Cloud Application Services Market?

North America public cloud application services market holds the highest revenue potential.

What is the Future Scope of Growth for the Public Cloud Application Services Market?

The public cloud application services market is expected to surpass USD 1,073 Billion by 2032.

What is the Current Public Cloud Application Services Market Size?

The public cloud application services market size is anticipated to be over USD 130 Billion in 2022.

Explore Similar Insights

Future Market Insights

Public Cloud Application Services Market

Chat With

MaRIA

Hi There, I am MaRIA, Your Market Research Intelligence Assistant. How may I help you?