Public Cloud Application Infrastructure Services Market
Market Insights on Public Cloud Application Infrastructure Services covering sales outlook, demand forecast & up-to-date key trends
Public Cloud Application Infrastructure Services Market By Application Type (Application Development, Business Intelligence Platform, Database Management Systems), Service (Data Services, Application Platforms, Integration services), Enterprise Size (Large Enterprise, SME), Verticals (Government, BFSI, Healthcare, Telecommunication, Retail/ Wholesale) & Region - Forecast to 2020 - 2030
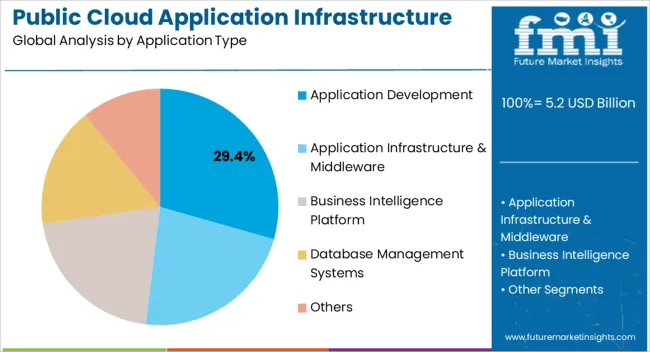
Application Infrastructure & Middleware Segment to cement its Dominance in the Global Public Cloud Application Infrastructure Services Market in the Coming Years
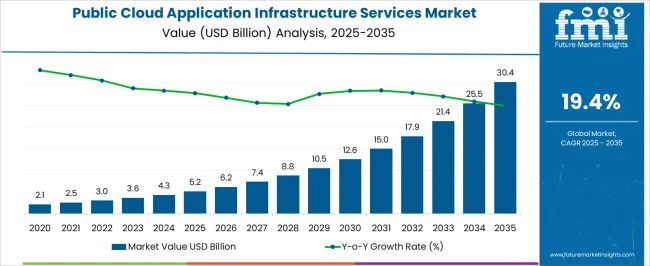
The global public cloud application infrastructure services market is growing at a rapid pace all over the globe. This growth can be attributed to the latest change in enterprise business models which have now shifted to cloud based solutions to rev up infrastructure flexibility.
An important driver for this public cloud application infrastructure services market is the rapidly increasing popularity of cloud computing and its adoption by the companies the world over. Some of the advantages of cloud computing are models can be easily deployed and simplified administration of IT infrastructure. Some other advantages of using cloud services include reliable delivery and support of all services using third party apps that are absent in the enterprise firewall.
A public cloud is based on the standard cloud computing model, in which a service provider makes available to the general public resources such as applications and storage facilities through the internet. Infrastructure as a Service (IaaS) is a type of cloud computing in which virtualized computing resources are provided through the internet. IaaS is one of the three main categories of cloud computing, along with Software as a Service (SaaS) and Platform as a Service (PaaS).
Let us know your requirement to get
100% FREE customization
North America Market Set to Dominate the Global Public Cloud Application Infrastructure Services Market in Terms of Revenue
The market in North America is set to dominate the global public cloud application infrastructure services market in terms of value and this trend is projected to sustain itself throughout the assessment period. North America public cloud application infrastructure services market is the most attractive market, growing at a robust CAGR over the assessment period.
Application Infrastructure & Middleware Segment Poised to Touch a Value of Nearly US$ 8,236 Mn in 2022
As per the assessment of Future Market Insights, the application infrastructure & middleware segment is expected to reach a value of nearly US$ 8,236 Mn in the year 2022. This represents a robust CAGR during the assessment period of 2017-2022. Application infrastructure & middleware segment is expected to account for nearly one-third of the revenue share of the application type segment by the year 2017 and is expected to gain market share by the end of the year 2022.
Find your sweet spots for generating winning opportunities in this market.
Talk to AnalystGovernment Segment to exhibit a CAGR of 20.1% During the Assessment Period
As per the assessment of Future Market Insights, the government segment is slated to touch a figure of nearly US$ 2,977 Mn in the year 2022. This represents a CAGR of 20.1% during the assessment period from 2017 till the year 2022. This segment is expected to lose market share by the end of the year 2022. The government segment is expected to account for more than one-tenth of the revenue share of the vertical segment by the year 2017.
Competition Tracking
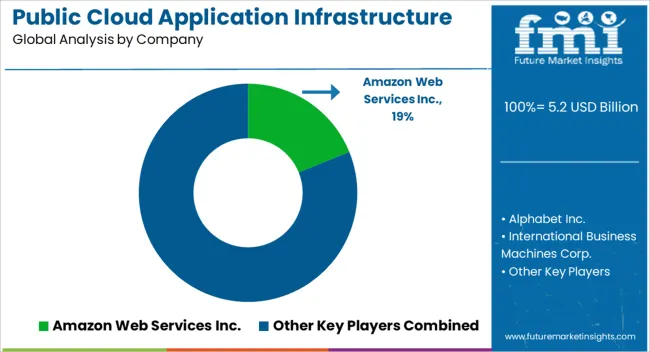
The report also profiles companies that are expected to remain active in the expansion of global public cloud application infrastructure services market through 2022, which include Amazon Web Services Inc., Alphabet, Inc., International Business Machines Corp., Microsoft Corporation, Oracle Corp., ServiceNow, Inc., Salesforce.com, Inc., VMware, Inc., NetSuite, Inc. and Red Hat, Inc.

A unified Market Research Subscription Platform, built for today's disparate research needs.
Public Cloud Application Infrastructure Services Market: Segmentation
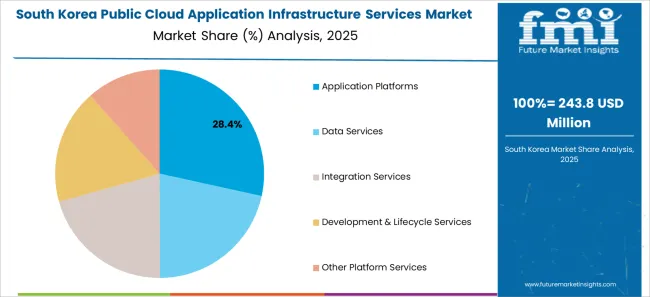
The global public cloud application infrastructure services market is segmented in detail to cover every aspect of the market and present a complete market intelligence approach to readers.
Application Type
- Application Development
- Application Infrastructure & Middleware
- Business Intelligence Platform
- Database Management Systems
- Others
By Services
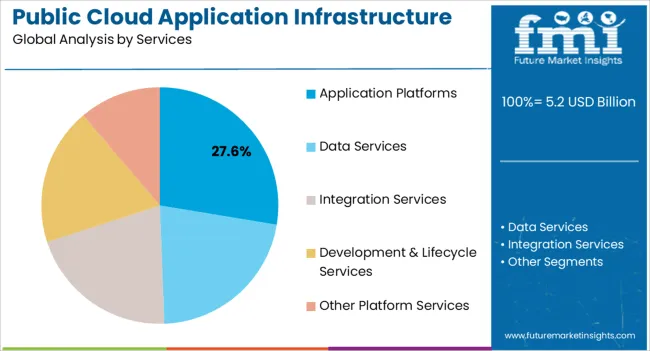
- Data Services
- Application Platforms
- Integration services
- Development & Lifecycle Services
- Other Platform Services
By Enterprise Size
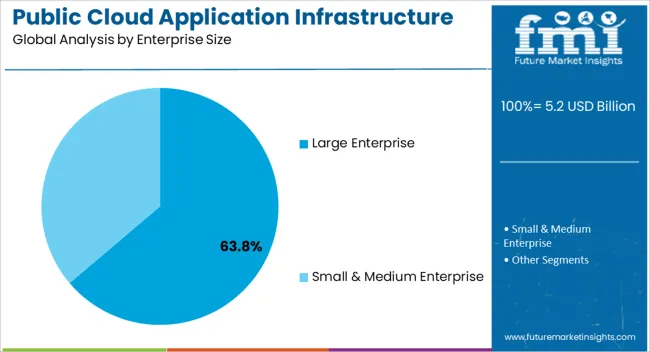
- Large Enterprise
- Small & Medium Enterprise
By Verticals
- Government
- BFSI
- Healthcare
- Telecommunication
- Media & Entertainment
- Energy & Utilities
- Retail/ Wholesale
- Manufacturing
- Transportation
- Others
By Region
- North America
- Latin America
- Europe
- East Asia
- South Asia & Pacific
- MEA
Frequently Asked Questions
What are the future prospects of public cloud application infrastructure services market?
The public cloud application infrastructure services provider are continually focusing on providing robust cloud networking, storage, and computing services by improving services offerings to meet customer demands and increase the company’s growth.
What are the major challenges for Public Cloud Application Infrastructure Services Market?
Lack of resources, security issues and data privacy which is a major challenge for the public cloud application infrastructure services Market.
Which application will have significant revenue growth in the next five years?
The application infrastructure & middleware segment has been considered as largest revenue growth in the next five years due to the introducing advanced technology trend such as migration to cloud platforms and services, higher demand for real-time data and analytics.
What are the major opportunities for Public Cloud Application Infrastructure Services Market?
A rapid increase of Internet of Things (IoT) endpoints, and the deployment of artificial intelligence (AI), which is a major opportunities for the public cloud application infrastructure services market.
Which region is expected to be at forefront in the public cloud application infrastructure services market?
The growing need for speedy and low-cost service delivery processes, and complete security while operating in cloud environments, which is, in turn, boosting the growth of the public cloud application infrastructure services market in East Asia region.
Who are the major companies leading Public Cloud Application Infrastructure Services Market?
Prominent companies in the public cloud application infrastructure services market includes Amazon Web Services Inc., Alphabet, Inc., International Business Machines Corp., Microsoft Corporation, Oracle Corp., ServiceNow, Inc., Salesforce.com, Inc., VMware, Inc., NetSuite, Inc. and Red Hat, Inc., and among others.
Table of Content
1. Executive Summary 1.1. Global Market Outlook 1.2. Demand Side Trends 1.3. Supply Side Trends 1.4. Analysis and Recommendations 2. Market Overview 2.1. Market Coverage / Taxonomy 2.2. Market Definition / Scope / Limitations 3. Market Structure Analysis 3.1. Market Analysis by Tier of Companies 3.2. Market Concentration 3.3. Market Share Analysis of Top Players 3.4. Market Presence Analysis 3.4.1. Regional Footprint by Players 3.4.2. Product Footprint by Players 3.4.3. Channel Footprint by Players 4. Global Public Cloud Application Infrastructure Services Demand (in Value or Size in US$ Mn) Analysis 2015-2019 and Forecast, 2020-2030 4.1. Historical Market Value (US$ Mn) Analysis, 2015-2019 4.2. Current and Future Market Value (US$ Mn) Projections, 2020-2030 4.2.1. Y-o-Y Growth Trend Analysis 4.2.2. Absolute $ Opportunity Analysis 5. Market Background 5.1. Macro-Economic Factors 5.1.1. Global GDP Growth Outlook 5.1.2. Global City Growth Outlook 5.1.3. Global ICT Spending Outlook 5.2. Forecast Factors - Relevance & Impact 5.3. Value Chain 5.4. Market Dynamics 5.4.1. Drivers 5.4.2. Restraints 5.4.3. Opportunity Analysis 6. Global Public Cloud Application Infrastructure Services, Key Use Cases (Qualitative) 6.1. How public cloud application infrastructure services used in real-life applications 6.2. Public cloud application infrastructure services for web applications 6.3. Adoption of cloud communication platform for managing, storing and analyzing big data 6.4. Others 7. Global Public Cloud Application Infrastructure Services Analysis 2015-2019 and Forecast 2020-2030, By Application Type 7.1. Introduction / Key Findings 7.2. Historical Market Size (US$ Mn) Analysis By Application Type, 2015 - 2019 7.3. Current and Future Market Size (US$ Mn) Analysis and Forecast By Application Type, 2020 - 2030 7.3.1. Application Development 7.3.2. Application Infrastructure & Middleware 7.3.3. Business Intelligence Platform 7.3.4. Database Management Systems 7.3.5. Others 7.4. Market Attractiveness Analysis By Application Type 8. Global Public Cloud Application Infrastructure Services Analysis 2015-2019 and Forecast 2020-2030, By Services 8.1. Introduction / Key Findings 8.2. Historical Market Size (US$ Mn) Analysis By Services, 2015 - 2019 8.3. Current and Future Market Size (US$ Mn) Analysis and Forecast By Services, 2020 - 2030 8.3.1. Data Services 8.3.2. Application Platforms 8.3.3. Integration services 8.3.4. Development & Lifecycle Services 8.3.5. Other Platform Services 8.4. Market Attractiveness Analysis By Services 9. Global Public Cloud Application Infrastructure Services Analysis 2015-2019 and Forecast 2020-2030, By Enterprise Size 9.1. Introduction / Key Findings 9.2. Historical Market Size (US$ Mn) Analysis By Enterprise Size, 2015 - 2019 9.3. Current and Future Market Size (US$ Mn) Analysis and Forecast By Enterprise Size, 2020 - 2030 9.3.1. Large Enterprise 9.3.2. Small & Medium Enterprise 9.4. Market Attractiveness Analysis By Enterprise Size 10. Global Public Cloud Application Infrastructure Services Analysis 2015-2019 and Forecast 2020-2030, By Verticals 10.1. Introduction / Key Findings 10.2. Historical Market Size (US$ Mn) Analysis By Verticals, 2015 - 2019 10.3. Current and Future Market Size (US$ Mn) Analysis and Forecast By Verticals, 2020 - 2030 10.3.1. Government 10.3.2. BFSI 10.3.3. Healthcare 10.3.4. Telecommunication 10.3.5. Media & Entertainment 10.3.6. Energy & Utilities 10.3.7. Retail/ Wholesale 10.3.8. Manufacturing 10.3.9. Transportation 10.3.10. Others 10.4. Market Attractiveness Analysis By Verticals 11. Global Public Cloud Application Infrastructure Services Analysis 2015-2019 and Forecast 2020-2030, by Region 11.1. Introduction / Key Findings 11.2. Historical Market Size (US$ Mn) Analysis By Region, 2015 - 2019 11.3. Current Market Size (US$ Mn) Analysis and Forecast By Region, 2020 - 2030 11.3.1. North America 11.3.2. Latin America 11.3.3. Europe 11.3.4. East Asia 11.3.5. South Asia & Pacific 11.3.6. Middle East and Africa (MEA) 11.4. Market Attractiveness Analysis By Region 12. North America Public Cloud Application Infrastructure Services Analysis 2015-2019 and Forecast 2020-2030 12.1. Introduction / Key Findings 12.2. Historical Market Size (US$ Mn) Analysis By Market Taxonomy, 2015 - 2019 12.3. Market Size (US$ Mn) Forecast By Market Taxonomy, 2020 - 2030 12.3.1. By Country 12.3.1.1. U.S. 12.3.1.2. Canada 12.3.2. By Application Type 12.3.3. By Services 12.3.4. By Enterprise Size 12.3.5. By Verticals 12.4. Market Attractiveness Analysis 12.4.1. By Country 12.4.2. By Application Type 12.4.3. By Services 12.4.4. By Enterprise Size 12.4.5. By Verticals 12.5. Key Market Participants - Intensity Mapping 12.6. Drivers and Restraints - Impact Analysis 13. Latin America Public Cloud Application Infrastructure Services Analysis 2015-2019 and Forecast 2020-2030 13.1. Introduction / Key Findings 13.2. Historical Market Size (US$ Mn) Analysis By Market Taxonomy, 2015 - 2019 13.3. Market Size (US$ Mn) Forecast By Market Taxonomy, 2020 - 2030 13.3.1. By Country 13.3.1.1. Brazil 13.3.1.2. Mexico 13.3.1.3. Rest of Latin America 13.3.2. By Application Type 13.3.3. By Services 13.3.4. By Enterprise Size 13.3.5. By Verticals 13.4. Market Attractiveness Analysis 13.4.1. By Country 13.4.2. By Application Type 13.4.3. By Services 13.4.4. By Enterprise Size 13.4.5. By Verticals 13.5. Key Market Participants - Intensity Mapping 13.6. Drivers and Restraints - Impact Analysis 14. Europe Public Cloud Application Infrastructure Services Analysis 2015-2019 and Forecast 2020-2030 14.1. Introduction / Key Findings 14.2. Historical Market Size (US$ Mn) Analysis By Market Taxonomy, 2015 - 2019 14.3. Market Size (US$ Mn) Forecast By Market Taxonomy, 2020 - 2030 14.3.1. By Country 14.3.1.1. UK 14.3.1.2. France 14.3.1.3. Germany 14.3.1.4. Italy 14.3.1.5. Spain 14.3.1.6. BENELUX 14.3.1.7. Russia 14.3.2. By Application Type 14.3.3. By Services 14.3.4. By Enterprise Size 14.3.5. By Verticals 14.4. Market Attractiveness Analysis 14.4.1. By Country 14.4.2. By Application Type 14.4.3. By Services 14.4.4. By Enterprise Size 14.4.5. By Verticals 14.5. Key Market Participants - Intensity Mapping 14.6. Drivers and Restraints - Impact Analysis 15. East Asia Public Cloud Application Infrastructure Services Analysis 2015-2019 and Forecast 2020-2030 15.1. Introduction / Key Findings 15.2. Historical Market Size (US$ Mn) Analysis By Market Taxonomy, 2015 - 2019 15.3. Market Size (US$ Mn) Forecast By Market Taxonomy, 2020 - 2030 15.3.1. By Country 15.3.1.1. China 15.3.1.2. Japan 15.3.1.3. South Korea 15.3.2. By Application Type 15.3.3. By Services 15.3.4. By Enterprise Size 15.3.5. By Verticals 15.4. Market Attractiveness Analysis 15.4.1. By Country 15.4.2. By Application Type 15.4.3. By Services 15.4.4. By Enterprise Size 15.4.5. By Verticals 15.5. Key Market Participants - Intensity Mapping 15.6. Drivers and Restraints - Impact Analysis 16. South Asia & Pacific Public Cloud Application Infrastructure Services Analysis 2015-2019 and Forecast 2020-2030 16.1. Introduction / Key Findings 16.2. Historical Market Size (US$ Mn) Analysis By Market Taxonomy, 2015 - 2019 16.3. Market Size (US$ Mn) Forecast By Market Taxonomy, 2020 - 2030 16.3.1. By Country 16.3.1.1. India 16.3.1.2. Thailand 16.3.1.3. Indonesia 16.3.1.4. Malaysia 16.3.1.5. Australia & New Zealand 16.3.2. By Application Type 16.3.3. By Services 16.3.4. By Enterprise Size 16.3.5. By Verticals 16.4. Market Attractiveness Analysis 16.4.1. By Country 16.4.2. By Application Type 16.4.3. By Services 16.4.4. By Enterprise Size 16.4.5. By Verticals 16.5. Key Market Participants - Intensity Mapping 16.6. Drivers and Restraints - Impact Analysis 17. Middle East and Africa Public Cloud Application Infrastructure Services Analysis 2015-2019 and Forecast 2020-2030 17.1. Introduction / Key Findings 17.2. Historical Market Size (US$ Mn) Analysis By Market Taxonomy, 2015 - 2019 17.3. Market Size (US$ Mn) Forecast By Market Taxonomy, 2020 - 2030 17.3.1. By Country 17.3.1.1. GCC Countries 17.3.1.2. Turkey 17.3.1.3. South Africa 17.3.2. By Application Type 17.3.3. By Services 17.3.4. By Enterprise Size 17.3.5. By Verticals 17.4. Market Attractiveness Analysis 17.4.1. By Country 17.4.2. By Application Type 17.4.3. By Services 17.4.4. By Enterprise Size 17.4.5. By Verticals 17.5. Key Market Participants - Intensity Mapping 17.6. Drivers and Restraints - Impact Analysis 18. Key Country Analysis - Public Cloud Application Infrastructure Services Analysis 18.1. U.S. Retail Market 18.1.1. By Application Type 18.1.2. By Services 18.1.3. By Enterprise Size 18.1.4. By Verticals 18.2. Canada Retail Market 18.2.1. By Application Type 18.2.2. By Services 18.2.3. By Enterprise Size 18.2.4. By Verticals 18.3. Brazil Retail Market 18.3.1. By Application Type 18.3.2. By Services 18.3.3. By Enterprise Size 18.3.4. By Verticals 18.4. Mexico Retail Market 18.4.1. By Application Type 18.4.2. By Services 18.4.3. By Enterprise Size 18.4.4. By Verticals 18.5. UK Retail Market 18.5.1. By Application Type 18.5.2. By Services 18.5.3. By Enterprise Size 18.5.4. By Verticals 18.6. Germany Retail Market 18.6.1. By Application Type 18.6.2. By Services 18.6.3. By Enterprise Size 18.6.4. By Verticals 18.7. France Retail Market 18.7.1. By Application Type 18.7.2. By Services 18.7.3. By Enterprise Size 18.7.4. By Verticals 18.8. Spain Retail Market 18.8.1. By Application Type 18.8.2. By Services 18.8.3. By Enterprise Size 18.8.4. By Verticals 18.9. Italy Retail Market 18.9.1. By Application Type 18.9.2. By Services 18.9.3. By Enterprise Size 18.9.4. By Verticals 18.10. BENELUX Retail Market 18.10.1. By Application Type 18.10.2. By Services 18.10.3. By Enterprise Size 18.10.4. By Verticals 18.11. Russia Retail Market 18.11.1. By Application Type 18.11.2. By Services 18.11.3. By Enterprise Size 18.11.4. By Verticals 18.12. China Retail Market 18.12.1. By Application Type 18.12.2. By Services 18.12.3. By Enterprise Size 18.12.4. By Verticals 18.13. Japan Retail Market 18.13.1. By Application Type 18.13.2. By Services 18.13.3. By Enterprise Size 18.13.4. By Verticals 18.14. South Korea Retail Market 18.14.1. By Application Type 18.14.2. By Services 18.14.3. By Enterprise Size 18.14.4. By Verticals 18.15. India Retail Market 18.15.1. By Application Type 18.15.2. By Services 18.15.3. By Enterprise Size 18.15.4. By Verticals 18.16. Thailand Retail Market 18.16.1. By Application Type 18.16.2. By Services 18.16.3. By Enterprise Size 18.16.4. By Verticals 18.17. Indonesia Retail Market 18.17.1. By Application Type 18.17.2. By Services 18.17.3. By Enterprise Size 18.17.4. By Verticals 18.18. Malaysia Retail Market 18.18.1. By Application Type 18.18.2. By Services 18.18.3. By Enterprise Size 18.18.4. By Verticals 18.19. Australia & New Zealand Retail Market 18.19.1. By Application Type 18.19.2. By Services 18.19.3. By Enterprise Size 18.19.4. By Verticals 18.20. GCC Countries Retail Market 18.20.1. By Application Type 18.20.2. By Services 18.20.3. By Enterprise Size 18.20.4. By Verticals 18.21. Turkey Retail Market 18.21.1. By Application Type 18.21.2. By Services 18.21.3. By Enterprise Size 18.21.4. By Verticals 18.22. South Africa Retail Market 18.22.1. By Application Type 18.22.2. By Services 18.22.3. By Enterprise Size 18.22.4. By Verticals 19. Competition Analysis 19.1. Competition Dashboard 19.2. Pricing Analysis, by Competition 19.3. Competition Deep Dive 19.3.1. Amazon Web Services Inc. 19.3.1.1. Overview 19.3.1.2. Product/Service Portfolio 19.3.1.3. Profitability by Market Segments (Product/Channel/Region) 19.3.1.4. Sales Footprint 19.3.1.5. Strategy Overview 19.3.1.5.1. Marketing Strategy 19.3.1.5.2. Product Strategy 19.3.1.5.3. Channel Strategy 19.3.2. IBM 19.3.2.1. Overview 19.3.2.2. Product/Service Portfolio 19.3.2.3. Profitability by Market Segments (Product/Channel/Region) 19.3.2.4. Sales Footprint 19.3.2.5. Strategy Overview 19.3.2.5.1. Marketing Strategy 19.3.2.5.2. Product Strategy 19.3.2.5.3. Channel Strategy 19.3.3. Google LLC 19.3.3.1. Overview 19.3.3.2. Product/Service Portfolio 19.3.3.3. Profitability by Market Segments (Product/Channel/Region) 19.3.3.4. Sales Footprint 19.3.3.5. Strategy Overview 19.3.3.5.1. Marketing Strategy 19.3.3.5.2. Product Strategy 19.3.3.5.3. Channel Strategy 19.3.4. Microsoft Corporation 19.3.4.1. Overview 19.3.4.2. Product/Service Portfolio 19.3.4.3. Profitability by Market Segments (Product/Channel/Region) 19.3.4.4. Sales Footprint 19.3.4.5. Strategy Overview 19.3.4.5.1. Marketing Strategy 19.3.4.5.2. Product Strategy 19.3.4.5.3. Channel Strategy 19.3.5. Amazon Inc. 19.3.5.1. Overview 19.3.5.2. Product/Service Portfolio 19.3.5.3. Profitability by Market Segments (Product/Channel/Region) 19.3.5.4. Sales Footprint 19.3.5.5. Strategy Overview 19.3.5.5.1. Marketing Strategy 19.3.5.5.2. Product Strategy 19.3.5.5.3. Channel Strategy 19.3.6. Ingenico Group 19.3.6.1. Overview 19.3.6.2. Product/Service Portfolio 19.3.6.3. Profitability by Market Segments (Product/Channel/Region) 19.3.6.4. Sales Footprint 19.3.6.5. Strategy Overview 19.3.6.5.1. Marketing Strategy 19.3.6.5.2. Product Strategy 19.3.6.5.3. Channel Strategy 19.3.7. Huawei Technologies Co., Ltd. 19.3.7.1. Overview 19.3.7.2. Product/Service Portfolio 19.3.7.3. Profitability by Market Segments (Product/Channel/Region) 19.3.7.4. Sales Footprint 19.3.7.5. Strategy Overview 19.3.7.5.1. Marketing Strategy 19.3.7.5.2. Product Strategy 19.3.7.5.3. Channel Strategy 19.3.8. Cisco Systems 19.3.8.1. Overview 19.3.8.2. Product/Service Portfolio 19.3.8.3. Profitability by Market Segments (Product/Channel/Region) 19.3.8.4. Sales Footprint 19.3.8.5. Strategy Overview 19.3.8.5.1. Marketing Strategy 19.3.8.5.2. Product Strategy 19.3.8.5.3. Channel Strategy 19.3.9. Zebra Technologies Corp. 19.3.9.1. Overview 19.3.9.2. Product/Service Portfolio 19.3.9.3. Profitability by Market Segments (Product/Channel/Region) 19.3.9.4. Sales Footprint 19.3.9.5. Strategy Overview 19.3.9.5.1. Marketing Strategy 19.3.9.5.2. Product Strategy 19.3.9.5.3. Channel Strategy 19.3.10. Unitech Electronics Co., LTD. 19.3.10.1. Overview 19.3.10.2. Product/Service Portfolio 19.3.10.3. Profitability by Market Segments (Product/Channel/Region) 19.3.10.4. Sales Footprint 19.3.10.5. Strategy Overview 19.3.10.5.1. Marketing Strategy 19.3.10.5.2. Product Strategy 19.3.10.5.3. Channel Strategy 19.3.11. IEI Integration Corp. 19.3.11.1. Overview 19.3.11.2. Product/Service Portfolio 19.3.11.3. Profitability by Market Segments (Product/Channel/Region) 19.3.11.4. Sales Footprint 19.3.11.5. Strategy Overview 19.3.11.5.1. Marketing Strategy 19.3.11.5.2. Product Strategy 19.3.11.5.3. Channel Strategy 19.3.12. Samsung Electronics 19.3.12.1. Overview 19.3.12.2. Product/Service Portfolio 19.3.12.3. Profitability by Market Segments (Product/Channel/Region) 19.3.12.4. Sales Footprint 19.3.12.5. Strategy Overview 19.3.12.5.1. Marketing Strategy 19.3.12.5.2. Product Strategy 19.3.12.5.3. Channel Strategy 19.3.13. VeriFone Systems 19.3.13.1. Overview 19.3.13.2. Product/Service Portfolio 19.3.13.3. Profitability by Market Segments (Product/Channel/Region) 19.3.13.4. Sales Footprint 19.3.13.5. Strategy Overview 19.3.13.5.1. Marketing Strategy 19.3.13.5.2. Product Strategy 19.3.13.5.3. Channel Strategy 19.3.14. NCR Corporation 19.3.14.1. Overview 19.3.14.2. Product/Service Portfolio 19.3.14.3. Profitability by Market Segments (Product/Channel/Region) 19.3.14.4. Sales Footprint 19.3.14.5. Strategy Overview 19.3.14.5.1. Marketing Strategy 19.3.14.5.2. Product Strategy 19.3.14.5.3. Channel Strategy 19.3.15. Motorola Mobility LLC. 19.3.15.1. Overview 19.3.15.2. Product/Service Portfolio 19.3.15.3. Profitability by Market Segments (Product/Channel/Region) 19.3.15.4. Sales Footprint 19.3.15.5. Strategy Overview 19.3.15.5.1. Marketing Strategy 19.3.15.5.2. Product Strategy 19.3.15.5.3. Channel Strategy 19.3.16. Honeywell International Inc. 19.3.16.1. Overview 19.3.16.2. Product/Service Portfolio 19.3.16.3. Profitability by Market Segments (Product/Channel/Region) 19.3.16.4. Sales Footprint 19.3.16.5. Strategy Overview 19.3.16.5.1. Marketing Strategy 19.3.16.5.2. Product Strategy 19.3.16.5.3. Channel Strategy 20. Assumptions and Acronyms Used 21. Research Methodology
Let us know your requirement to get
100% FREE customization
List of Tables
Table 01: Global Public Cloud Application Infrastructure Services Market Size (US$ Mn) Analysis by Application Type, 2015-2030 Table 02: Global Public Cloud Application Infrastructure Services Market Value (US$ Mn) Analysis by Services, 2015-2030 Table 03: Global Public Cloud Application Infrastructure Services Market Value (US$ Mn) Analysis by Enterprise Size, 2015-2030 Table 04: Global Public Cloud Application Infrastructure Services Market Value (US$ Mn) Analysis by Verticals, 2015-2030 Table 05: Global Public Cloud Application Infrastructure Services Market Value (US$ Mn) Analysis by Region, 2015-2030 Table 06: North America Public Cloud Application Infrastructure Services Market Size (US$ Mn) Analysis by Application Type, 2015-2030 Table 07: North America Public Cloud Application Infrastructure Services Market Value (US$ Mn) Analysis by Services, 2015-2030 Table 08: North America Public Cloud Application Infrastructure Services Market Value (US$ Mn) Analysis by Enterprise Size, 2015-2030 Table 09: North America Public Cloud Application Infrastructure Services Market Value (US$ Mn) Analysis by Verticals, 2015-2030 Table 10: North America Public Cloud Application Infrastructure Services Market Value (US$ Mn) Analysis by Country, 2015-2030 Table 11: Latin America Public Cloud Application Infrastructure Services Market Size (US$ Mn) Analysis by Application Type, 2015-2030 Table 12: Latin America Public Cloud Application Infrastructure Services Market Value (US$ Mn) Analysis by Services, 2015-2030 Table 13: Latin America Public Cloud Application Infrastructure Services Market Value (US$ Mn) Analysis by Enterprise Size, 2015-2030 Table 14: Latin America Public Cloud Application Infrastructure Services Market Value (US$ Mn) Analysis by Enterprise Size, 2015-2030 Table 15: Latin America Public Cloud Application Infrastructure Services Market Value (US$ Mn) Analysis by Country, 2015-2030 Table 16: Europe Public Cloud Application Infrastructure Services Market Size (US$ Mn) Analysis by Application Type, 2015-2030 Table 17: Europe Public Cloud Application Infrastructure Services Market Value (US$ Mn) Analysis by Services, 2015-2030 Table 18: Europe Public Cloud Application Infrastructure Services Market Value (US$ Mn) Analysis by Enterprise Size, 2015-2030 Table 19: Europe Public Cloud Application Infrastructure Services Market Value (US$ Mn) Analysis by Verticals, 2015-2030 Table 20: Europe Public Cloud Application Infrastructure Services Market Value (US$ Mn) Analysis by Country, 2015-2030 Table 21: East Asia Public Cloud Application Infrastructure Services Market Size (US$ Mn) Analysis by Application Type, 2015-2030 Table 22: East Asia Public Cloud Application Infrastructure Services Market Value (US$ Mn) Analysis by Services, 2015-2030 Table 23: East Asia Public Cloud Application Infrastructure Services Market Value (US$ Mn) Analysis by Enterprise Size, 2015-2030 Table 24: East Asia Public Cloud Application Infrastructure Services Market Value (US$ Mn) Analysis by Verticals, 2015-2030 Table 25: East Asia Public Cloud Application Infrastructure Services Market Value (US$ Mn) Analysis by Country, 2015-2030 Table 26: South Asia & Pacific Public Cloud Application Infrastructure Services Market Size (US$ Mn) Analysis by Application Type, 2015-2030 Table 27: South Asia & Pacific Public Cloud Application Infrastructure Services Market Value (US$ Mn) Analysis by Services, 2015-2030 Table 28: South Asia & Pacific Public Cloud Application Infrastructure Services Market Value (US$ Mn) Analysis by Enterprise Size, 2015-2030 Table 29: South Asia & Pacific Public Cloud Application Infrastructure Services Market Value (US$ Mn) Analysis by Verticals, 2015-2030 Table 30: South Asia & Pacific Public Cloud Application Infrastructure Services Market Value (US$ Mn) Analysis by Country, 2015-2030 Table 31: Middle East & Africa Public Cloud Application Infrastructure Services Market Size (US$ Mn) Analysis by Application Type, 2015-2030 Table 32: Middle East & Africa Public Cloud Application Infrastructure Services Market Value (US$ Mn) Analysis by Services, 2015-2030 Table 33: Middle East & Africa Public Cloud Application Infrastructure Services Market Value (US$ Mn) Analysis by Enterprise Size, 2015-2030 Table 34: Middle East & Africa Public Cloud Application Infrastructure Services Market Value (US$ Mn) Analysis by Verticals, 2015-2030 Table 35: Middle East & Africa Public Cloud Application Infrastructure Services Market Value (US$ Mn) Analysis by Country, 2015-2030
Find your sweet spots for generating winning opportunities in this market.
Talk to AnalystList of Charts
Figure 01: Global Public Cloud Application Infrastructure Services Market Size and Y-o-Y Growth Rate from 2020-2030 Figure 02: Global Public Cloud Application Infrastructure Services Market Absolute $ Opportunity (US$ Mn), 2019 - 2030 Figure 03: Global Public Cloud Application Infrastructure Services Market Value (US$ Mn), 2015-2019 Figure 04: Global Public Cloud Application Infrastructure Services Market Value (US$ Mn) Forecast, 2020-2030 Figure 05: Global Public Cloud Application Infrastructure Services Market Share and BPS Analysis by Application Type- 2020 & 2030 Figure 06: Global Public Cloud Application Infrastructure Services Market Y-o-Y Growth by Application Type, 2020-2030 Figure 07: Global Public Cloud Application Infrastructure Services Market: Market Attractiveness by Application Type Figure 08: Global Public Cloud Application Infrastructure Services Market Share and BPS Analysis by Services- 2020 & 2030 Figure 09: Global Public Cloud Application Infrastructure Services Market Y-o-Y Growth by Services, 2020-2030 Figure 10: Global Public Cloud Application Infrastructure Services Market: Market Attractiveness by Services Figure 11: Global Public Cloud Application Infrastructure Services Market Share and BPS Analysis by Enterprise Size- 2020 & 2030 Figure 12: Global Public Cloud Application Infrastructure Services Market Y-o-Y Growth by Enterprise Size, 2020-2030 Figure 13: Global Public Cloud Application Infrastructure Services Market: Market Attractiveness by Enterprise Size Figure 14: Global Public Cloud Application Infrastructure Services Market Share and BPS Analysis by Verticals- 2020 & 2030 Figure 15: Global Public Cloud Application Infrastructure Services Market Y-o-Y Growth by Verticals, 2020-2030 Figure 16: Global Public Cloud Application Infrastructure Services Market: Market Attractiveness by Verticals Figure 17: Global Public Cloud Application Infrastructure Services Market Share and BPS Analysis by Region- 2020 & 2030 Figure 18: Global Public Cloud Application Infrastructure Services Market Y-o-Y Growth by Region, 2020-2030 Figure 19: Global Public Cloud Application Infrastructure Services Market: Market Attractiveness by Region Figure 20: North America Public Cloud Application Infrastructure Services Market Absolute $ Opportunity Figure 21: Latin America Public Cloud Application Infrastructure Services Market Absolute $ Opportunity Figure 22: Europe Public Cloud Application Infrastructure Services Market Absolute $ Opportunity Figure 23: East Asia Public Cloud Application Infrastructure Services Market Absolute $ Opportunity Figure 24: South Asia & Pacific Public Cloud Application Infrastructure Services Market Absolute $ Opportunity Figure 25: Middle East & Africa Public Cloud Application Infrastructure Services Market Absolute $ Opportunity Figure 26: North America Public Cloud Application Infrastructure Services Market Value (US$ Mn), 2015-2019 Figure 27: North America Public Cloud Application Infrastructure Services Market Value (US$ Mn) Forecast, 2020-2030 Figure 28: North America Public Cloud Application Infrastructure Services Market Share and BPS Analysis by Application Type- 2020 & 2030 Figure 29: North America Public Cloud Application Infrastructure Services Market Y-o-Y Growth by Application Type, 2020-2030 Figure 30: North America Public Cloud Application Infrastructure Services Market: Market Attractiveness by Application Type Figure 31: North America Public Cloud Application Infrastructure Services Market Share and BPS Analysis by Services- 2020 & 2030 Figure 32: North America Public Cloud Application Infrastructure Services Market Y-o-Y Growth by Services, 2020-2030 Figure 33: North America Public Cloud Application Infrastructure Services Market: Market Attractiveness by Services Figure 34: North America Public Cloud Application Infrastructure Services Market Share and BPS Analysis by Enterprise Size- 2020 & 2030 Figure 35: North America Public Cloud Application Infrastructure Services Market Y-o-Y Growth by Enterprise Size, 2020-2030 Figure 36: North America Public Cloud Application Infrastructure Services Market: Market Attractiveness by Enterprise Size Figure 37: North America Public Cloud Application Infrastructure Services Market Share and BPS Analysis by Verticals- 2020 & 2030 Figure 38: North America Public Cloud Application Infrastructure Services Market Y-o-Y Growth by Verticals, 2020-2030 Figure 39: North America Public Cloud Application Infrastructure Services Market: Market Attractiveness by Verticals Figure 40: North America Public Cloud Application Infrastructure Services Market Share and BPS Analysis by Country- 2020 & 2030 Figure 41: North America Public Cloud Application Infrastructure Services Market Y-o-Y Growth by Country, 2020-2030 Figure 42: North America Public Cloud Application Infrastructure Services Market: Market Attractiveness by Country Figure 43: U.S. Public Cloud Application Infrastructure Services Market Absolute $ Opportunity Figure 44: Canada Public Cloud Application Infrastructure Services Market Absolute $ Opportunity Figure 45: Latin America Public Cloud Application Infrastructure Services Market Value (US$ Mn), 2015-2019 Figure 46: Latin America Public Cloud Application Infrastructure Services Market Value (US$ Mn) Forecast, 2020-2030 Figure 47: Latin America Public Cloud Application Infrastructure Services Market Share and BPS Analysis by Application Type- 2020 & 2030 Figure 48: Latin America Public Cloud Application Infrastructure Services Market Y-o-Y Growth by Application Type, 2020-2030 Figure 49: Latin America Public Cloud Application Infrastructure Services Market: Market Attractiveness by Application Type Figure 50: Latin America Public Cloud Application Infrastructure Services Market Share and BPS Analysis by Services- 2020 & 2030 Figure 51: Latin America Public Cloud Application Infrastructure Services Market Y-o-Y Growth by Services, 2020-2030 Figure 52: Latin America Public Cloud Application Infrastructure Services Market: Market Attractiveness by Services Figure 53: Latin America Public Cloud Application Infrastructure Services Market Share and BPS Analysis by Enterprise Size- 2020 & 2030 Figure 54: Latin America Public Cloud Application Infrastructure Services Market Y-o-Y Growth by Enterprise Size, 2020-2030 Figure 55: Latin America Public Cloud Application Infrastructure Services Market: Market Attractiveness by Enterprise Size Figure 56: Latin America Public Cloud Application Infrastructure Services Market Share and BPS Analysis by Verticals- 2020 & 2030 Figure 57: Latin America Public Cloud Application Infrastructure Services Market Y-o-Y Growth by Verticals, 2020-2030 Figure 58: Latin America Public Cloud Application Infrastructure Services Market: Market Attractiveness by Verticals Figure 59: Latin America Public Cloud Application Infrastructure Services Market Share and BPS Analysis by Country- 2020 & 2030 Figure 60: Latin America Public Cloud Application Infrastructure Services Market Y-o-Y Growth by Country, 2020-2030 Figure 61: Latin America Public Cloud Application Infrastructure Services Market: Market Attractiveness by Country Figure 62: Brazil Public Cloud Application Infrastructure Services Market Absolute $ Opportunity Figure 63: Mexico Public Cloud Application Infrastructure Services Market Absolute $ Opportunity Figure 64: Rest of Latin America Europe Public Cloud Application Infrastructure Services Market Absolute $ Opportunity Figure 65: Europe Public Cloud Application Infrastructure Services Market Value (US$ Mn), 2015-2019 Figure 66: Europe Public Cloud Application Infrastructure Services Market Value (US$ Mn) Forecast, 2020-2030 Figure 67: Europe Public Cloud Application Infrastructure Services Market Share and BPS Analysis by Application Type- 2020 & 2030 Figure 68: Europe Public Cloud Application Infrastructure Services Market Y-o-Y Growth by Application Type, 2020-2030 Figure 69: Europe Public Cloud Application Infrastructure Services Market: Market Attractiveness by Application Type Figure 70: Europe Public Cloud Application Infrastructure Services Market Share and BPS Analysis by Services- 2020 & 2030 Figure 71: Europe Public Cloud Application Infrastructure Services Market Y-o-Y Growth by Services, 2020-2030 Figure 72: Europe Public Cloud Application Infrastructure Services Market: Market Attractiveness by Services Figure 73: Europe Public Cloud Application Infrastructure Services Market Share and BPS Analysis by Enterprise Size- 2020 & 2030 Figure 74: Europe Public Cloud Application Infrastructure Services Market Y-o-Y Growth by Enterprise Size, 2020-2030 Figure 75: Europe Public Cloud Application Infrastructure Services Market: Market Attractiveness by Enterprise Size Figure 76: Europe Public Cloud Application Infrastructure Services Market Share and BPS Analysis by Verticals- 2020 & 2030 Figure 77: Europe Public Cloud Application Infrastructure Services Market Y-o-Y Growth by Verticals, 2020-2030 Figure 78: Europe Public Cloud Application Infrastructure Services Market: Market Attractiveness by Verticals Figure 79: Europe Public Cloud Application Infrastructure Services Market Share and BPS Analysis by Country- 2020 & 2030 Figure 80: Europe Public Cloud Application Infrastructure Services Market Y-o-Y Growth by Country, 2020-2030 Figure 81: Europe Public Cloud Application Infrastructure Services Market: Market Attractiveness by Country Figure 82: Germany Public Cloud Application Infrastructure Services Market Absolute $ Opportunity Figure 83: Italy Public Cloud Application Infrastructure Services Market Absolute $ Opportunity Figure 84: France Public Cloud Application Infrastructure Services Market Absolute $ Opportunity Figure 85: U.K. Public Cloud Application Infrastructure Services Market Absolute $ Opportunity Figure 86: Spain Public Cloud Application Infrastructure Services Market Absolute $ Opportunity Figure 87: BENELUX Public Cloud Application Infrastructure Services Market Absolute $ Opportunity Figure 88: Russia Public Cloud Application Infrastructure Services Market Absolute $ Opportunity Figure 89: East Asia Public Cloud Application Infrastructure Services Market Value (US$ Mn), 2015-2019 Figure 90: East Asia Public Cloud Application Infrastructure Services Market Value (US$ Mn) Forecast, 2020-2030 Figure 91: East Asia Public Cloud Application Infrastructure Services Market Share and BPS Analysis by Application Type- 2020 & 2030 Figure 92: East Asia Public Cloud Application Infrastructure Services Market Y-o-Y Growth by Application Type, 2020-2030 Figure 93: East Asia Public Cloud Application Infrastructure Services Market: Market Attractiveness by Application Type Figure 94: East Asia Public Cloud Application Infrastructure Services Market Share and BPS Analysis by Services- 2020 & 2030 Figure 95: East Asia Public Cloud Application Infrastructure Services Market Y-o-Y Growth by Services, 2020-2030 Figure 96: East Asia Public Cloud Application Infrastructure Services Market: Market Attractiveness by Services Figure 97: East Asia Public Cloud Application Infrastructure Services Market Share and BPS Analysis by Enterprise Size- 2020 & 2030 Figure 98: East Asia Public Cloud Application Infrastructure Services Market Y-o-Y Growth by Enterprise Size, 2020-2030 Figure 99: East Asia Public Cloud Application Infrastructure Services Market: Market Attractiveness by Enterprise Size Figure 100: East Asia Public Cloud Application Infrastructure Services Market Share and BPS Analysis by Verticals- 2020 & 2030 Figure 101: East Asia Public Cloud Application Infrastructure Services Market Y-o-Y Growth by Verticals, 2020-2030 Figure 102: East Asia Public Cloud Application Infrastructure Services Market: Market Attractiveness by Verticals Figure 103: East Asia Public Cloud Application Infrastructure Services Market Share and BPS Analysis by Country- 2020 & 2030 Figure 104: East Asia Public Cloud Application Infrastructure Services Market Y-o-Y Growth by Country, 2020-2030 Figure 105: East Asia Public Cloud Application Infrastructure Services Market: Market Attractiveness by Country Figure 106: China Public Cloud Application Infrastructure Services Market Absolute $ Opportunity Figure 107: Japan Public Cloud Application Infrastructure Services Market Absolute $ Opportunity Figure 108: South Korea Public Cloud Application Infrastructure Services Market Absolute $ Opportunity Figure 109: South Asia & Pacific Public Cloud Application Infrastructure Services Market Value (US$ Mn), 2015-2019 Figure 110: South Asia & Pacific Public Cloud Application Infrastructure Services Market Value (US$ Mn) Forecast, 2020-2030 Figure 111: South Asia & Pacific Public Cloud Application Infrastructure Services Market Share and BPS Analysis by Application Type- 2020 & 2030 Figure 112: South Asia & Pacific Public Cloud Application Infrastructure Services Market Y-o-Y Growth by Application Type, 2020-2030 Figure 113: South Asia & Pacific Public Cloud Application Infrastructure Services Market: Market Attractiveness by Application Type Figure 114: South Asia & Pacific Public Cloud Application Infrastructure Services Market Share and BPS Analysis by Services- 2020 & 2030 Figure 115: South Asia & Pacific Public Cloud Application Infrastructure Services Market Y-o-Y Growth by Services, 2020-2030 Figure 116: South Asia & Pacific Public Cloud Application Infrastructure Services Market: Market Attractiveness by Services Figure 117: South Asia & Pacific Public Cloud Application Infrastructure Services Market Share and BPS Analysis by Enterprise Size- 2020 & 2030 Figure 118: South Asia & Pacific Public Cloud Application Infrastructure Services Market Y-o-Y Growth by Enterprise Size, 2020-2030 Figure 119 South Asia & Pacific Public Cloud Application Infrastructure Services Market: Market Attractiveness by Enterprise Size Figure 120: South Asia & Pacific Public Cloud Application Infrastructure Services Market Share and BPS Analysis by Verticals- 2020 & 2030 Figure 121: South Asia & Pacific Public Cloud Application Infrastructure Services Market Y-o-Y Growth by Verticals, 2020-2030 Figure 122 South Asia & Pacific Public Cloud Application Infrastructure Services Market: Market Attractiveness by Verticals Figure 123: South Asia & Pacific Public Cloud Application Infrastructure Services Market Share and BPS Analysis by Country- 2020 & 2030 Figure 124: South Asia & Pacific Public Cloud Application Infrastructure Services Market Y-o-Y Growth by Country, 2020-2030 Figure 125: South Asia & Pacific Public Cloud Application Infrastructure Services Market: Market Attractiveness by Country Figure 126: India Public Cloud Application Infrastructure Services Market Absolute $ Opportunity Figure 127: ASEAN Public Cloud Application Infrastructure Services Market Absolute $ Opportunity Figure 128: Australia & New Zealand Public Cloud Application Infrastructure Services Market Absolute $ Opportunity Figure 129: Middle East & Africa Public Cloud Application Infrastructure Services Market Value (US$ Mn), 2015-2019 Figure 130: Middle East & Africa Public Cloud Application Infrastructure Services Market Value (US$ Mn) Forecast, 2020-2030 Figure 131: Middle East & Africa Public Cloud Application Infrastructure Services Market Share and BPS Analysis by Application Type- 2020 & 2030 Figure 132: Middle East & Africa Public Cloud Application Infrastructure Services Market Y-o-Y Growth by Application Type, 2020-2030 Figure 133: Middle East & Africa Public Cloud Application Infrastructure Services Market: Market Attractiveness by Application Type Figure 134: Middle East & Africa Public Cloud Application Infrastructure Services Market Share and BPS Analysis by Services- 2020 & 2030 Figure 135: Middle East & Africa Public Cloud Application Infrastructure Services Market Y-o-Y Growth by Services, 2020-2030 Figure 136: Middle East & Africa Public Cloud Application Infrastructure Services Market: Market Attractiveness by Services Figure 137: Middle East & Africa Public Cloud Application Infrastructure Services Market Share and BPS Analysis by Enterprise Size- 2020 & 2030 Figure 138: Middle East & Africa Public Cloud Application Infrastructure Services Market Y-o-Y Growth by Enterprise Size, 2020-2030 Figure 139: Middle East & Africa Public Cloud Application Infrastructure Services Market: Market Attractiveness by Enterprise Size Figure 140: Middle East & Africa Public Cloud Application Infrastructure Services Market Share and BPS Analysis by Verticals- 2020 & 2030 Figure 141: Middle East & Africa Public Cloud Application Infrastructure Services Market Y-o-Y Growth by Verticals, 2020-2030 Figure 142: Middle East & Africa Public Cloud Application Infrastructure Services Market: Market Attractiveness by Verticals Figure 143: Middle East & Africa Public Cloud Application Infrastructure Services Market Share and BPS Analysis by Country- 2020 & 2030 Figure 144: Middle East & Africa Public Cloud Application Infrastructure Services Market Y-o-Y Growth by Country, 2020-2030 Figure 145: Middle East & Africa Public Cloud Application Infrastructure Services Market: Market Attractiveness by Country Figure 146: GCC Countries Public Cloud Application Infrastructure Services Market Absolute $ Opportunity Figure 147: Turkey Public Cloud Application Infrastructure Services Market Absolute $ Opportunity Figure 148: South Africa Public Cloud Application Infrastructure Services Market Absolute $ Opportunity
Need specific information?
Request CustomizationExplore Technology Insights
View Reports