Public Announcement System Market Size and Share Forecast Outlook (2024 to 2034)

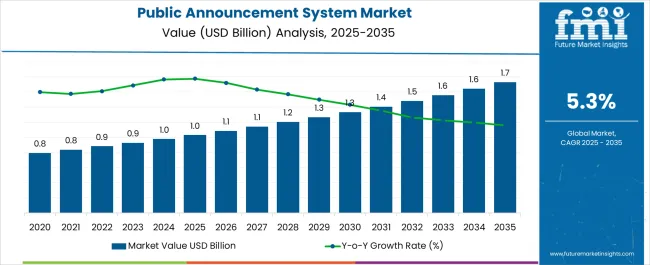
The public announcement system market is projected to be worth USD 976 million in 2024. The market is likely to reach USD 1,715.10 million by 2034. The Market is expected to surge at a CAGR of 5.60% from 2024 to 2034.

A significant driver is the rising significance of eco friendly and sustainable public announcement system solutions. Companies are gravitating towards systems designed with energy efficient components and materials, aligning with global sustainability agendas.

The market is surging due to urbanization and infrastructural developments across emerging economies. The demand for public announcement system in transportation hubs, educational institutions, and healthcare facilities is escalating, driven by expanding infrastructures worldwide.

The demand for customizable, user friendly systems tailored to specific needs is gaining traction. Customers seek a public announcement system that seamlessly integrates with existing setups without extensive modifications, streamlining installation and enhancing user experience.

Attributes Key Insights
Public Announcement System Market Estimated Size in 2024 USD 976 million
Projected Market Value in 2034 USD 1,715.10 million
Value-based CAGR from 2024 to 2034 5.60%

Key Market Trends and Developments in the Public Announcement System Industry

  • Strengthening security protocols to safeguard sustainable public announcement system from potential cyber threats, ensuring data integrity and uninterrupted communication in sensitive environments.
  • Heightened interest in sustainable public announcement system solutions within educational settings, fostering effective communication for emergencies, daily announcements, and educational activities, enhancing safety and information dissemination.
  • Voice command integration enables intuitive, hands free control of public announcement system, promoting user convenience and accessibility in various environments and applications.
  • Broadening public announcement system applications in large scale venues, optimizing sound dispersion, enabling clear communication, and enhancing audience experiences during events and gatherings.

Comparison of Historical Performance (2019 to 2023) vs Forecast Projections (2024 to 2034)

Historical Value in 2019 USD 737 million
Historical Value in 2023 USD 923.5 million
Market Estimated Size in 2024 USD 976 million
Projected Market Value in 2034 USD 1,715.10 million

Between 2019 and 2023, the public announcement system market experienced a significant evolutionary phase marked by technological advancements and shifting demands. This period saw a surge in smart technology integration, with IoT and AI revolutionizing public announcement system capabilities, enhancing communication, and amplifying functionality.

Safety and security concerns, propelled by global events, drove a heightened emphasis on remote working solutions and safety measures, influencing public announcement system adoption in various sectors. Infrastructure expansions and urbanization further fueled market growth, especially in transportation hubs and emerging economies, while customizable, user centric public announcement system solutions gained traction.

Looking ahead from 2024 to 2034, market forecasts project a continued trajectory of innovation and expansion. While smart technology integration remains crucial, the focus extends beyond to include sustainability as a driving force.

Public announcement system solutions are anticipated to prioritize eco friendly designs and energy efficient components, aligning with global sustainability initiatives. Enhanced user experiences through interactive features and customizable, adaptable systems will define market trends.

Collaboration between public announcement system providers and IoT device manufacturers is expected to deepen, fostering seamless integration and unlocking new functionalities. The market anticipates an exponential surge in educational institution deployments, propelled by safety concerns and communication needs.

These forecasts indicate a transformative decade for the public announcement system, where sustainability, adaptability, and user centric design will shape its evolution.

Key Drivers Fueling the Public Announcement System Market

  • Public announcement system incorporating interactive elements, enabling audience participation through features like surveys, feedback loops, or interactive content, enhancing engagement and communication effectiveness.
  • Advancements enable the public announcement system to direct sound precisely, delivering messages or alerts to specific locations or individuals, optimizing communication clarity, and reducing ambient noise interference.
  • Designing public announcement system with durable, robust features to withstand harsh conditions or extreme climates, ensuring consistent functionality in demanding settings such as outdoor or industrial environments.
  • Increasing deployment of public announcement system in healthcare settings, facilitating immediate and clear communication during emergencies or critical situations, enhancing staff coordination and patient safety.
  • Utilizing public announcement system in retail environments to communicate promotions, provide information, or enhance the shopping experience, fostering customer engagement and satisfaction through targeted messaging and announcements.

Challenges Hindering the Adoption of Public Announcement Systems

  • Integrating new public announcement system technologies with existing infrastructure poses challenges, requiring seamless connectivity and adaptability without disrupting current systems.
  • Ensuring robust cybersecurity measures to safeguard public announcement system networks from potential breaches and cyberattacks amid advancing technological landscapes.
  • Adhering to diverse regional regulations and standards while deploying public announcement system solutions, ensuring legal compliance and meeting market specific requirements.
  • Addressing acoustic challenges in varied environments, optimizing sound quality and coverage to counter ambient noise or architectural complexities for effective communication.
  • Educating users and stakeholders on public announcement system functionalities and procedures, ensuring smooth adoption, and maximizing its potential for efficient operation and emergency response.

Analysis of Top Countries Installing and Regulating Public Announcement Systems

In the dynamic landscape of the public announcement system market, India leads with a remarkable 6.30% growth rate, driven by rapid urbanization and technological advancements. Following closely, China and Australia exhibit robust growth at 6.10% and 5.30%, respectively, propelled by infrastructural developments and increasing safety concerns.

The United States and Germany maintain strong positions, forecasting 5.20% and 5.00% growth rates, respectively, attributed to technological innovation and stringent quality standards. These global leaders reflect diverse market dynamics, showcasing sustained expansion and a commitment to fostering cutting edge public announcement system solutions, influencing market advancements on a global scale.

Forecast CAGRs from 2024 to 2034

India 6.30%
China 6.10%
Australia 5.30%
The United States 5.20%
Germany 5.00%

India Leading the Public Announcement System Market

India emerges as a frontrunner in the public announcement system market, projected to drive a remarkable 6.30% CAGR until 2034. Its rapid urbanization, infrastructural developments, and government initiatives propel the demand for advanced public announcement system solutions.

Increased public announcement system deployments across diverse sectors, including transportation, education, and healthcare, accentuate its pivotal position in the market. Leveraging technological advancements and a burgeoning economy, India sets the pace for public announcement system innovation and adoption, solidifying its leadership role and contributing significantly to the global public announcement system market landscape.

China Pioneering Trends in the Public Announcement System Market

China leads the charge in the public announcement system market, poised for a remarkable 6.10% projected CAGR until 2034. This surge in public announcement system adoption stems from infrastructural expansions, rapid urbanization, and a burgeoning need for effective communication systems in diverse sectors.

Innovations in smart technology integration, coupled with stringent safety standards and government initiatives, fuel its dominance. Leveraging advanced manufacturing capabilities and a vast consumer base, China sets the pace for public announcement system advancements, emphasizing scalability, reliability, and cutting edge solutions, propelling the country as a frontrunner in shaping the future of public announcement system technologies and applications.

Pioneering Role of Australia in Public Announcement System Market Growth

Australia emerges as a trailblazer in the public announcement system market, spearheading with a projected 5.30% CAGR until 2034. The country showcases immense opportunities driven by infrastructure development, urban expansion, and a strong emphasis on safety protocols.

Innovations in public announcement system technologies and increasing investments in transport hubs, educational institutions, and public spaces present a fertile ground for market expansion.

Australia has a proactive approach towards implementing advanced public announcement system solutions, ensuring efficient communication and safety across diverse sectors, positions it at the forefront of public announcement system market growth, offering promising prospects for the market evolution.
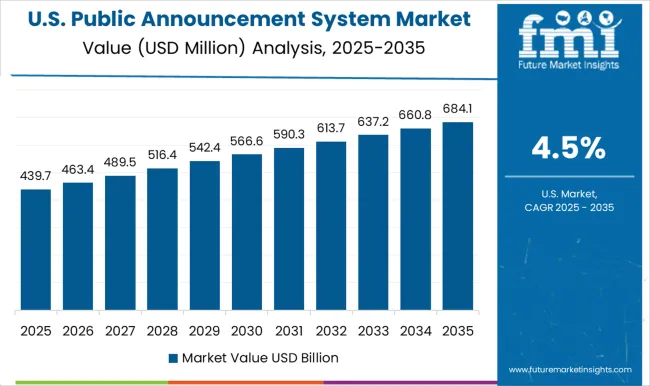
United States Pioneering Opportunities in the Public Announcement System Market

The United States emerges as a vanguard, propelling the public announcement system market with a projected 5.20% CAGR until 2034. Bolstered by infrastructural developments and a burgeoning demand for smart communication systems, this landscape offers substantial growth prospects.

The surge in smart city initiatives, coupled with stringent safety regulations, fuels the adoption of advanced public announcement system solutions across various sectors. Opportunities abound for public announcement system providers to innovate and cater to evolving needs in transportation, healthcare, and entertainment domains.

With its technological prowess and demand dynamics, the United States stands as a prime arena for public announcement system expansion, paving the way for transformative opportunities in the market.
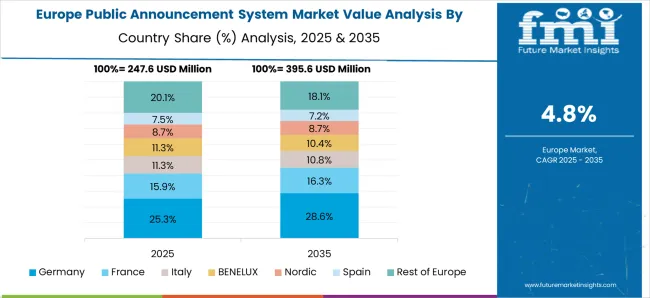
Germany Leading Role in Driving the Public Announcement System Market

Germany emerges as a frontrunner propelling the public announcement system market, projecting an impressive 5.00% CAGR until 2034. This momentum is fueled by its commitment to technological innovation, stringent safety standards, and a burgeoning need for efficient communication infrastructure.

Leveraging advanced manufacturing techniques, Germany pioneers eco-friendly and high performance public announcement system solutions, influencing market trends across Europe. Its proactive approach in adopting smart technologies, coupled with a robust emphasis on quality and compliance, solidifies its pivotal role in shaping the future trajectory of the public announcement system market, fostering innovation and sustainable growth.

Public Announcement System Industry Analysis by Top Investment Segments

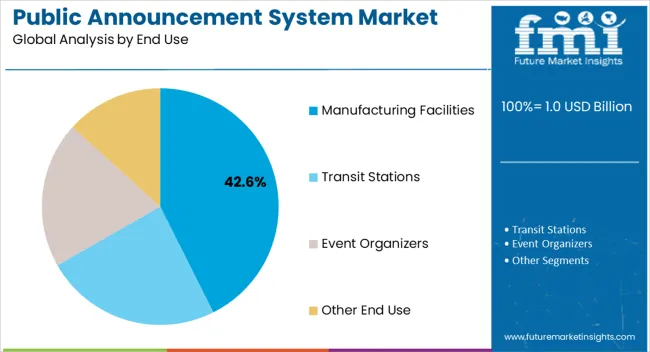
The transit stations segment is poised to uphold a sturdy 25.00% market share until 2023. With surging urbanization and increasing commuter footfall, this category remains pivotal in implementing public announcement system for efficient communication, ensuring passenger safety, and disseminating real time updates.

FMI forecasts an exponential rise for the outdoor segment, expected to attain a dominant 29.00% market share by 2023. Driven by the growing demand for robust public announcement system in open spaces like parks, stadiums, and urban areas, this category highlights the necessity for weather resistant, high performance systems to cater to diverse outdoor communication needs.

Category Market Share in 2024
Transit Stations 25.00%
Outdoor 29.00%

Transit Stations Sustaining Dominance in the Public Announcement System Market

The transit stations segment is poised to maintain its substantial 25.00% market share in the public announcement system market until 2023 due to escalating demand for efficient communication infrastructure. With expanding urbanization and increasing commuter traffic, transit hubs prioritize public announcement system for seamless information dissemination and safety protocols.

Its sustained dominance is attributed to continual infrastructure upgrades, addressing passenger needs for real time updates, emergency notifications, and streamlined public announcements. The pivotal role of public announcement system in ensuring passenger safety, navigation, and operational efficiency solidifies the transit stations category as a key driver in the public announcement system market.

Outdoor Environments Upholding Dominance in the Public Announcement System Market

The outdoor category is projected to maintain a commanding 29.00% market share in the public announcement system market until 2023, driven by increasing demand for communication solutions in open spaces. Outdoor settings necessitate robust public announcement system for effective messaging, emergency alerts, and public safety announcements.

As cities expand and outdoor events thrive, the requirement for weather resistant, high decibel systems persists. Public announcement system installations in parks, stadiums, and urban areas continue to surge, reinforcing its dominance. The versatility and adaptability of public announcement system in outdoor environments reaffirm its pivotal role in enhancing communication accessibility and safety, contributing significantly to the public announcement system market landscape.
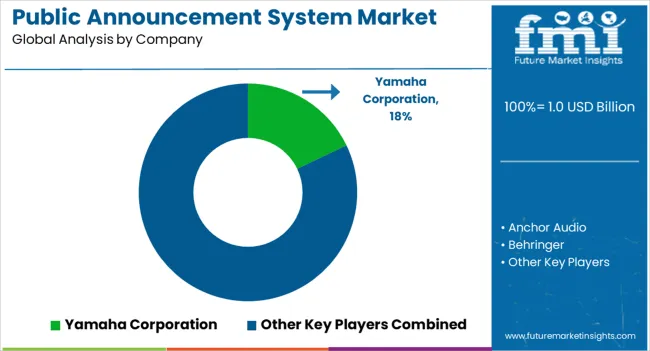
Competitive Landscape of the Public Announcement System Market

The competitive landscape within the public announcement system market is a dynamic arena characterized by a blend of established players and emerging innovators. Prominent market contenders continually innovate, offering comprehensive public announcement system solutions integrated with innovative technologies and tailored functionalities. These include established names renowned for their extensive product portfolios and market presence.

Smaller, agile companies contribute by focusing on niche segments or disruptive technologies, challenging established norms. Partnerships between public announcement system providers and tech giants amplify the competitive edge, fostering novel integrations and expanding market reach. The public announcement system market thrives on this vibrant competition, pushing boundaries and evolving to meet the ever changing needs of diverse industries and consumers.

Product Portfolio

  • Pyle Audio offers a diverse product portfolio featuring audio equipment, including speakers, amplifiers, headphones, and sound systems. Renowned for quality and innovation, they cater to varying consumer needs with cutting edge technologies and user friendly designs.
  • QFX, Inc. specializes in consumer electronics, providing audio solutions such as portable Bluetooth speakers, headphones, party speakers, and home entertainment systems. Their products combine affordability with functionality, catering to diverse lifestyles and preferences.
  • Rockville presents an extensive array of audio and musical equipment, including professional grade speakers, amplifiers, mixers, and DJ equipment. Known for durability and performance, their products cater to musicians, DJs, and audio enthusiasts seeking high quality sound solutions for various applications.

Scope and Coverage of the Public Announcement System Market Report

Attribute Details
Estimated Market Size in 2024 USD 976 million
Projected Market Valuation in 2034 USD 1,715.10 million
Value-based CAGR 2024 to 2034 5.60%
Forecast Period 2024 to 2034
Historical Data Available for 2019 to 2023
Market Analysis Value in USD million
Key Regions Covered North America; Latin America; Western Europe; Eastern Europe; South Asia and Pacific; East Asia; The Middle East & Africa
Key Market Segments Covered Type, Frequency, End Use, Region
Key Countries Profiled The United States, Canada, Brazil, Mexico, Germany, The United Kingdom, France, Spain, Italy, Russia, Poland, Czech Republic, Romania, India, Bangladesh, Australia, New Zealand, China, Japan, South Korea, GCC countries, South Africa, Israel
Key Companies Profiled Anchor Audio; Behringer; Bose Corporation; FISHMAN TRANSDUCERS INC.; Peavey Electronics; PowerWerks; Pyle Audio; QFX, Inc; Rockville; Yamaha Corporation

Top Segments Studied in the Public Announcement System Market Report

By Type:

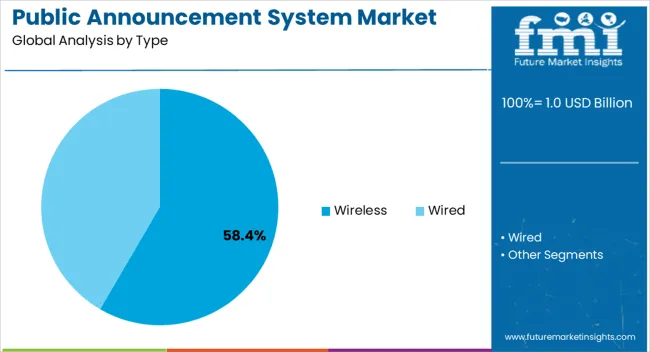
  • Wired
  • Wireless

By Frequency:

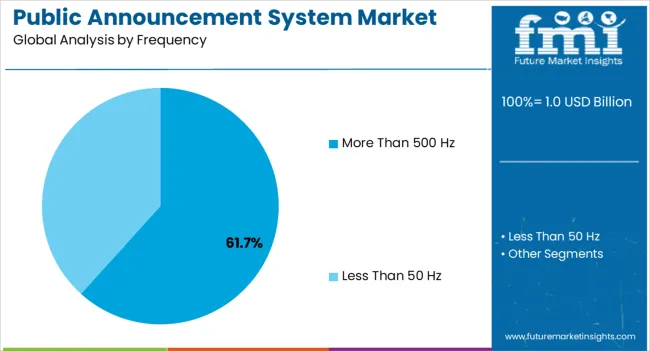
  • Less than 50 Hz
  • More than 500 Hz

By End Use:

  • Manufacturing Facilities
  • Transit Stations
  • Event Organizers
  • Other End Use

By Region:

  • North America
  • Latin America
  • Western Europe
  • Eastern Europe
  • South Asia & Pacific
  • East Asia
  • The Middle East & Africa

Table of Content

  • 1. Executive Summary
  • 2. Market Overview
  • 3. Market Background
  • 4. Global Market Analysis 2019 to 2023 and Forecast, 2024 to 2034
  • 5. Global Market Analysis 2019 to 2023 and Forecast 2024 to 2034, By Type
    • 5.1. Wired
    • 5.2. Wireless
  • 6. Global Market Analysis 2019 to 2023 and Forecast 2024 to 2034, By Frequency
    • 6.1. Less than 50 Hz
    • 6.2. More than 500 Hz
  • 7. Global Market Analysis 2019 to 2023 and Forecast 2024 to 2034, By End Use
    • 7.1. Manufacturing Facilities
    • 7.2. Transit Stations
    • 7.3. Event Organizers
    • 7.4. Other End Use
  • 8. Global Market Analysis 2019 to 2023 and Forecast 2024 to 2034, By Region
    • 8.1. North America
    • 8.2. Latin America
    • 8.3. Western Europe
    • 8.4. Eastern Europe
    • 8.5. South Asia and Pacific
    • 8.6. East Asia
    • 8.7. Middle East and Africa
  • 9. North America Market Analysis 2019 to 2023 and Forecast 2024 to 2034, By Country
  • 10. Latin America Market Analysis 2019 to 2023 and Forecast 2024 to 2034, By Country
  • 11. Western Europe Market Analysis 2019 to 2023 and Forecast 2024 to 2034, By Country
  • 12. Eastern Europe Market Analysis 2019 to 2023 and Forecast 2024 to 2034, By Country
  • 13. South Asia and Pacific Market Analysis 2019 to 2023 and Forecast 2024 to 2034, By Country
  • 14. East Asia Market Analysis 2019 to 2023 and Forecast 2024 to 2034, By Country
  • 15. Middle East and Africa Market Analysis 2019 to 2023 and Forecast 2024 to 2034, By Country
  • 16. Key Countries Market Analysis
  • 17. Market Structure Analysis
  • 18. Competition Analysis
    • 18.1. Anchor Audio
    • 18.2. Behringer
    • 18.3. Bose Corporation
    • 18.4. FISHMAN TRANSDUCERS INC.
    • 18.5. Peavey Electronics
    • 18.6. PowerWerks
    • 18.7. Pyle Audio
    • 18.8. QFX, Inc
    • 18.9. Rockville
    • 18.10. Yamaha Corporation
  • 19. Assumptions & Acronyms Used
  • 20. Research Methodology

List of Tables

Table 1: Global Market Value (US$ Million) Forecast by Region, 2019 to 2034

Table 2: Global Market Volume (Units) Forecast by Region, 2019 to 2034

Table 3: Global Market Value (US$ Million) Forecast by Type, 2019 to 2034

Table 4: Global Market Volume (Units) Forecast by Type, 2019 to 2034

Table 5: Global Market Value (US$ Million) Forecast by Frequency, 2019 to 2034

Table 6: Global Market Volume (Units) Forecast by Frequency, 2019 to 2034

Table 7: Global Market Value (US$ Million) Forecast by End Use, 2019 to 2034

Table 8: Global Market Volume (Units) Forecast by End Use, 2019 to 2034

Table 9: North America Market Value (US$ Million) Forecast by Country, 2019 to 2034

Table 10: North America Market Volume (Units) Forecast by Country, 2019 to 2034

Table 11: North America Market Value (US$ Million) Forecast by Type, 2019 to 2034

Table 12: North America Market Volume (Units) Forecast by Type, 2019 to 2034

Table 13: North America Market Value (US$ Million) Forecast by Frequency, 2019 to 2034

Table 14: North America Market Volume (Units) Forecast by Frequency, 2019 to 2034

Table 15: North America Market Value (US$ Million) Forecast by End Use, 2019 to 2034

Table 16: North America Market Volume (Units) Forecast by End Use, 2019 to 2034

Table 17: Latin America Market Value (US$ Million) Forecast by Country, 2019 to 2034

Table 18: Latin America Market Volume (Units) Forecast by Country, 2019 to 2034

Table 19: Latin America Market Value (US$ Million) Forecast by Type, 2019 to 2034

Table 20: Latin America Market Volume (Units) Forecast by Type, 2019 to 2034

Table 21: Latin America Market Value (US$ Million) Forecast by Frequency, 2019 to 2034

Table 22: Latin America Market Volume (Units) Forecast by Frequency, 2019 to 2034

Table 23: Latin America Market Value (US$ Million) Forecast by End Use, 2019 to 2034

Table 24: Latin America Market Volume (Units) Forecast by End Use, 2019 to 2034

Table 25: Western Europe Market Value (US$ Million) Forecast by Country, 2019 to 2034

Table 26: Western Europe Market Volume (Units) Forecast by Country, 2019 to 2034

Table 27: Western Europe Market Value (US$ Million) Forecast by Type, 2019 to 2034

Table 28: Western Europe Market Volume (Units) Forecast by Type, 2019 to 2034

Table 29: Western Europe Market Value (US$ Million) Forecast by Frequency, 2019 to 2034

Table 30: Western Europe Market Volume (Units) Forecast by Frequency, 2019 to 2034

Table 31: Western Europe Market Value (US$ Million) Forecast by End Use, 2019 to 2034

Table 32: Western Europe Market Volume (Units) Forecast by End Use, 2019 to 2034

Table 33: Eastern Europe Market Value (US$ Million) Forecast by Country, 2019 to 2034

Table 34: Eastern Europe Market Volume (Units) Forecast by Country, 2019 to 2034

Table 35: Eastern Europe Market Value (US$ Million) Forecast by Type, 2019 to 2034

Table 36: Eastern Europe Market Volume (Units) Forecast by Type, 2019 to 2034

Table 37: Eastern Europe Market Value (US$ Million) Forecast by Frequency, 2019 to 2034

Table 38: Eastern Europe Market Volume (Units) Forecast by Frequency, 2019 to 2034

Table 39: Eastern Europe Market Value (US$ Million) Forecast by End Use, 2019 to 2034

Table 40: Eastern Europe Market Volume (Units) Forecast by End Use, 2019 to 2034

Table 41: South Asia and Pacific Market Value (US$ Million) Forecast by Country, 2019 to 2034

Table 42: South Asia and Pacific Market Volume (Units) Forecast by Country, 2019 to 2034

Table 43: South Asia and Pacific Market Value (US$ Million) Forecast by Type, 2019 to 2034

Table 44: South Asia and Pacific Market Volume (Units) Forecast by Type, 2019 to 2034

Table 45: South Asia and Pacific Market Value (US$ Million) Forecast by Frequency, 2019 to 2034

Table 46: South Asia and Pacific Market Volume (Units) Forecast by Frequency, 2019 to 2034

Table 47: South Asia and Pacific Market Value (US$ Million) Forecast by End Use, 2019 to 2034

Table 48: South Asia and Pacific Market Volume (Units) Forecast by End Use, 2019 to 2034

Table 49: East Asia Market Value (US$ Million) Forecast by Country, 2019 to 2034

Table 50: East Asia Market Volume (Units) Forecast by Country, 2019 to 2034

Table 51: East Asia Market Value (US$ Million) Forecast by Type, 2019 to 2034

Table 52: East Asia Market Volume (Units) Forecast by Type, 2019 to 2034

Table 53: East Asia Market Value (US$ Million) Forecast by Frequency, 2019 to 2034

Table 54: East Asia Market Volume (Units) Forecast by Frequency, 2019 to 2034

Table 55: East Asia Market Value (US$ Million) Forecast by End Use, 2019 to 2034

Table 56: East Asia Market Volume (Units) Forecast by End Use, 2019 to 2034

Table 57: Middle East and Africa Market Value (US$ Million) Forecast by Country, 2019 to 2034

Table 58: Middle East and Africa Market Volume (Units) Forecast by Country, 2019 to 2034

Table 59: Middle East and Africa Market Value (US$ Million) Forecast by Type, 2019 to 2034

Table 60: Middle East and Africa Market Volume (Units) Forecast by Type, 2019 to 2034

Table 61: Middle East and Africa Market Value (US$ Million) Forecast by Frequency, 2019 to 2034

Table 62: Middle East and Africa Market Volume (Units) Forecast by Frequency, 2019 to 2034

Table 63: Middle East and Africa Market Value (US$ Million) Forecast by End Use, 2019 to 2034

Table 64: Middle East and Africa Market Volume (Units) Forecast by End Use, 2019 to 2034

List of Figures

Figure 1: Global Market Value (US$ Million) by Type, 2024 to 2034

Figure 2: Global Market Value (US$ Million) by Frequency, 2024 to 2034

Figure 3: Global Market Value (US$ Million) by End Use, 2024 to 2034

Figure 4: Global Market Value (US$ Million) by Region, 2024 to 2034

Figure 5: Global Market Value (US$ Million) Analysis by Region, 2019 to 2034

Figure 6: Global Market Volume (Units) Analysis by Region, 2019 to 2034

Figure 7: Global Market Value Share (%) and BPS Analysis by Region, 2024 to 2034

Figure 8: Global Market Y-o-Y Growth (%) Projections by Region, 2024 to 2034

Figure 9: Global Market Value (US$ Million) Analysis by Type, 2019 to 2034

Figure 10: Global Market Volume (Units) Analysis by Type, 2019 to 2034

Figure 11: Global Market Value Share (%) and BPS Analysis by Type, 2024 to 2034

Figure 12: Global Market Y-o-Y Growth (%) Projections by Type, 2024 to 2034

Figure 13: Global Market Value (US$ Million) Analysis by Frequency, 2019 to 2034

Figure 14: Global Market Volume (Units) Analysis by Frequency, 2019 to 2034

Figure 15: Global Market Value Share (%) and BPS Analysis by Frequency, 2024 to 2034

Figure 16: Global Market Y-o-Y Growth (%) Projections by Frequency, 2024 to 2034

Figure 17: Global Market Value (US$ Million) Analysis by End Use, 2019 to 2034

Figure 18: Global Market Volume (Units) Analysis by End Use, 2019 to 2034

Figure 19: Global Market Value Share (%) and BPS Analysis by End Use, 2024 to 2034

Figure 20: Global Market Y-o-Y Growth (%) Projections by End Use, 2024 to 2034

Figure 21: Global Market Attractiveness by Type, 2024 to 2034

Figure 22: Global Market Attractiveness by Frequency, 2024 to 2034

Figure 23: Global Market Attractiveness by End Use, 2024 to 2034

Figure 24: Global Market Attractiveness by Region, 2024 to 2034

Figure 25: North America Market Value (US$ Million) by Type, 2024 to 2034

Figure 26: North America Market Value (US$ Million) by Frequency, 2024 to 2034

Figure 27: North America Market Value (US$ Million) by End Use, 2024 to 2034

Figure 28: North America Market Value (US$ Million) by Country, 2024 to 2034

Figure 29: North America Market Value (US$ Million) Analysis by Country, 2019 to 2034

Figure 30: North America Market Volume (Units) Analysis by Country, 2019 to 2034

Figure 31: North America Market Value Share (%) and BPS Analysis by Country, 2024 to 2034

Figure 32: North America Market Y-o-Y Growth (%) Projections by Country, 2024 to 2034

Figure 33: North America Market Value (US$ Million) Analysis by Type, 2019 to 2034

Figure 34: North America Market Volume (Units) Analysis by Type, 2019 to 2034

Figure 35: North America Market Value Share (%) and BPS Analysis by Type, 2024 to 2034

Figure 36: North America Market Y-o-Y Growth (%) Projections by Type, 2024 to 2034

Figure 37: North America Market Value (US$ Million) Analysis by Frequency, 2019 to 2034

Figure 38: North America Market Volume (Units) Analysis by Frequency, 2019 to 2034

Figure 39: North America Market Value Share (%) and BPS Analysis by Frequency, 2024 to 2034

Figure 40: North America Market Y-o-Y Growth (%) Projections by Frequency, 2024 to 2034

Figure 41: North America Market Value (US$ Million) Analysis by End Use, 2019 to 2034

Figure 42: North America Market Volume (Units) Analysis by End Use, 2019 to 2034

Figure 43: North America Market Value Share (%) and BPS Analysis by End Use, 2024 to 2034

Figure 44: North America Market Y-o-Y Growth (%) Projections by End Use, 2024 to 2034

Figure 45: North America Market Attractiveness by Type, 2024 to 2034

Figure 46: North America Market Attractiveness by Frequency, 2024 to 2034

Figure 47: North America Market Attractiveness by End Use, 2024 to 2034

Figure 48: North America Market Attractiveness by Country, 2024 to 2034

Figure 49: Latin America Market Value (US$ Million) by Type, 2024 to 2034

Figure 50: Latin America Market Value (US$ Million) by Frequency, 2024 to 2034

Figure 51: Latin America Market Value (US$ Million) by End Use, 2024 to 2034

Figure 52: Latin America Market Value (US$ Million) by Country, 2024 to 2034

Figure 53: Latin America Market Value (US$ Million) Analysis by Country, 2019 to 2034

Figure 54: Latin America Market Volume (Units) Analysis by Country, 2019 to 2034

Figure 55: Latin America Market Value Share (%) and BPS Analysis by Country, 2024 to 2034

Figure 56: Latin America Market Y-o-Y Growth (%) Projections by Country, 2024 to 2034

Figure 57: Latin America Market Value (US$ Million) Analysis by Type, 2019 to 2034

Figure 58: Latin America Market Volume (Units) Analysis by Type, 2019 to 2034

Figure 59: Latin America Market Value Share (%) and BPS Analysis by Type, 2024 to 2034

Figure 60: Latin America Market Y-o-Y Growth (%) Projections by Type, 2024 to 2034

Figure 61: Latin America Market Value (US$ Million) Analysis by Frequency, 2019 to 2034

Figure 62: Latin America Market Volume (Units) Analysis by Frequency, 2019 to 2034

Figure 63: Latin America Market Value Share (%) and BPS Analysis by Frequency, 2024 to 2034

Figure 64: Latin America Market Y-o-Y Growth (%) Projections by Frequency, 2024 to 2034

Figure 65: Latin America Market Value (US$ Million) Analysis by End Use, 2019 to 2034

Figure 66: Latin America Market Volume (Units) Analysis by End Use, 2019 to 2034

Figure 67: Latin America Market Value Share (%) and BPS Analysis by End Use, 2024 to 2034

Figure 68: Latin America Market Y-o-Y Growth (%) Projections by End Use, 2024 to 2034

Figure 69: Latin America Market Attractiveness by Type, 2024 to 2034

Figure 70: Latin America Market Attractiveness by Frequency, 2024 to 2034

Figure 71: Latin America Market Attractiveness by End Use, 2024 to 2034

Figure 72: Latin America Market Attractiveness by Country, 2024 to 2034

Figure 73: Western Europe Market Value (US$ Million) by Type, 2024 to 2034

Figure 74: Western Europe Market Value (US$ Million) by Frequency, 2024 to 2034

Figure 75: Western Europe Market Value (US$ Million) by End Use, 2024 to 2034

Figure 76: Western Europe Market Value (US$ Million) by Country, 2024 to 2034

Figure 77: Western Europe Market Value (US$ Million) Analysis by Country, 2019 to 2034

Figure 78: Western Europe Market Volume (Units) Analysis by Country, 2019 to 2034

Figure 79: Western Europe Market Value Share (%) and BPS Analysis by Country, 2024 to 2034

Figure 80: Western Europe Market Y-o-Y Growth (%) Projections by Country, 2024 to 2034

Figure 81: Western Europe Market Value (US$ Million) Analysis by Type, 2019 to 2034

Figure 82: Western Europe Market Volume (Units) Analysis by Type, 2019 to 2034

Figure 83: Western Europe Market Value Share (%) and BPS Analysis by Type, 2024 to 2034

Figure 84: Western Europe Market Y-o-Y Growth (%) Projections by Type, 2024 to 2034

Figure 85: Western Europe Market Value (US$ Million) Analysis by Frequency, 2019 to 2034

Figure 86: Western Europe Market Volume (Units) Analysis by Frequency, 2019 to 2034

Figure 87: Western Europe Market Value Share (%) and BPS Analysis by Frequency, 2024 to 2034

Figure 88: Western Europe Market Y-o-Y Growth (%) Projections by Frequency, 2024 to 2034

Figure 89: Western Europe Market Value (US$ Million) Analysis by End Use, 2019 to 2034

Figure 90: Western Europe Market Volume (Units) Analysis by End Use, 2019 to 2034

Figure 91: Western Europe Market Value Share (%) and BPS Analysis by End Use, 2024 to 2034

Figure 92: Western Europe Market Y-o-Y Growth (%) Projections by End Use, 2024 to 2034

Figure 93: Western Europe Market Attractiveness by Type, 2024 to 2034

Figure 94: Western Europe Market Attractiveness by Frequency, 2024 to 2034

Figure 95: Western Europe Market Attractiveness by End Use, 2024 to 2034

Figure 96: Western Europe Market Attractiveness by Country, 2024 to 2034

Figure 97: Eastern Europe Market Value (US$ Million) by Type, 2024 to 2034

Figure 98: Eastern Europe Market Value (US$ Million) by Frequency, 2024 to 2034

Figure 99: Eastern Europe Market Value (US$ Million) by End Use, 2024 to 2034

Figure 100: Eastern Europe Market Value (US$ Million) by Country, 2024 to 2034

Figure 101: Eastern Europe Market Value (US$ Million) Analysis by Country, 2019 to 2034

Figure 102: Eastern Europe Market Volume (Units) Analysis by Country, 2019 to 2034

Figure 103: Eastern Europe Market Value Share (%) and BPS Analysis by Country, 2024 to 2034

Figure 104: Eastern Europe Market Y-o-Y Growth (%) Projections by Country, 2024 to 2034

Figure 105: Eastern Europe Market Value (US$ Million) Analysis by Type, 2019 to 2034

Figure 106: Eastern Europe Market Volume (Units) Analysis by Type, 2019 to 2034

Figure 107: Eastern Europe Market Value Share (%) and BPS Analysis by Type, 2024 to 2034

Figure 108: Eastern Europe Market Y-o-Y Growth (%) Projections by Type, 2024 to 2034

Figure 109: Eastern Europe Market Value (US$ Million) Analysis by Frequency, 2019 to 2034

Figure 110: Eastern Europe Market Volume (Units) Analysis by Frequency, 2019 to 2034

Figure 111: Eastern Europe Market Value Share (%) and BPS Analysis by Frequency, 2024 to 2034

Figure 112: Eastern Europe Market Y-o-Y Growth (%) Projections by Frequency, 2024 to 2034

Figure 113: Eastern Europe Market Value (US$ Million) Analysis by End Use, 2019 to 2034

Figure 114: Eastern Europe Market Volume (Units) Analysis by End Use, 2019 to 2034

Figure 115: Eastern Europe Market Value Share (%) and BPS Analysis by End Use, 2024 to 2034

Figure 116: Eastern Europe Market Y-o-Y Growth (%) Projections by End Use, 2024 to 2034

Figure 117: Eastern Europe Market Attractiveness by Type, 2024 to 2034

Figure 118: Eastern Europe Market Attractiveness by Frequency, 2024 to 2034

Figure 119: Eastern Europe Market Attractiveness by End Use, 2024 to 2034

Figure 120: Eastern Europe Market Attractiveness by Country, 2024 to 2034

Figure 121: South Asia and Pacific Market Value (US$ Million) by Type, 2024 to 2034

Figure 122: South Asia and Pacific Market Value (US$ Million) by Frequency, 2024 to 2034

Figure 123: South Asia and Pacific Market Value (US$ Million) by End Use, 2024 to 2034

Figure 124: South Asia and Pacific Market Value (US$ Million) by Country, 2024 to 2034

Figure 125: South Asia and Pacific Market Value (US$ Million) Analysis by Country, 2019 to 2034

Figure 126: South Asia and Pacific Market Volume (Units) Analysis by Country, 2019 to 2034

Figure 127: South Asia and Pacific Market Value Share (%) and BPS Analysis by Country, 2024 to 2034

Figure 128: South Asia and Pacific Market Y-o-Y Growth (%) Projections by Country, 2024 to 2034

Figure 129: South Asia and Pacific Market Value (US$ Million) Analysis by Type, 2019 to 2034

Figure 130: South Asia and Pacific Market Volume (Units) Analysis by Type, 2019 to 2034

Figure 131: South Asia and Pacific Market Value Share (%) and BPS Analysis by Type, 2024 to 2034

Figure 132: South Asia and Pacific Market Y-o-Y Growth (%) Projections by Type, 2024 to 2034

Figure 133: South Asia and Pacific Market Value (US$ Million) Analysis by Frequency, 2019 to 2034

Figure 134: South Asia and Pacific Market Volume (Units) Analysis by Frequency, 2019 to 2034

Figure 135: South Asia and Pacific Market Value Share (%) and BPS Analysis by Frequency, 2024 to 2034

Figure 136: South Asia and Pacific Market Y-o-Y Growth (%) Projections by Frequency, 2024 to 2034

Figure 137: South Asia and Pacific Market Value (US$ Million) Analysis by End Use, 2019 to 2034

Figure 138: South Asia and Pacific Market Volume (Units) Analysis by End Use, 2019 to 2034

Figure 139: South Asia and Pacific Market Value Share (%) and BPS Analysis by End Use, 2024 to 2034

Figure 140: South Asia and Pacific Market Y-o-Y Growth (%) Projections by End Use, 2024 to 2034

Figure 141: South Asia and Pacific Market Attractiveness by Type, 2024 to 2034

Figure 142: South Asia and Pacific Market Attractiveness by Frequency, 2024 to 2034

Figure 143: South Asia and Pacific Market Attractiveness by End Use, 2024 to 2034

Figure 144: South Asia and Pacific Market Attractiveness by Country, 2024 to 2034

Figure 145: East Asia Market Value (US$ Million) by Type, 2024 to 2034

Figure 146: East Asia Market Value (US$ Million) by Frequency, 2024 to 2034

Figure 147: East Asia Market Value (US$ Million) by End Use, 2024 to 2034

Figure 148: East Asia Market Value (US$ Million) by Country, 2024 to 2034

Figure 149: East Asia Market Value (US$ Million) Analysis by Country, 2019 to 2034

Figure 150: East Asia Market Volume (Units) Analysis by Country, 2019 to 2034

Figure 151: East Asia Market Value Share (%) and BPS Analysis by Country, 2024 to 2034

Figure 152: East Asia Market Y-o-Y Growth (%) Projections by Country, 2024 to 2034

Figure 153: East Asia Market Value (US$ Million) Analysis by Type, 2019 to 2034

Figure 154: East Asia Market Volume (Units) Analysis by Type, 2019 to 2034

Figure 155: East Asia Market Value Share (%) and BPS Analysis by Type, 2024 to 2034

Figure 156: East Asia Market Y-o-Y Growth (%) Projections by Type, 2024 to 2034

Figure 157: East Asia Market Value (US$ Million) Analysis by Frequency, 2019 to 2034

Figure 158: East Asia Market Volume (Units) Analysis by Frequency, 2019 to 2034

Figure 159: East Asia Market Value Share (%) and BPS Analysis by Frequency, 2024 to 2034

Figure 160: East Asia Market Y-o-Y Growth (%) Projections by Frequency, 2024 to 2034

Figure 161: East Asia Market Value (US$ Million) Analysis by End Use, 2019 to 2034

Figure 162: East Asia Market Volume (Units) Analysis by End Use, 2019 to 2034

Figure 163: East Asia Market Value Share (%) and BPS Analysis by End Use, 2024 to 2034

Figure 164: East Asia Market Y-o-Y Growth (%) Projections by End Use, 2024 to 2034

Figure 165: East Asia Market Attractiveness by Type, 2024 to 2034

Figure 166: East Asia Market Attractiveness by Frequency, 2024 to 2034

Figure 167: East Asia Market Attractiveness by End Use, 2024 to 2034

Figure 168: East Asia Market Attractiveness by Country, 2024 to 2034

Figure 169: Middle East and Africa Market Value (US$ Million) by Type, 2024 to 2034

Figure 170: Middle East and Africa Market Value (US$ Million) by Frequency, 2024 to 2034

Figure 171: Middle East and Africa Market Value (US$ Million) by End Use, 2024 to 2034

Figure 172: Middle East and Africa Market Value (US$ Million) by Country, 2024 to 2034

Figure 173: Middle East and Africa Market Value (US$ Million) Analysis by Country, 2019 to 2034

Figure 174: Middle East and Africa Market Volume (Units) Analysis by Country, 2019 to 2034

Figure 175: Middle East and Africa Market Value Share (%) and BPS Analysis by Country, 2024 to 2034

Figure 176: Middle East and Africa Market Y-o-Y Growth (%) Projections by Country, 2024 to 2034

Figure 177: Middle East and Africa Market Value (US$ Million) Analysis by Type, 2019 to 2034

Figure 178: Middle East and Africa Market Volume (Units) Analysis by Type, 2019 to 2034

Figure 179: Middle East and Africa Market Value Share (%) and BPS Analysis by Type, 2024 to 2034

Figure 180: Middle East and Africa Market Y-o-Y Growth (%) Projections by Type, 2024 to 2034

Figure 181: Middle East and Africa Market Value (US$ Million) Analysis by Frequency, 2019 to 2034

Figure 182: Middle East and Africa Market Volume (Units) Analysis by Frequency, 2019 to 2034

Figure 183: Middle East and Africa Market Value Share (%) and BPS Analysis by Frequency, 2024 to 2034

Figure 184: Middle East and Africa Market Y-o-Y Growth (%) Projections by Frequency, 2024 to 2034

Figure 185: Middle East and Africa Market Value (US$ Million) Analysis by End Use, 2019 to 2034

Figure 186: Middle East and Africa Market Volume (Units) Analysis by End Use, 2019 to 2034

Figure 187: Middle East and Africa Market Value Share (%) and BPS Analysis by End Use, 2024 to 2034

Figure 188: Middle East and Africa Market Y-o-Y Growth (%) Projections by End Use, 2024 to 2034

Figure 189: Middle East and Africa Market Attractiveness by Type, 2024 to 2034

Figure 190: Middle East and Africa Market Attractiveness by Frequency, 2024 to 2034

Figure 191: Middle East and Africa Market Attractiveness by End Use, 2024 to 2034

Figure 192: Middle East and Africa Market Attractiveness by Country, 2024 to 2034

Frequently Asked Questions

What is the anticipated value of the Public Announcement System Market in 2024?

The public announcement system market is projected to hit at USD 976 million by 2024.

How is the Public Announcement System Market Expanding?

The public announcement system market is slated for a 5.60% CAGR expansion by 2034.

What is the growth potential projected for the Public Announcement System Market by 2034?

The public announcement system market is estimated to USD 1,715.10 million by 2034.

Which country is expected to lead the Public Announcement System Market?

India is poised to lead the market, experiencing a 6.30% CAGR through 2034.

What Application segment dominates the Public Announcement System domain?

The outdoor segment holds sway, projecting a market share of 29.00% through 2023.

Explore Similar Insights

Future Market Insights

Public Announcement System Market