Cloud IT Infrastructure Hardware Market Size and Share Forecast Outlook 2025 to 2035

The Cloud IT Infrastructure Hardware Market is estimated to be valued at USD 294.4 billion in 2025 and is projected to reach USD 906.1 billion by 2035, registering a compound annual growth rate (CAGR) of 11.9% over the forecast period.
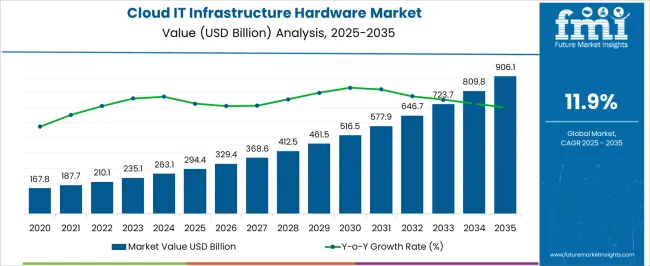
Quick Stats for Cloud IT Infrastructure Hardware Market

  • Cloud IT Infrastructure Hardware Market Value (2025): USD 294.4 billion
  • Cloud IT Infrastructure Hardware Market Forecast Value (2035): USD 906.1 billion
  • Cloud IT Infrastructure Hardware Market Forecast CAGR: 11.9%
  • Leading Segment in Cloud IT Infrastructure Hardware Market in 2025: Server (41.2%)
  • Key Growth Regions in Cloud IT Infrastructure Hardware Market: North America, Asia-Pacific, Europe
  • Top Key Players in Cloud IT Infrastructure Hardware Market: Oracle Corporation, IBM Corporation, Intel Corporation, Hewlett Packard Enterprise Development LP, Amazon Web Services, Inc., Cisco Systems, Inc., Dell Inc., Lenovo Group Ltd., NetApp Inc., Microsoft Corporation, Google LLC, Salesforce, Inc.
Cloud It Infrastructure Hardware Market Market Value Analysis

Cloud IT Infrastructure Hardware Market Key Takeaways

Metric Value
Cloud IT Infrastructure Hardware Market Estimated Value in (2025 E) USD 294.4 billion
Cloud IT Infrastructure Hardware Market Forecast Value in (2035 F) USD 906.1 billion
Forecast CAGR (2025 to 2035) 11.9%

Why is the Cloud IT Infrastructure Hardware Market Growing?

The Cloud IT Infrastructure Hardware market is experiencing strong expansion, driven by the increasing reliance on cloud-based ecosystems across enterprises and government sectors. The rising adoption of digital transformation strategies, coupled with the growing demand for hybrid and multi-cloud architectures, is fueling investments in advanced hardware infrastructure. Cloud providers and enterprises are investing in scalable, energy-efficient, and high-performance hardware to support big data analytics, artificial intelligence, and machine learning applications.

Enhanced storage and compute capacity are critical in ensuring business continuity, disaster recovery, and real-time processing needs, particularly in sectors such as banking, e-commerce, healthcare, and manufacturing. Furthermore, advancements in next-generation processors, high-speed networking components, and energy-optimized data centers are enabling organizations to enhance performance while reducing operational costs.

The increasing focus on data sovereignty, security compliance, and sustainability initiatives is further influencing hardware adoption strategies As cloud adoption accelerates globally, driven by demand for scalability and reliability, the Cloud IT Infrastructure Hardware market is positioned for long-term growth, with strong opportunities emerging from both established enterprises and fast-growing digital-first companies.

Segmental Analysis

The cloud it infrastructure hardware market is segmented by component, end-user, and geographic regions. By component, cloud it infrastructure hardware market is divided into Server, Storage Systems, and Network Devices. In terms of end-user, cloud it infrastructure hardware market is classified into Cloud Service Provider and Third Party Data Center Provider. Regionally, the cloud it infrastructure hardware industry is classified into North America, Latin America, Western Europe, Eastern Europe, Balkan & Baltic Countries, Russia & Belarus, Central Asia, East Asia, South Asia & Pacific, and the Middle East & Africa.
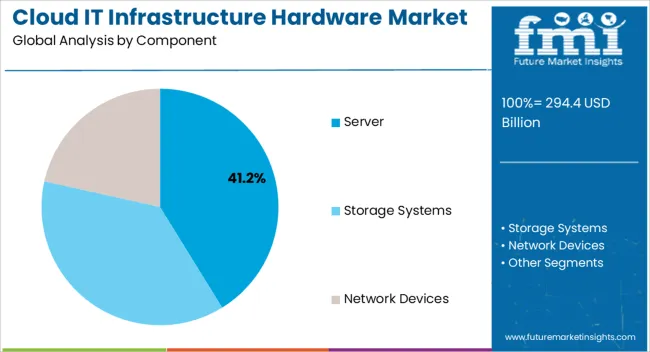
Insights into the Server Component Segment

Cloud It Infrastructure Hardware Market Analysis By Component

The server component segment is projected to hold 41.2% of the market revenue in 2025, making it the leading hardware category within the cloud IT infrastructure market. This growth is being fueled by the increasing need for powerful and scalable computing capabilities to support expanding workloads in public, private, and hybrid cloud environments. Servers are fundamental to enabling virtualization, containerization, and AI-driven applications, which are now central to enterprise operations.

The adoption of high-performance servers with enhanced processing power, larger memory capacity, and optimized energy efficiency is driving demand across industries. Cloud service providers and enterprises are prioritizing modular and software-defined server architectures, which offer flexibility, automation, and streamlined resource allocation. Furthermore, the deployment of edge data centers and hyperscale facilities is contributing to higher demand for advanced server systems.

The segment’s growth is also supported by continued innovations in processor technologies and integration with advanced networking solutions As cloud-based workloads intensify, servers are expected to remain the cornerstone of infrastructure investments, consolidating their position as the largest revenue-generating component.
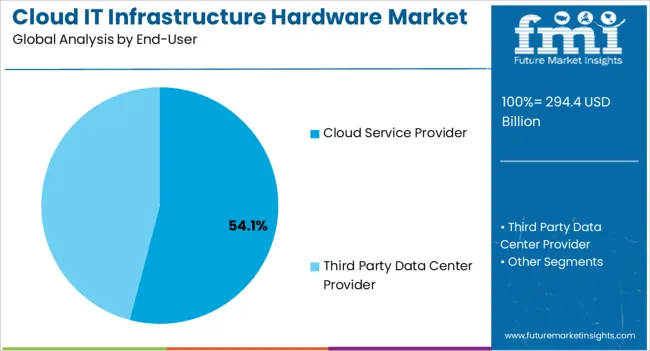
Insights into the Cloud Service Provider End-User Segment

Cloud It Infrastructure Hardware Market Analysis By End User

The cloud service provider segment is anticipated to account for 54.1% of the market revenue in 2025, establishing itself as the leading end-user category. Growth in this segment is being driven by the rapid expansion of hyperscale cloud providers and their increasing investments in building advanced global data center networks. Providers are deploying highly efficient and scalable IT infrastructure hardware to meet surging demand for cloud services from enterprises, governments, and consumers.

The segment benefits from growing adoption of digital platforms, AI, IoT, and 5G technologies, all of which require reliable and high-performance infrastructure. Cloud service providers are prioritizing hardware that supports automation, virtualization, and dynamic workload management, enabling cost efficiency and flexibility in service delivery.

Furthermore, sustainability initiatives are prompting investments in energy-efficient hardware and liquid cooling systems to optimize power consumption The continuous push for global cloud adoption, combined with escalating requirements for real-time data processing and secure service delivery, ensures that cloud service providers will remain the dominant end-user group in the market, driving consistent demand for infrastructure hardware.

Market Overview

Cloud IT Infrastructure Hardware Market Overview

Cloud IT infrastructure hardware is present in all the three cloud computing models - infrastructure as a service, platform as a service and software as a service. Companies either purchase these cloud IT infrastructure hardware or take them on rent from various cloud infrastructure vendors.

Usually when the cloud IT infrastructure is taken on rent there is a fixed subscription fee that the subscriber needs to pay to the vendor. Whereas, if the business purchases cloud IT infrastructure hardware, they usually purchase it on pay-per-use pricing model.

According to this pricing model the users need to pay only for the services consumed which is calculated on an hourly, weekly or monthly basis.

Enterprises that are technically sound, can even build their own cloud IT infrastructure hardware, rather than purchasing it or taking it on rent from a third-party vendor. This enables companies to take up more ownership of the resources that they are investing in; which is an emerging trend in the cloud IT infrastructure hardware market.
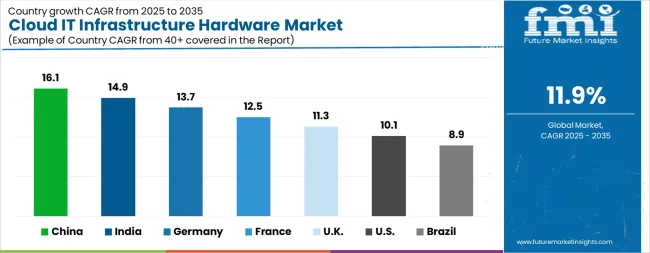
Analysis of Cloud IT Infrastructure Hardware Market By Key Countries

Cloud It Infrastructure Hardware Market Cagr Analysis By Country
Country CAGR
China 16.1%
India 14.9%
Germany 13.7%
France 12.5%
UK 11.3%
USA 10.1%
Brazil 8.9%

Country-wise Analysis

The Cloud IT Infrastructure Hardware Market is expected to register a CAGR of 11.9% during the forecast period, exhibiting varied country level momentum. China leads with the highest CAGR of 16.1%, followed by India at 14.9%. Developed markets such as Germany, France, and the UK continue to expand steadily, while the USA is likely to grow at consistent rates. Brazil posts the lowest CAGR at 8.9%, yet still underscores a broadly positive trajectory for the global Cloud IT Infrastructure Hardware Market. In 2024, Germany held a dominant revenue in the Western Europe market and is expected to grow with a CAGR of 13.7%. The USA Cloud IT Infrastructure Hardware Market is estimated to be valued at USD 108.7 billion in 2025 and is anticipated to reach a valuation of USD 284.8 billion by 2035. Sales are projected to rise at a CAGR of 10.1% over the forecast period between 2025 and 2035. While Japan and South Korea markets are estimated to be valued at USD 15.4 billion and USD 8.9 billion respectively in 2025.
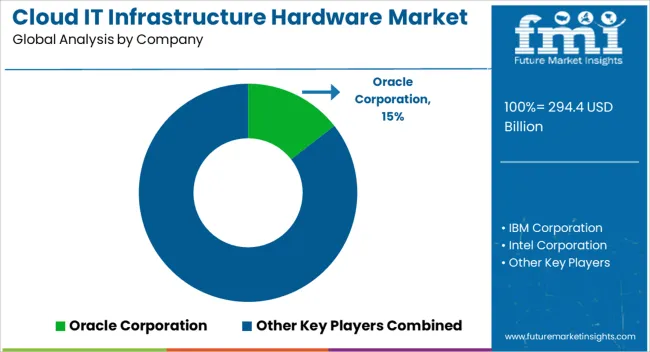
Key Players in the Cloud IT Infrastructure Hardware Market

Cloud It Infrastructure Hardware Market Analysis By Company

  • Oracle Corporation
  • IBM Corporation
  • Intel Corporation
  • Hewlett Packard Enterprise Development LP
  • Amazon Web Services, Inc.
  • Cisco Systems, Inc.
  • Dell Inc.
  • Lenovo Group Ltd.
  • NetApp Inc.
  • Microsoft Corporation
  • Google LLC
  • Salesforce, Inc.

Scope of the Report

Item Value
Quantitative Units USD 294.4 Billion
Component Server, Storage Systems, and Network Devices
End-User Cloud Service Provider and Third Party Data Center Provider
Regions Covered North America, Europe, Asia-Pacific, Latin America, Middle East & Africa
Country Covered United States, Canada, Germany, France, United Kingdom, China, Japan, India, Brazil, South Africa
Key Companies Profiled Oracle Corporation, IBM Corporation, Intel Corporation, Hewlett Packard Enterprise Development LP, Amazon Web Services, Inc., Cisco Systems, Inc., Dell Inc., Lenovo Group Ltd., NetApp Inc., Microsoft Corporation, Google LLC, and Salesforce, Inc.

Cloud IT Infrastructure Hardware Market by Segments

Component:

  • Server
  • Storage Systems
  • Network Devices

End-User:

  • Cloud Service Provider
  • Third Party Data Center Provider

Region:

  • North America
    • USA
    • Canada
    • Mexico
  • Latin America
    • Brazil
    • Chile
    • Rest of Latin America
  • Western Europe
    • Germany
    • UK
    • Italy
    • Spain
    • France
    • Nordic
    • BENELUX
    • Rest of Western Europe
  • Eastern Europe
    • Russia
    • Poland
    • Hungary
    • Balkan & Baltic
    • Rest of Eastern Europe
  • East Asia
    • China
    • Japan
    • South Korea
  • South Asia and Pacific
    • India
    • ASEAN
    • Australia & New Zealand
    • Rest of South Asia and Pacific
  • Middle East & Africa
    • Kingdom of Saudi Arabia
    • Other GCC Countries
    • Turkiye
    • South Africa
    • Other African Union
    • Rest of Middle East & Africa

Table of Content

  1. Executive Summary
    • Global Market Outlook
    • Demand-side Trends
    • Supply-side Trends
    • Technology Roadmap Analysis
    • Analysis and Recommendations
  2. Market Overview
    • Market Coverage / Taxonomy
    • Market Definition / Scope / Limitations
  3. Market Background
    • Market Dynamics
      • Drivers
      • Restraints
      • Opportunity
      • Trends
    • Scenario Forecast
      • Demand in Optimistic Scenario
      • Demand in Likely Scenario
      • Demand in Conservative Scenario
    • Opportunity Map Analysis
    • Product Life Cycle Analysis
    • Supply Chain Analysis
    • Investment Feasibility Matrix
    • Value Chain Analysis
    • PESTLE and Porter’s Analysis
    • Regulatory Landscape
    • Regional Parent Market Outlook
    • Production and Consumption Statistics
    • Import and Export Statistics
  4. Global Market Analysis 2020 to 2024 and Forecast, 2025 to 2035
    • Historical Market Size Value (USD Million) Analysis, 2020 to 2024
    • Current and Future Market Size Value (USD Million) Projections, 2025 to 2035
      • Y-o-Y Growth Trend Analysis
      • Absolute $ Opportunity Analysis
  5. Global Market Pricing Analysis 2020 to 2024 and Forecast 2025 to 2035
  6. Global Market Analysis 2020 to 2024 and Forecast 2025 to 2035, By Component
    • Introduction / Key Findings
    • Historical Market Size Value (USD Million) Analysis By Component , 2020 to 2024
    • Current and Future Market Size Value (USD Million) Analysis and Forecast By Component , 2025 to 2035
      • Server
      • Storage Systems
      • Network Devices
    • Y-o-Y Growth Trend Analysis By Component , 2020 to 2024
    • Absolute $ Opportunity Analysis By Component , 2025 to 2035
  7. Global Market Analysis 2020 to 2024 and Forecast 2025 to 2035, By End-User
    • Introduction / Key Findings
    • Historical Market Size Value (USD Million) Analysis By End-User, 2020 to 2024
    • Current and Future Market Size Value (USD Million) Analysis and Forecast By End-User, 2025 to 2035
      • Cloud Service Provider
      • Third Party Data Center Provider
    • Y-o-Y Growth Trend Analysis By End-User, 2020 to 2024
    • Absolute $ Opportunity Analysis By End-User, 2025 to 2035
  8. Global Market Analysis 2020 to 2024 and Forecast 2025 to 2035, By Region
    • Introduction
    • Historical Market Size Value (USD Million) Analysis By Region, 2020 to 2024
    • Current Market Size Value (USD Million) Analysis and Forecast By Region, 2025 to 2035
      • North America
      • Latin America
      • Western Europe
      • Eastern Europe
      • East Asia
      • South Asia and Pacific
      • Middle East & Africa
    • Market Attractiveness Analysis By Region
  9. North America Market Analysis 2020 to 2024 and Forecast 2025 to 2035, By Country
    • Historical Market Size Value (USD Million) Trend Analysis By Market Taxonomy, 2020 to 2024
    • Market Size Value (USD Million) Forecast By Market Taxonomy, 2025 to 2035
      • By Country
        • USA
        • Canada
        • Mexico
      • By Component
      • By End-User
    • Market Attractiveness Analysis
      • By Country
      • By Component
      • By End-User
    • Key Takeaways
  10. Latin America Market Analysis 2020 to 2024 and Forecast 2025 to 2035, By Country
    • Historical Market Size Value (USD Million) Trend Analysis By Market Taxonomy, 2020 to 2024
    • Market Size Value (USD Million) Forecast By Market Taxonomy, 2025 to 2035
      • By Country
        • Brazil
        • Chile
        • Rest of Latin America
      • By Component
      • By End-User
    • Market Attractiveness Analysis
      • By Country
      • By Component
      • By End-User
    • Key Takeaways
  11. Western Europe Market Analysis 2020 to 2024 and Forecast 2025 to 2035, By Country
    • Historical Market Size Value (USD Million) Trend Analysis By Market Taxonomy, 2020 to 2024
    • Market Size Value (USD Million) Forecast By Market Taxonomy, 2025 to 2035
      • By Country
        • Germany
        • UK
        • Italy
        • Spain
        • France
        • Nordic
        • BENELUX
        • Rest of Western Europe
      • By Component
      • By End-User
    • Market Attractiveness Analysis
      • By Country
      • By Component
      • By End-User
    • Key Takeaways
  12. Eastern Europe Market Analysis 2020 to 2024 and Forecast 2025 to 2035, By Country
    • Historical Market Size Value (USD Million) Trend Analysis By Market Taxonomy, 2020 to 2024
    • Market Size Value (USD Million) Forecast By Market Taxonomy, 2025 to 2035
      • By Country
        • Russia
        • Poland
        • Hungary
        • Balkan & Baltic
        • Rest of Eastern Europe
      • By Component
      • By End-User
    • Market Attractiveness Analysis
      • By Country
      • By Component
      • By End-User
    • Key Takeaways
  13. East Asia Market Analysis 2020 to 2024 and Forecast 2025 to 2035, By Country
    • Historical Market Size Value (USD Million) Trend Analysis By Market Taxonomy, 2020 to 2024
    • Market Size Value (USD Million) Forecast By Market Taxonomy, 2025 to 2035
      • By Country
        • China
        • Japan
        • South Korea
      • By Component
      • By End-User
    • Market Attractiveness Analysis
      • By Country
      • By Component
      • By End-User
    • Key Takeaways
  14. South Asia and Pacific Market Analysis 2020 to 2024 and Forecast 2025 to 2035, By Country
    • Historical Market Size Value (USD Million) Trend Analysis By Market Taxonomy, 2020 to 2024
    • Market Size Value (USD Million) Forecast By Market Taxonomy, 2025 to 2035
      • By Country
        • India
        • ASEAN
        • Australia & New Zealand
        • Rest of South Asia and Pacific
      • By Component
      • By End-User
    • Market Attractiveness Analysis
      • By Country
      • By Component
      • By End-User
    • Key Takeaways
  15. Middle East & Africa Market Analysis 2020 to 2024 and Forecast 2025 to 2035, By Country
    • Historical Market Size Value (USD Million) Trend Analysis By Market Taxonomy, 2020 to 2024
    • Market Size Value (USD Million) Forecast By Market Taxonomy, 2025 to 2035
      • By Country
        • Kingdom of Saudi Arabia
        • Other GCC Countries
        • Turkiye
        • South Africa
        • Other African Union
        • Rest of Middle East & Africa
      • By Component
      • By End-User
    • Market Attractiveness Analysis
      • By Country
      • By Component
      • By End-User
    • Key Takeaways
  16. Key Countries Market Analysis
    • USA
      • Pricing Analysis
      • Market Share Analysis, 2024
        • By Component
        • By End-User
    • Canada
      • Pricing Analysis
      • Market Share Analysis, 2024
        • By Component
        • By End-User
    • Mexico
      • Pricing Analysis
      • Market Share Analysis, 2024
        • By Component
        • By End-User
    • Brazil
      • Pricing Analysis
      • Market Share Analysis, 2024
        • By Component
        • By End-User
    • Chile
      • Pricing Analysis
      • Market Share Analysis, 2024
        • By Component
        • By End-User
    • Germany
      • Pricing Analysis
      • Market Share Analysis, 2024
        • By Component
        • By End-User
    • UK
      • Pricing Analysis
      • Market Share Analysis, 2024
        • By Component
        • By End-User
    • Italy
      • Pricing Analysis
      • Market Share Analysis, 2024
        • By Component
        • By End-User
    • Spain
      • Pricing Analysis
      • Market Share Analysis, 2024
        • By Component
        • By End-User
    • France
      • Pricing Analysis
      • Market Share Analysis, 2024
        • By Component
        • By End-User
    • India
      • Pricing Analysis
      • Market Share Analysis, 2024
        • By Component
        • By End-User
    • ASEAN
      • Pricing Analysis
      • Market Share Analysis, 2024
        • By Component
        • By End-User
    • Australia & New Zealand
      • Pricing Analysis
      • Market Share Analysis, 2024
        • By Component
        • By End-User
    • China
      • Pricing Analysis
      • Market Share Analysis, 2024
        • By Component
        • By End-User
    • Japan
      • Pricing Analysis
      • Market Share Analysis, 2024
        • By Component
        • By End-User
    • South Korea
      • Pricing Analysis
      • Market Share Analysis, 2024
        • By Component
        • By End-User
    • Russia
      • Pricing Analysis
      • Market Share Analysis, 2024
        • By Component
        • By End-User
    • Poland
      • Pricing Analysis
      • Market Share Analysis, 2024
        • By Component
        • By End-User
    • Hungary
      • Pricing Analysis
      • Market Share Analysis, 2024
        • By Component
        • By End-User
    • Kingdom of Saudi Arabia
      • Pricing Analysis
      • Market Share Analysis, 2024
        • By Component
        • By End-User
    • Turkiye
      • Pricing Analysis
      • Market Share Analysis, 2024
        • By Component
        • By End-User
    • South Africa
      • Pricing Analysis
      • Market Share Analysis, 2024
        • By Component
        • By End-User
  17. Market Structure Analysis
    • Competition Dashboard
    • Competition Benchmarking
    • Market Share Analysis of Top Players
      • By Regional
      • By Component
      • By End-User
  18. Competition Analysis
    • Competition Deep Dive
      • Oracle Corporation
        • Overview
        • Product Portfolio
        • Profitability by Market Segments (Product/Age /Sales Channel/Region)
        • Sales Footprint
        • Strategy Overview
          • Marketing Strategy
          • Product Strategy
          • Channel Strategy
      • IBM Corporation
      • Intel Corporation
      • Hewlett Packard Enterprise Development LP
      • Amazon Web Services, Inc.
      • Cisco Systems, Inc.
      • Dell Inc.
      • Lenovo Group Ltd.
      • NetApp Inc.
      • Microsoft Corporation
      • Google LLC
      • Salesforce, Inc.
  19. Assumptions & Acronyms Used
  20. Research Methodology

List of Tables

  • Table 1: Global Market Value (USD Million) Forecast by Region, 2020-2035
  • Table 2: Global Market Value (USD Million) Forecast by Component , 2020-2035
  • Table 3: Global Market Value (USD Million) Forecast by End-User, 2020-2035
  • Table 4: North America Market Value (USD Million) Forecast by Country, 2020-2035
  • Table 5: North America Market Value (USD Million) Forecast by Component , 2020-2035
  • Table 6: North America Market Value (USD Million) Forecast by End-User, 2020-2035
  • Table 7: Latin America Market Value (USD Million) Forecast by Country, 2020-2035
  • Table 8: Latin America Market Value (USD Million) Forecast by Component , 2020-2035
  • Table 9: Latin America Market Value (USD Million) Forecast by End-User, 2020-2035
  • Table 10: Western Europe Market Value (USD Million) Forecast by Country, 2020-2035
  • Table 11: Western Europe Market Value (USD Million) Forecast by Component , 2020-2035
  • Table 12: Western Europe Market Value (USD Million) Forecast by End-User, 2020-2035
  • Table 13: Eastern Europe Market Value (USD Million) Forecast by Country, 2020-2035
  • Table 14: Eastern Europe Market Value (USD Million) Forecast by Component , 2020-2035
  • Table 15: Eastern Europe Market Value (USD Million) Forecast by End-User, 2020-2035
  • Table 16: East Asia Market Value (USD Million) Forecast by Country, 2020-2035
  • Table 17: East Asia Market Value (USD Million) Forecast by Component , 2020-2035
  • Table 18: East Asia Market Value (USD Million) Forecast by End-User, 2020-2035
  • Table 19: South Asia and Pacific Market Value (USD Million) Forecast by Country, 2020-2035
  • Table 20: South Asia and Pacific Market Value (USD Million) Forecast by Component , 2020-2035
  • Table 21: South Asia and Pacific Market Value (USD Million) Forecast by End-User, 2020-2035
  • Table 22: Middle East & Africa Market Value (USD Million) Forecast by Country, 2020-2035
  • Table 23: Middle East & Africa Market Value (USD Million) Forecast by Component , 2020-2035
  • Table 24: Middle East & Africa Market Value (USD Million) Forecast by End-User, 2020-2035

List of Figures

  • Figure 1: Global Market Pricing Analysis
  • Figure 2: Global Market Value (USD Million) Forecast 2020-2035
  • Figure 3: Global Market Value Share and BPS Analysis by Component , 2025 and 2035
  • Figure 4: Global Market Y-o-Y Growth Comparison by Component , 2025-2035
  • Figure 5: Global Market Attractiveness Analysis by Component
  • Figure 6: Global Market Value Share and BPS Analysis by End-User, 2025 and 2035
  • Figure 7: Global Market Y-o-Y Growth Comparison by End-User, 2025-2035
  • Figure 8: Global Market Attractiveness Analysis by End-User
  • Figure 9: Global Market Value (USD Million) Share and BPS Analysis by Region, 2025 and 2035
  • Figure 10: Global Market Y-o-Y Growth Comparison by Region, 2025-2035
  • Figure 11: Global Market Attractiveness Analysis by Region
  • Figure 12: North America Market Incremental Dollar Opportunity, 2025-2035
  • Figure 13: Latin America Market Incremental Dollar Opportunity, 2025-2035
  • Figure 14: Western Europe Market Incremental Dollar Opportunity, 2025-2035
  • Figure 15: Eastern Europe Market Incremental Dollar Opportunity, 2025-2035
  • Figure 16: East Asia Market Incremental Dollar Opportunity, 2025-2035
  • Figure 17: South Asia and Pacific Market Incremental Dollar Opportunity, 2025-2035
  • Figure 18: Middle East & Africa Market Incremental Dollar Opportunity, 2025-2035
  • Figure 19: North America Market Value Share and BPS Analysis by Country, 2025 and 2035
  • Figure 20: North America Market Value Share and BPS Analysis by Component , 2025 and 2035
  • Figure 21: North America Market Y-o-Y Growth Comparison by Component , 2025-2035
  • Figure 22: North America Market Attractiveness Analysis by Component
  • Figure 23: North America Market Value Share and BPS Analysis by End-User, 2025 and 2035
  • Figure 24: North America Market Y-o-Y Growth Comparison by End-User, 2025-2035
  • Figure 25: North America Market Attractiveness Analysis by End-User
  • Figure 26: Latin America Market Value Share and BPS Analysis by Country, 2025 and 2035
  • Figure 27: Latin America Market Value Share and BPS Analysis by Component , 2025 and 2035
  • Figure 28: Latin America Market Y-o-Y Growth Comparison by Component , 2025-2035
  • Figure 29: Latin America Market Attractiveness Analysis by Component
  • Figure 30: Latin America Market Value Share and BPS Analysis by End-User, 2025 and 2035
  • Figure 31: Latin America Market Y-o-Y Growth Comparison by End-User, 2025-2035
  • Figure 32: Latin America Market Attractiveness Analysis by End-User
  • Figure 33: Western Europe Market Value Share and BPS Analysis by Country, 2025 and 2035
  • Figure 34: Western Europe Market Value Share and BPS Analysis by Component , 2025 and 2035
  • Figure 35: Western Europe Market Y-o-Y Growth Comparison by Component , 2025-2035
  • Figure 36: Western Europe Market Attractiveness Analysis by Component
  • Figure 37: Western Europe Market Value Share and BPS Analysis by End-User, 2025 and 2035
  • Figure 38: Western Europe Market Y-o-Y Growth Comparison by End-User, 2025-2035
  • Figure 39: Western Europe Market Attractiveness Analysis by End-User
  • Figure 40: Eastern Europe Market Value Share and BPS Analysis by Country, 2025 and 2035
  • Figure 41: Eastern Europe Market Value Share and BPS Analysis by Component , 2025 and 2035
  • Figure 42: Eastern Europe Market Y-o-Y Growth Comparison by Component , 2025-2035
  • Figure 43: Eastern Europe Market Attractiveness Analysis by Component
  • Figure 44: Eastern Europe Market Value Share and BPS Analysis by End-User, 2025 and 2035
  • Figure 45: Eastern Europe Market Y-o-Y Growth Comparison by End-User, 2025-2035
  • Figure 46: Eastern Europe Market Attractiveness Analysis by End-User
  • Figure 47: East Asia Market Value Share and BPS Analysis by Country, 2025 and 2035
  • Figure 48: East Asia Market Value Share and BPS Analysis by Component , 2025 and 2035
  • Figure 49: East Asia Market Y-o-Y Growth Comparison by Component , 2025-2035
  • Figure 50: East Asia Market Attractiveness Analysis by Component
  • Figure 51: East Asia Market Value Share and BPS Analysis by End-User, 2025 and 2035
  • Figure 52: East Asia Market Y-o-Y Growth Comparison by End-User, 2025-2035
  • Figure 53: East Asia Market Attractiveness Analysis by End-User
  • Figure 54: South Asia and Pacific Market Value Share and BPS Analysis by Country, 2025 and 2035
  • Figure 55: South Asia and Pacific Market Value Share and BPS Analysis by Component , 2025 and 2035
  • Figure 56: South Asia and Pacific Market Y-o-Y Growth Comparison by Component , 2025-2035
  • Figure 57: South Asia and Pacific Market Attractiveness Analysis by Component
  • Figure 58: South Asia and Pacific Market Value Share and BPS Analysis by End-User, 2025 and 2035
  • Figure 59: South Asia and Pacific Market Y-o-Y Growth Comparison by End-User, 2025-2035
  • Figure 60: South Asia and Pacific Market Attractiveness Analysis by End-User
  • Figure 61: Middle East & Africa Market Value Share and BPS Analysis by Country, 2025 and 2035
  • Figure 62: Middle East & Africa Market Value Share and BPS Analysis by Component , 2025 and 2035
  • Figure 63: Middle East & Africa Market Y-o-Y Growth Comparison by Component , 2025-2035
  • Figure 64: Middle East & Africa Market Attractiveness Analysis by Component
  • Figure 65: Middle East & Africa Market Value Share and BPS Analysis by End-User, 2025 and 2035
  • Figure 66: Middle East & Africa Market Y-o-Y Growth Comparison by End-User, 2025-2035
  • Figure 67: Middle East & Africa Market Attractiveness Analysis by End-User
  • Figure 68: Global Market - Tier Structure Analysis
  • Figure 69: Global Market - Company Share Analysis

Frequently Asked Questions

How big is the cloud it infrastructure hardware market in 2025?

The global cloud it infrastructure hardware market is estimated to be valued at USD 294.4 billion in 2025.

What will be the size of cloud it infrastructure hardware market in 2035?

The market size for the cloud it infrastructure hardware market is projected to reach USD 906.1 billion by 2035.

How much will be the cloud it infrastructure hardware market growth between 2025 and 2035?

The cloud it infrastructure hardware market is expected to grow at a 11.9% CAGR between 2025 and 2035.

What are the key product types in the cloud it infrastructure hardware market?

The key product types in cloud it infrastructure hardware market are server, storage systems and network devices.

Which end-user segment to contribute significant share in the cloud it infrastructure hardware market in 2025?

In terms of end-user, cloud service provider segment to command 54.1% share in the cloud it infrastructure hardware market in 2025.

Explore Similar Insights

Future Market Insights

Cloud IT Infrastructure Hardware Market

Chat With MaRIA

Chat With

MaRIA

Hi There, I am MaRIA, Your Market Research Intelligence Assistant. How may I help you?