Reports
- Global Locations -
Headquarters
Future Market Insights, Inc.
Christiana Corporate, 200
Continental Drive, Suite 401,
Newark, Delaware - 19713,
United States
Americas
Future Market Insights, Inc.
616 Corporate Way, Suite 2-9018,
Valley Cottage, NY 10989, United States
MEA
Future Market Insights
1602-6 Jumeirah Bay X2 Tower, Plot No: JLT-PH2-X2A,
Jumeirah Lakes Towers, Dubai,
United Arab Emirates
Europe
Future Market Insights
3rd Floor, 207 Regent Street,
W1B 3HH London
United Kingdom
Asia Pacific
Future Market Insights
Office No. 401-A, 4th Floor,
VANTAGE 9, S.No. 36/1/1,
Baner, Pune 411045, India
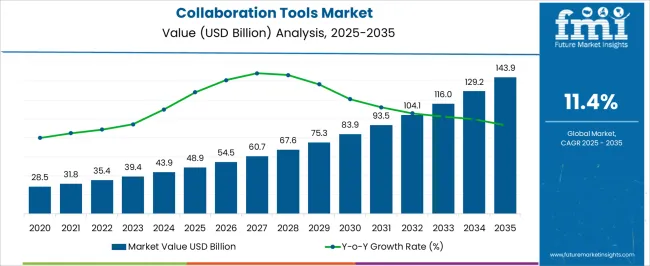
The collaboration tools market size is pegged to reach US$ 39,407.4 million by 2023. It is estimated to reach US$ 116,338.4 million by 2033, meanwhile recording a CAGR of 11.4%.
The growing popularity of remote work methods among a huge population is expected to result in the tremendous growth in the market.
With increasing globalization, there is a greater demand for collaboration tools in the worldwide market. The collaboration tools industry is expected to expand in the coming future as new gadgets and technologies are expected to emerge. Market demand has increased as a result of large business streams from firm units being present across several geographies.
The global collaboration tools market is likely to generate significant revenue in the coming years. Collaboration technologies enable two or more groups, people, or entities to share a single platform, facilitating collaboration. Collaboration can be utilized for both business and leisure, entertainment, or the arts.
Collaboration software, programs, and web portals are examples of widespread business collaboration technologies. These tools have aided firms and entrepreneurs in achieving maximum growth, resilience, and connectivity with other entities. The relevance of information exchange in the modern scenario can be used to measure the importance of collaboration technologies.
These instruments significantly support the transmission and reception of critical information. Owing to these dynamics, the worldwide collaboration tools market is likely to rise at a significant pace.
Report Attribute | Details |
---|---|
Collaboration Tools Market Value (2023) | US$ 39,407.4 million |
Collaboration Tools Market Anticipated Value (2033) | US$ 116,338.4 million |
Collaboration Tools Market Growth Rate (2023 to 2033) | 11.4% CAGR |
Don't pay for what you don't need
Customize your report by selecting specific countries or regions and save 30%!
The factors such as increasing inclination towards digitizing workspace and increasing demand for cloud communication solutions and growing mobile workers are expected to drive the demand for the collaboration tools market.
Advancements in collaboration and interactive technologies have made communication solutions more dynamic and integrated, which enables people to share information via multimedia technology.
Content sharing, digital data streaming, and mobile connectivity solutions are turning meeting rooms into dynamic locations. This makes it possible for people from other countries, states, and continents to be involved in a place for decision-making, problem-solving, and risk-control processes. Workspace digitization is accelerating at a robust pace. Therefore, many collaboration tool vendors are focusing on developing more dynamic solutions to meet the demands of customers. This, in turn, is driving the growth of the collaboration tools market.
Continuous innovation in cloud communication is resulting in greater choice, flexibility, and cost-saving solutions for enterprise communication. By adopting cloud communication solutions, enterprises are benefited from standardized capabilities and total interoperability across different locations of an enterprise.
Nowadays, many enterprises are adopting cloud communication solutions for video and web conferencing to reduce the complexity of implementation and maintenance processes. Thus, the rise in demand for cloud communication solutions is driving the growth of the collaboration tools market.
Conference calls, videos, and other tools have become more popular in the increasingly connected global corporate environment. As a result, the global collaboration tools market is expected to generate substantial revenues in the coming years. Collaboration tools can be used for personal conversations, which has fuelled the growth of the market. In the coming years, the corporate world is also expected to become more and more popular with workflow systems and hyperlinks.
For organizations, virtual reality and augmented reality allow real-time remote collaboration experiences. These technologies are used by businesses to provide location-based information services. QR codes provide users with information about the items and services that a company provides.
Remote teams are becoming more frequent in enterprises. Use of virtual reality and augmented reality technologies can allow employees to collaborate even when they are not physically present in the same location. Augmented reality and virtual reality enable immersive boardroom experiences, tracking body language, supporting avatars, and changing backgrounds, among other things. Users can cooperate on product creation and development in the digital world by utilizing the multiuser features of augmented reality and virtual reality.
RealSense, for example, offers virtual reality devices that may change the background of a live streamer's content to better presentations for everyone.
The collaboration tools market was valued at US$ 35,890.2 million in 2022, with a 9.3% CAGR from 2018 to 2022.
Over the last decade, the collaboration tools industry has seen a considerable increase in demand. The increased use of shared whiteboards, chat systems, decision support tools, and video communication systems across industrial and commercial units is responsible for this significant rate of expansion. Multiplayer video games are another division that has driven the market demand.
Collaboration technologies are essential for ensuring the seamless efficiency of distant work. As a result, all these factors bode well for the expansion of the collaboration tools market, ensuring a historical growth trajectory from 2018 to 2022.
The growing availability and popularity of web-based collaboration tools are expected to pave the road for expansion. Collaboration tools enable smaller firms to increase their worldwide reach, while larger enterprises improve inter-organizational communication. The collaboration tools market is projected to grow profitably as a result of all these advantages.
Strategic collaborations aid in the acceleration of the industry for collaboration technologies. To strengthen their position in the collaboration tools market, the players engage in mergers and acquisitions, collaborations, and growth initiatives. These actions eventually contribute to the expansion of the collaboration tools market's growth rate.
Historical CAGR (2018 to 2022) | 9.3% |
---|---|
Forecast CAGR (2023 to 2033) | 11.4% |
Year | Value |
---|---|
2018 | US$ 25,101.7 million |
2022 | US$ 35,890.2 million |
2023 | US$ 39,407.4 million |
Get the data you need at a Fraction of the cost
Personalize your report by choosing insights you need
and save 40%!
Collaboration Tools Market:
Differentiating Aspects | Collaboration Tools Market |
---|---|
Anticipated CAGR (2023 to 2033) | 11.4% |
Market Valuation (2033) | US$ 116,338.4 million |
Growth Factors | Growing demand to reduce administration and maintenance costs. |
Future Opportunities | Increasing adoption by small and medium enterprise size. |
Market Trends | Several new gadgets and technology emerge in the future. |
Team Collaboration Tools Market:
Differentiating Aspects | Team Collaboration Tools Market |
---|---|
Anticipated CAGR (2023 to 2033) | 9.2% |
Market Valuation (2033) | US$ 64.11 billion |
Growth Factors | Artificial intelligence development and integration with team collaboration technologies are likely to increase demand. |
Future Opportunities | Latest technological advances in team collaboration tools |
Market Trends | Team collaboration technologies are becoming more important as the modern workplace moves away from having a physical location in the future. |
Enterprise Collaboration Tools Market:
Differentiating Aspects | Enterprise Collaboration Tools Market |
---|---|
Anticipated CAGR (2023 to 2033) | 12% |
Market Valuation (2033) | US$ 189.68 billion |
Growth Factors | Rising adoption of wireless devices. |
Future Opportunities | Increased adoption of DevOps cooperation and the SMAC (social, mobile, analytics and cloud) ecosystem in the IT and telecommunications sectors. |
Market Trends | The growing trend of Bring Your Own Device (BYOD) and work-from-home culture is also likely to assist the collaboration software market capture more revenue in the coming years. |
Country | The United States |
---|---|
Projected CAGR (2023 to 2033) | 8.2% |
Market Valuation (2023) | US$ 12.10 billion |
Market Valuation (2033) | US$ 26.6 billion |
Country | The United Kingdom |
---|---|
Projected CAGR (2023 to 2033) | 11.5% |
Market Valuation (2023) | US$ 2.39 million |
Market Valuation (2033) | US$ 7.1 million |
Country | China |
---|---|
Projected CAGR (2023 to 2033) | 11.6% |
Market Valuation (2023) | US$ 2.57 billion |
Market Valuation (2033) | US$ 7.7 million |
Country | Japan |
---|---|
Projected CAGR (2023 to 2033) | 6.5% |
Market Valuation (2023) | US$ 2.56 million |
Market Valuation (2033) | US$ 4.8 million |
Country | India |
---|---|
Projected CAGR (2023 to 2033) | 13.2% |
Market Valuation (2023) | US$ 3.62 billion |
Market Valuation (2033) | US$ 12.5 billion |
Value Shares:
Countries/ Regions | Value Share (2022) |
---|---|
North America | 27.6% |
Europe | 22.3% |
The United States | 16.5% |
Germany | 6.5% |
Japan | 4.3% |
Australia | 2.6% |
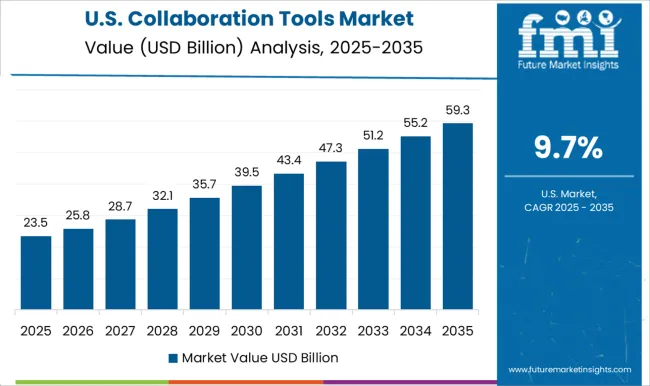
North America is likely to have a sizable market share. In 2022, the region attained 27.6% market share. Within the region, the United States grabbed 16.5% collaboration tools market share in the same year. Rising utilization of collaboration tools with enhanced capabilities is bolstering regional growth. Some advanced features include web conferencing, communication, and coordination tools, and collaboration portals. The increased usage of web conferences among firms can be attributed to the rising need for visual meetings. This also saves organizations’ travel time and expands user comfort. The rising availability of high-quality internet connections is facilitating such digital possibilities.
Few of the collaboration tools market's top players, such as Microsoft Corporation and Slack Technologies Inc., are headquartered in the United States. The region is experiencing technological advancements due to the use of Artificial Intelligence (AI), particularly in collaboration software.
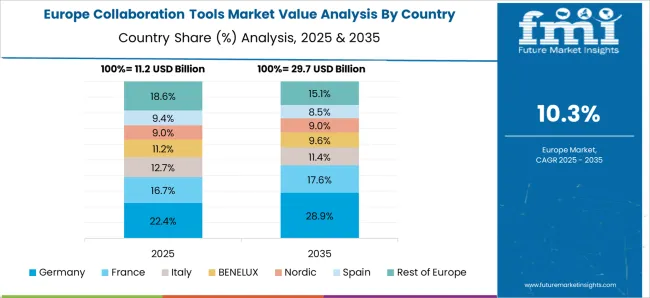
Germany is one of the most developed countries across the European region and one of the most prominent in terms of internet penetration and digital transformation in recent years. For instance, in June 2019, TeamViewer announced that its online meeting tools are now integrated with Zoho CRM, a cloud-based customer relationship management platform.
These tools, which are immediately available on the Zoho Marketplace, were built using a cloud-based platform for integrating online meeting applications with Zoho CRM. Such business development strategies by key players in the country are set to increase the demand for the collaboration tools market.
The demand for collaboration tools is rising in Germany due to the country's intense demand for cloud-based solutions. The country's manufacturing and auto industries are thriving. Owing to the growing demand for significant productivity and efficiency in these industries, manufacturing organizations are more inclined to utilize automated solutions such as automated material handling equipment. Such ingredients are in significant demand in the market of Germany.
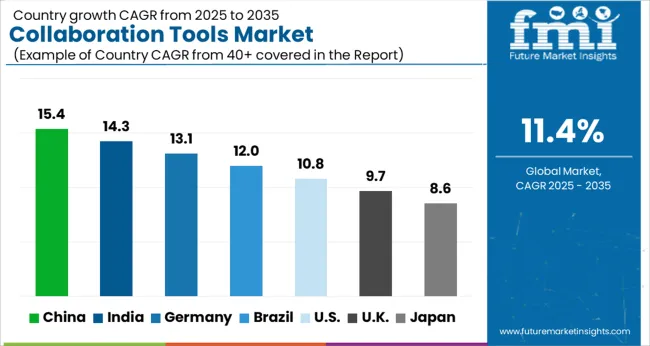
India is anticipated to leap forward at 13.2% CAGR from 2023 to 2033. The growth of India is projected to leave behind all its competitors in the coming years. New launches are being made, taking into consideration the evolving workforce requirements. For instance, in April 2022, Oracle launched Oracle ME, which is a comprehensive employee experience platform. This innovation helps organizations assure employee success and boost employee engagement. Further, it helps business leaders and HR by providing solutions for communication, listening, and productivity. Among the plethora of advantages, its ability to retain talent by creating a more trusted and supported work environment is deemed crucial. Great market potential in India owing to budding businesses is expected to endow India with rapid growth.
China witnesses a continuous development of digitized workspaces. Hence it fuels the demand for remote working solutions within enterprises. The demand for remote solutions has increased rapidly in various verticals and has created potential growth opportunities for the collaboration tools market. For instance, in April 2016, WeCom launched as 1st version of WeChat Work in China. This resulted in many companies shifting to remote work. Therefore, the rising adoption of remote work in China is propelling the demand for collaboration tools.
China is the world's leading vehicle manufacturing market. Consumers in China now have significant disposable income. The country's logistics market is likely to increase gradually in the coming years. Infrastructure improvements, greater domestic consumption, and expanding demand for low-cost third-party logistics providers are all factors contributing to this expansion.
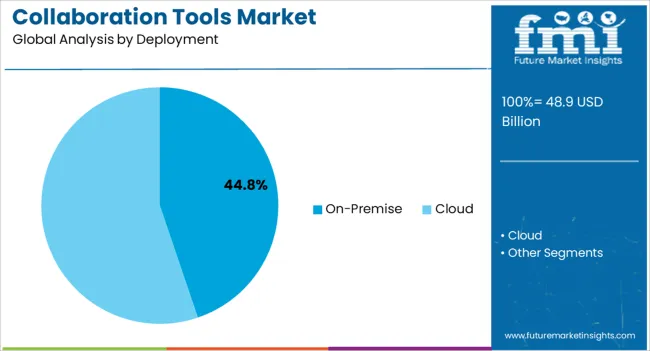
The implementation incorporates both on-premise and cloud components. The cloud segment is expected to increase at a rapid rate throughout the forecast period, with a CAGR of 12.7%. The cloud-based deployment technique may handle a wide range of devices and channels, including computers, cell phones, tablets, social media, and websites. Rising internet usage and smartphone ownership are driving the creation of online content for various social media platforms.
Cloud-based deployment of collaboration tools solutions is growing in popularity due to benefits such as scalability, integration, and usage extension. As a result, organizations install public or private cloud platforms based on their needs and budgets.
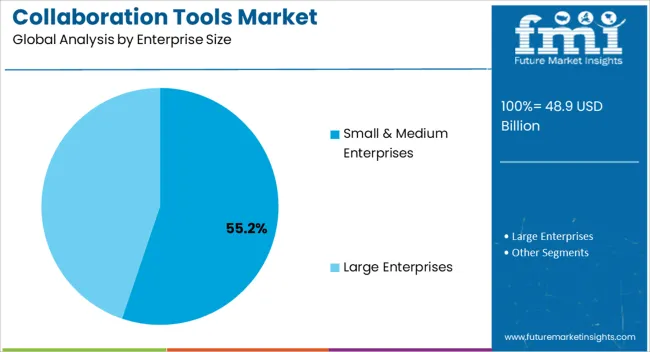
Among the enterprise size, the demand for collaboration tools among the large enterprise-size segment is more. The large enterprise size segment is expected to record a CAGR of 8.9% over the forecast period. However, the small & medium enterprise size segment is estimated to grow almost 2.6X market by 2033.
Unified communication and collaboration give a seamless user experience by integrating multiple technologies and tools such as telephony calling, voice, instant messaging, desktop sharing, video, and audio conferencing, that help people work together more effectively anywhere and on any device. Therefore, the adoption of collaboration tools in large enterprises has shown significant growth in recent years.
Category | Enterprise Size |
---|---|
Top Segment | Large Enterprises |
Market Share | 55.4% |
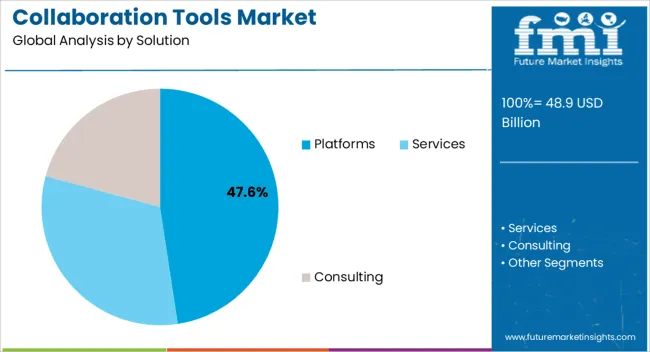
Since the solution, the collaboration platform segment is expected to dominate throughout the forecast period. The market size of the collaboration platform segment is expected to expand up to 2.7X of by 2029. The platform segment is set to register a CAGR of 12.4% from 2023 to 2033.
Collaboration tools include unified messaging, enterprise file sharing & synchronization, and portals & intranet platforms. These help to incorporate text, audio, or video communication and to improve security for data exchanges between enterprise resources. Thus, the rising adoption of collaboration platforms across various industries is set to drive demand during the forecast period.
Category | Solution |
---|---|
Top Segment | Platforms |
Market Share | 56.7% |
Key vendors across the globe are focusing on acquisitions, joint ventures, and investments in enterprise collaboration solutions. This helps the company’s business growth and enables them to maintain their positions in the collaboration tools market. Also, key players are continuously looking for new ways to serve their customers and expand their business by making significant research & development investments.
Attribute | Details |
---|---|
Market Size Value in 2023 | US$ 39,407.4 million |
Market Size Value (2033) | US$ 116,338.4 million |
Market Analysis | US$ billion/million for Value |
Key Region Covered |
|
Key Segments |
|
Key Companies Profiled |
|
Report Coverage | Market Forecast, Company Share Analysis, Competition Intelligence, DROT Analysis, Market Dynamics and Challenges, and Strategic Growth Initiatives |
Customization & Pricing | Available upon Request |
1. Executive Summary | Collaboration Tools Market 1.1. Global Market Outlook 1.2. Demand-side Trends 1.3. Supply-side Trends 1.4. Technology Roadmap Analysis 1.5. Analysis and Recommendations 2. Market Overview 2.1. Market Coverage / Taxonomy 2.2. Market Definition / Scope / Limitations 3. Market Background 3.1. Market Dynamics 3.1.1. Drivers 3.1.2. Restraints 3.1.3. Opportunity 3.1.4. Trends 3.2. Scenario Forecast 3.2.1. Demand in Optimistic Scenario 3.2.2. Demand in Likely Scenario 3.2.3. Demand in Conservative Scenario 3.3. Opportunity Map Analysis 3.4. Investment Feasibility Matrix 3.5. PESTLE and Porter’s Analysis 3.6. Regulatory Landscape 3.6.1. By Key Regions 3.6.2. By Key Countries 3.7. Regional Parent Market Outlook 4. Global Market Analysis 2018 to 2022 and Forecast, 2023 to 2033 4.1. Historical Market Size Value (US$ Million) Analysis, 2018 to 2022 4.2. Current and Future Market Size Value (US$ Million) Projections, 2023 to 2033 4.2.1. Y-o-Y Growth Trend Analysis 4.2.2. Absolute $ Opportunity Analysis 5. Global Market Analysis 2018 to 2022 and Forecast 2023 to 2033, By Solution 5.1. Introduction / Key Findings 5.2. Historical Market Size Value (US$ Million) Analysis By Solution, 2018 to 2022 5.3. Current and Future Market Size Value (US$ Million) Analysis and Forecast By Solution, 2023 to 2033 5.3.1. Platforms 5.3.1.1. Unified Messaging 5.3.1.2. Enterprise File Sharing & Synchronization 5.3.1.3. Portals & Intranet Platforms 5.3.1.4. Project Management Platforms 5.3.1.5. Enterprise Social Networks 5.3.2. Services 5.3.2.1. Integration Service 5.3.2.2. Technical Support 5.3.2.3. Consulting 5.4. Y-o-Y Growth Trend Analysis By Solution, 2018 to 2022 5.5. Absolute $ Opportunity Analysis By Solution, 2023 to 2033 6. Global Market Analysis 2018 to 2022 and Forecast 2023 to 2033, By Deployment 6.1. Introduction / Key Findings 6.2. Historical Market Size Value (US$ Million) Analysis By Deployment, 2018 to 2022 6.3. Current and Future Market Size Value (US$ Million) Analysis and Forecast By Deployment, 2023 to 2033 6.3.1. On-premise 6.3.2. Cloud 6.4. Y-o-Y Growth Trend Analysis By Deployment, 2018 to 2022 6.5. Absolute $ Opportunity Analysis By Deployment, 2023 to 2033 7. Global Market Analysis 2018 to 2022 and Forecast 2023 to 2033, By Enterprise Size 7.1. Introduction / Key Findings 7.2. Historical Market Size Value (US$ Million) Analysis By Enterprise Size, 2018 to 2022 7.3. Current and Future Market Size Value (US$ Million) Analysis and Forecast By Enterprise Size, 2023 to 2033 7.3.1. Small & Medium Enterprises 7.3.2. Large Enterprises 7.4. Y-o-Y Growth Trend Analysis By Enterprise Size, 2018 to 2022 7.5. Absolute $ Opportunity Analysis By Enterprise Size, 2023 to 2033 8. Global Market Analysis 2018 to 2022 and Forecast 2023 to 2033, By Industry 8.1. Introduction / Key Findings 8.2. Historical Market Size Value (US$ Million) Analysis By Industry, 2018 to 2022 8.3. Current and Future Market Size Value (US$ Million) Analysis and Forecast By Industry, 2023 to 2033 8.3.1. BFSI 8.3.2. IT & Telecom 8.3.3. Healthcare 8.3.4. Travel & Hospitality 8.3.5. Retail & e-Commerce 8.3.6. Manufacturing 8.3.7. Others 8.4. Y-o-Y Growth Trend Analysis By Industry, 2018 to 2022 8.5. Absolute $ Opportunity Analysis By Industry, 2023 to 2033 9. Global Market Analysis 2018 to 2022 and Forecast 2023 to 2033, By Region 9.1. Introduction 9.2. Historical Market Size Value (US$ Million) Analysis By Region, 2018 to 2022 9.3. Current Market Size Value (US$ Million) Analysis and Forecast By Region, 2023 to 2033 9.3.1. North America 9.3.2. Latin America 9.3.3. Europe 9.3.4. South Asia 9.3.5. East Asia 9.3.6. Oceania 9.3.7. MEA 9.4. Market Attractiveness Analysis By Region 10. North America Market Analysis 2018 to 2022 and Forecast 2023 to 2033, By Country 10.1. Historical Market Size Value (US$ Million) Trend Analysis By Market Taxonomy, 2018 to 2022 10.2. Market Size Value (US$ Million) Forecast By Market Taxonomy, 2023 to 2033 10.2.1. By Country 10.2.1.1. The USA 10.2.1.2. Canada 10.2.2. By Solution 10.2.3. By Deployment 10.2.4. By Enterprise Size 10.2.5. By Industry 10.3. Market Attractiveness Analysis 10.3.1. By Country 10.3.2. By Solution 10.3.3. By Deployment 10.3.4. By Enterprise Size 10.3.5. By Industry 10.4. Key Takeaways 11. Latin America Market Analysis 2018 to 2022 and Forecast 2023 to 2033, By Country 11.1. Historical Market Size Value (US$ Million) Trend Analysis By Market Taxonomy, 2018 to 2022 11.2. Market Size Value (US$ Million) Forecast By Market Taxonomy, 2023 to 2033 11.2.1. By Country 11.2.1.1. Brazil 11.2.1.2. Mexico 11.2.1.3. Rest of Latin America 11.2.2. By Solution 11.2.3. By Deployment 11.2.4. By Enterprise Size 11.2.5. By Industry 11.3. Market Attractiveness Analysis 11.3.1. By Country 11.3.2. By Solution 11.3.3. By Deployment 11.3.4. By Enterprise Size 11.3.5. By Industry 11.4. Key Takeaways 12. Europe Market Analysis 2018 to 2022 and Forecast 2023 to 2033, By Country 12.1. Historical Market Size Value (US$ Million) Trend Analysis By Market Taxonomy, 2018 to 2022 12.2. Market Size Value (US$ Million) Forecast By Market Taxonomy, 2023 to 2033 12.2.1. By Country 12.2.1.1. Germany 12.2.1.2. United Kingdom 12.2.1.3. France 12.2.1.4. Spain 12.2.1.5. Italy 12.2.1.6. Rest of Europe 12.2.2. By Solution 12.2.3. By Deployment 12.2.4. By Enterprise Size 12.2.5. By Industry 12.3. Market Attractiveness Analysis 12.3.1. By Country 12.3.2. By Solution 12.3.3. By Deployment 12.3.4. By Enterprise Size 12.3.5. By Industry 12.4. Key Takeaways 13. South Asia Market Analysis 2018 to 2022 and Forecast 2023 to 2033, By Country 13.1. Historical Market Size Value (US$ Million) Trend Analysis By Market Taxonomy, 2018 to 2022 13.2. Market Size Value (US$ Million) Forecast By Market Taxonomy, 2023 to 2033 13.2.1. By Country 13.2.1.1. India 13.2.1.2. Malaysia 13.2.1.3. Singapore 13.2.1.4. Thailand 13.2.1.5. Rest of South Asia 13.2.2. By Solution 13.2.3. By Deployment 13.2.4. By Enterprise Size 13.2.5. By Industry 13.3. Market Attractiveness Analysis 13.3.1. By Country 13.3.2. By Solution 13.3.3. By Deployment 13.3.4. By Enterprise Size 13.3.5. By Industry 13.4. Key Takeaways 14. East Asia Market Analysis 2018 to 2022 and Forecast 2023 to 2033, By Country 14.1. Historical Market Size Value (US$ Million) Trend Analysis By Market Taxonomy, 2018 to 2022 14.2. Market Size Value (US$ Million) Forecast By Market Taxonomy, 2023 to 2033 14.2.1. By Country 14.2.1.1. China 14.2.1.2. Japan 14.2.1.3. South Korea 14.2.2. By Solution 14.2.3. By Deployment 14.2.4. By Enterprise Size 14.2.5. By Industry 14.3. Market Attractiveness Analysis 14.3.1. By Country 14.3.2. By Solution 14.3.3. By Deployment 14.3.4. By Enterprise Size 14.3.5. By Industry 14.4. Key Takeaways 15. Oceania Market Analysis 2018 to 2022 and Forecast 2023 to 2033, By Country 15.1. Historical Market Size Value (US$ Million) Trend Analysis By Market Taxonomy, 2018 to 2022 15.2. Market Size Value (US$ Million) Forecast By Market Taxonomy, 2023 to 2033 15.2.1. By Country 15.2.1.1. Australia 15.2.1.2. New Zealand 15.2.2. By Solution 15.2.3. By Deployment 15.2.4. By Enterprise Size 15.2.5. By Industry 15.3. Market Attractiveness Analysis 15.3.1. By Country 15.3.2. By Solution 15.3.3. By Deployment 15.3.4. By Enterprise Size 15.3.5. By Industry 15.4. Key Takeaways 16. MEA Market Analysis 2018 to 2022 and Forecast 2023 to 2033, By Country 16.1. Historical Market Size Value (US$ Million) Trend Analysis By Market Taxonomy, 2018 to 2022 16.2. Market Size Value (US$ Million) Forecast By Market Taxonomy, 2023 to 2033 16.2.1. By Country 16.2.1.1. GCC Countries 16.2.1.2. South Africa 16.2.1.3. Israel 16.2.1.4. Rest of MEA 16.2.2. By Solution 16.2.3. By Deployment 16.2.4. By Enterprise Size 16.2.5. By Industry 16.3. Market Attractiveness Analysis 16.3.1. By Country 16.3.2. By Solution 16.3.3. By Deployment 16.3.4. By Enterprise Size 16.3.5. By Industry 16.4. Key Takeaways 17. Key Countries Market Analysis 17.1. USA 17.1.1. Pricing Analysis 17.1.2. Market Share Analysis, 2022 17.1.2.1. By Solution 17.1.2.2. By Deployment 17.1.2.3. By Enterprise Size 17.1.2.4. By Industry 17.2. Canada 17.2.1. Pricing Analysis 17.2.2. Market Share Analysis, 2022 17.2.2.1. By Solution 17.2.2.2. By Deployment 17.2.2.3. By Enterprise Size 17.2.2.4. By Industry 17.3. Brazil 17.3.1. Pricing Analysis 17.3.2. Market Share Analysis, 2022 17.3.2.1. By Solution 17.3.2.2. By Deployment 17.3.2.3. By Enterprise Size 17.3.2.4. By Industry 17.4. Mexico 17.4.1. Pricing Analysis 17.4.2. Market Share Analysis, 2022 17.4.2.1. By Solution 17.4.2.2. By Deployment 17.4.2.3. By Enterprise Size 17.4.2.4. By Industry 17.5. Germany 17.5.1. Pricing Analysis 17.5.2. Market Share Analysis, 2022 17.5.2.1. By Solution 17.5.2.2. By Deployment 17.5.2.3. By Enterprise Size 17.5.2.4. By Industry 17.6. United Kingdom 17.6.1. Pricing Analysis 17.6.2. Market Share Analysis, 2022 17.6.2.1. By Solution 17.6.2.2. By Deployment 17.6.2.3. By Enterprise Size 17.6.2.4. By Industry 17.7. France 17.7.1. Pricing Analysis 17.7.2. Market Share Analysis, 2022 17.7.2.1. By Solution 17.7.2.2. By Deployment 17.7.2.3. By Enterprise Size 17.7.2.4. By Industry 17.8. Spain 17.8.1. Pricing Analysis 17.8.2. Market Share Analysis, 2022 17.8.2.1. By Solution 17.8.2.2. By Deployment 17.8.2.3. By Enterprise Size 17.8.2.4. By Industry 17.9. Italy 17.9.1. Pricing Analysis 17.9.2. Market Share Analysis, 2022 17.9.2.1. By Solution 17.9.2.2. By Deployment 17.9.2.3. By Enterprise Size 17.9.2.4. By Industry 17.10. India 17.10.1. Pricing Analysis 17.10.2. Market Share Analysis, 2022 17.10.2.1. By Solution 17.10.2.2. By Deployment 17.10.2.3. By Enterprise Size 17.10.2.4. By Industry 17.11. Malaysia 17.11.1. Pricing Analysis 17.11.2. Market Share Analysis, 2022 17.11.2.1. By Solution 17.11.2.2. By Deployment 17.11.2.3. By Enterprise Size 17.11.2.4. By Industry 17.12. Singapore 17.12.1. Pricing Analysis 17.12.2. Market Share Analysis, 2022 17.12.2.1. By Solution 17.12.2.2. By Deployment 17.12.2.3. By Enterprise Size 17.12.2.4. By Industry 17.13. Thailand 17.13.1. Pricing Analysis 17.13.2. Market Share Analysis, 2022 17.13.2.1. By Solution 17.13.2.2. By Deployment 17.13.2.3. By Enterprise Size 17.13.2.4. By Industry 17.14. China 17.14.1. Pricing Analysis 17.14.2. Market Share Analysis, 2022 17.14.2.1. By Solution 17.14.2.2. By Deployment 17.14.2.3. By Enterprise Size 17.14.2.4. By Industry 17.15. Japan 17.15.1. Pricing Analysis 17.15.2. Market Share Analysis, 2022 17.15.2.1. By Solution 17.15.2.2. By Deployment 17.15.2.3. By Enterprise Size 17.15.2.4. By Industry 17.16. South Korea 17.16.1. Pricing Analysis 17.16.2. Market Share Analysis, 2022 17.16.2.1. By Solution 17.16.2.2. By Deployment 17.16.2.3. By Enterprise Size 17.16.2.4. By Industry 17.17. Australia 17.17.1. Pricing Analysis 17.17.2. Market Share Analysis, 2022 17.17.2.1. By Solution 17.17.2.2. By Deployment 17.17.2.3. By Enterprise Size 17.17.2.4. By Industry 17.18. New Zealand 17.18.1. Pricing Analysis 17.18.2. Market Share Analysis, 2022 17.18.2.1. By Solution 17.18.2.2. By Deployment 17.18.2.3. By Enterprise Size 17.18.2.4. By Industry 17.19. GCC Countries 17.19.1. Pricing Analysis 17.19.2. Market Share Analysis, 2022 17.19.2.1. By Solution 17.19.2.2. By Deployment 17.19.2.3. By Enterprise Size 17.19.2.4. By Industry 17.20. South Africa 17.20.1. Pricing Analysis 17.20.2. Market Share Analysis, 2022 17.20.2.1. By Solution 17.20.2.2. By Deployment 17.20.2.3. By Enterprise Size 17.20.2.4. By Industry 17.21. Israel 17.21.1. Pricing Analysis 17.21.2. Market Share Analysis, 2022 17.21.2.1. By Solution 17.21.2.2. By Deployment 17.21.2.3. By Enterprise Size 17.21.2.4. By Industry 18. Market Structure Analysis 18.1. Competition Dashboard 18.2. Competition Benchmarking 18.3. Market Share Analysis of Top Players 18.3.1. By Regional 18.3.2. By Solution 18.3.3. By Deployment 18.3.4. By Enterprise Size 18.3.5. By Industry 19. Competition Analysis 19.1. Competition Deep Dive 19.1.1. Google LLC 19.1.1.1. Overview 19.1.1.2. Product Portfolio 19.1.1.3. Profitability by Market Segments 19.1.1.4. Sales Footprint 19.1.1.5. Strategy Overview 19.1.1.5.1. Marketing Strategy 19.1.2. IBM Corporation 19.1.2.1. Overview 19.1.2.2. Product Portfolio 19.1.2.3. Profitability by Market Segments 19.1.2.4. Sales Footprint 19.1.2.5. Strategy Overview 19.1.2.5.1. Marketing Strategy 19.1.3. Microsoft Corporation 19.1.3.1. Overview 19.1.3.2. Product Portfolio 19.1.3.3. Profitability by Market Segments 19.1.3.4. Sales Footprint 19.1.3.5. Strategy Overview 19.1.3.5.1. Marketing Strategy 19.1.4. Cisco Systems, Inc. 19.1.4.1. Overview 19.1.4.2. Product Portfolio 19.1.4.3. Profitability by Market Segments 19.1.4.4. Sales Footprint 19.1.4.5. Strategy Overview 19.1.4.5.1. Marketing Strategy 19.1.5. Dropbox 19.1.5.1. Overview 19.1.5.2. Product Portfolio 19.1.5.3. Profitability by Market Segments 19.1.5.4. Sales Footprint 19.1.5.5. Strategy Overview 19.1.5.5.1. Marketing Strategy 19.1.6. Oracle Corporation 19.1.6.1. Overview 19.1.6.2. Product Portfolio 19.1.6.3. Profitability by Market Segments 19.1.6.4. Sales Footprint 19.1.6.5. Strategy Overview 19.1.6.5.1. Marketing Strategy 19.1.7. Smartsheet Inc. 19.1.7.1. Overview 19.1.7.2. Product Portfolio 19.1.7.3. Profitability by Market Segments 19.1.7.4. Sales Footprint 19.1.7.5. Strategy Overview 19.1.7.5.1. Marketing Strategy 19.1.8. Zoho Corporation Pvt. Ltd. 19.1.8.1. Overview 19.1.8.2. Product Portfolio 19.1.8.3. Profitability by Market Segments 19.1.8.4. Sales Footprint 19.1.8.5. Strategy Overview 19.1.8.5.1. Marketing Strategy 19.1.9. Hootsuite Inc. 19.1.9.1. Overview 19.1.9.2. Product Portfolio 19.1.9.3. Profitability by Market Segments 19.1.9.4. Sales Footprint 19.1.9.5. Strategy Overview 19.1.9.5.1. Marketing Strategy 19.1.10. Nulab Inc. 19.1.10.1. Overview 19.1.10.2. Product Portfolio 19.1.10.3. Profitability by Market Segments 19.1.10.4. Sales Footprint 19.1.10.5. Strategy Overview 19.1.10.5.1. Marketing Strategy 19.1.11. Diligent Corporation 19.1.11.1. Overview 19.1.11.2. Product Portfolio 19.1.11.3. Profitability by Market Segments 19.1.11.4. Sales Footprint 19.1.11.5. Strategy Overview 19.1.11.5.1. Marketing Strategy 20. Assumptions & Acronyms Used 21. Research Methodology
Don't pay for what you don't need
Customize your report by selecting specific countries or regions and save 30%!
Table 1: Global Market Value (US$ Million) Forecast by Region, 2018 to 2033 Table 2: Global Market Value (US$ Million) Forecast by Solution, 2018 to 2033 Table 3: Global Market Value (US$ Million) Forecast by Deployment, 2018 to 2033 Table 4: Global Market Value (US$ Million) Forecast by Enterprise Size, 2018 to 2033 Table 5: Global Market Value (US$ Million) Forecast by Industry, 2018 to 2033 Table 6: North America Market Value (US$ Million) Forecast by Country, 2018 to 2033 Table 7: North America Market Value (US$ Million) Forecast by Solution, 2018 to 2033 Table 8: North America Market Value (US$ Million) Forecast by Deployment, 2018 to 2033 Table 9: North America Market Value (US$ Million) Forecast by Enterprise Size, 2018 to 2033 Table 10: North America Market Value (US$ Million) Forecast by Industry, 2018 to 2033 Table 11: Latin America Market Value (US$ Million) Forecast by Country, 2018 to 2033 Table 12: Latin America Market Value (US$ Million) Forecast by Solution, 2018 to 2033 Table 13: Latin America Market Value (US$ Million) Forecast by Deployment, 2018 to 2033 Table 14: Latin America Market Value (US$ Million) Forecast by Enterprise Size, 2018 to 2033 Table 15: Latin America Market Value (US$ Million) Forecast by Industry, 2018 to 2033 Table 16: Europe Market Value (US$ Million) Forecast by Country, 2018 to 2033 Table 17: Europe Market Value (US$ Million) Forecast by Solution, 2018 to 2033 Table 18: Europe Market Value (US$ Million) Forecast by Deployment, 2018 to 2033 Table 19: Europe Market Value (US$ Million) Forecast by Enterprise Size, 2018 to 2033 Table 20: Europe Market Value (US$ Million) Forecast by Industry, 2018 to 2033 Table 21: South Asia Market Value (US$ Million) Forecast by Country, 2018 to 2033 Table 22: South Asia Market Value (US$ Million) Forecast by Solution, 2018 to 2033 Table 23: South Asia Market Value (US$ Million) Forecast by Deployment, 2018 to 2033 Table 24: South Asia Market Value (US$ Million) Forecast by Enterprise Size, 2018 to 2033 Table 25: South Asia Market Value (US$ Million) Forecast by Industry, 2018 to 2033 Table 26: East Asia Market Value (US$ Million) Forecast by Country, 2018 to 2033 Table 27: East Asia Market Value (US$ Million) Forecast by Solution, 2018 to 2033 Table 28: East Asia Market Value (US$ Million) Forecast by Deployment, 2018 to 2033 Table 29: East Asia Market Value (US$ Million) Forecast by Enterprise Size, 2018 to 2033 Table 30: East Asia Market Value (US$ Million) Forecast by Industry, 2018 to 2033 Table 31: Oceania Market Value (US$ Million) Forecast by Country, 2018 to 2033 Table 32: Oceania Market Value (US$ Million) Forecast by Solution, 2018 to 2033 Table 33: Oceania Market Value (US$ Million) Forecast by Deployment, 2018 to 2033 Table 34: Oceania Market Value (US$ Million) Forecast by Enterprise Size, 2018 to 2033 Table 35: Oceania Market Value (US$ Million) Forecast by Industry, 2018 to 2033 Table 36: MEA Market Value (US$ Million) Forecast by Country, 2018 to 2033 Table 37: MEA Market Value (US$ Million) Forecast by Solution, 2018 to 2033 Table 38: MEA Market Value (US$ Million) Forecast by Deployment, 2018 to 2033 Table 39: MEA Market Value (US$ Million) Forecast by Enterprise Size, 2018 to 2033 Table 40: MEA Market Value (US$ Million) Forecast by Industry, 2018 to 2033
Figure 1: Global Market Value (US$ Million) by Solution, 2023 to 2033 Figure 2: Global Market Value (US$ Million) by Deployment, 2023 to 2033 Figure 3: Global Market Value (US$ Million) by Enterprise Size, 2023 to 2033 Figure 4: Global Market Value (US$ Million) by Industry, 2023 to 2033 Figure 5: Global Market Value (US$ Million) by Region, 2023 to 2033 Figure 6: Global Market Value (US$ Million) Analysis by Region, 2018 to 2033 Figure 7: Global Market Value Share (%) and BPS Analysis by Region, 2023 to 2033 Figure 8: Global Market Y-o-Y Growth (%) Projections by Region, 2023 to 2033 Figure 9: Global Market Value (US$ Million) Analysis by Solution, 2018 to 2033 Figure 10: Global Market Value Share (%) and BPS Analysis by Solution, 2023 to 2033 Figure 11: Global Market Y-o-Y Growth (%) Projections by Solution, 2023 to 2033 Figure 12: Global Market Value (US$ Million) Analysis by Deployment, 2018 to 2033 Figure 13: Global Market Value Share (%) and BPS Analysis by Deployment, 2023 to 2033 Figure 14: Global Market Y-o-Y Growth (%) Projections by Deployment, 2023 to 2033 Figure 15: Global Market Value (US$ Million) Analysis by Enterprise Size, 2018 to 2033 Figure 16: Global Market Value Share (%) and BPS Analysis by Enterprise Size, 2023 to 2033 Figure 17: Global Market Y-o-Y Growth (%) Projections by Enterprise Size, 2023 to 2033 Figure 18: Global Market Value (US$ Million) Analysis by Industry, 2018 to 2033 Figure 19: Global Market Value Share (%) and BPS Analysis by Industry, 2023 to 2033 Figure 20: Global Market Y-o-Y Growth (%) Projections by Industry, 2023 to 2033 Figure 21: Global Market Attractiveness by Solution, 2023 to 2033 Figure 22: Global Market Attractiveness by Deployment, 2023 to 2033 Figure 23: Global Market Attractiveness by Enterprise Size, 2023 to 2033 Figure 24: Global Market Attractiveness by Industry, 2023 to 2033 Figure 25: Global Market Attractiveness by Region, 2023 to 2033 Figure 26: North America Market Value (US$ Million) by Solution, 2023 to 2033 Figure 27: North America Market Value (US$ Million) by Deployment, 2023 to 2033 Figure 28: North America Market Value (US$ Million) by Enterprise Size, 2023 to 2033 Figure 29: North America Market Value (US$ Million) by Industry, 2023 to 2033 Figure 30: North America Market Value (US$ Million) by Country, 2023 to 2033 Figure 31: North America Market Value (US$ Million) Analysis by Country, 2018 to 2033 Figure 32: North America Market Value Share (%) and BPS Analysis by Country, 2023 to 2033 Figure 33: North America Market Y-o-Y Growth (%) Projections by Country, 2023 to 2033 Figure 34: North America Market Value (US$ Million) Analysis by Solution, 2018 to 2033 Figure 35: North America Market Value Share (%) and BPS Analysis by Solution, 2023 to 2033 Figure 36: North America Market Y-o-Y Growth (%) Projections by Solution, 2023 to 2033 Figure 37: North America Market Value (US$ Million) Analysis by Deployment, 2018 to 2033 Figure 38: North America Market Value Share (%) and BPS Analysis by Deployment, 2023 to 2033 Figure 39: North America Market Y-o-Y Growth (%) Projections by Deployment, 2023 to 2033 Figure 40: North America Market Value (US$ Million) Analysis by Enterprise Size, 2018 to 2033 Figure 41: North America Market Value Share (%) and BPS Analysis by Enterprise Size, 2023 to 2033 Figure 42: North America Market Y-o-Y Growth (%) Projections by Enterprise Size, 2023 to 2033 Figure 43: North America Market Value (US$ Million) Analysis by Industry, 2018 to 2033 Figure 44: North America Market Value Share (%) and BPS Analysis by Industry, 2023 to 2033 Figure 45: North America Market Y-o-Y Growth (%) Projections by Industry, 2023 to 2033 Figure 46: North America Market Attractiveness by Solution, 2023 to 2033 Figure 47: North America Market Attractiveness by Deployment, 2023 to 2033 Figure 48: North America Market Attractiveness by Enterprise Size, 2023 to 2033 Figure 49: North America Market Attractiveness by Industry, 2023 to 2033 Figure 50: North America Market Attractiveness by Country, 2023 to 2033 Figure 51: Latin America Market Value (US$ Million) by Solution, 2023 to 2033 Figure 52: Latin America Market Value (US$ Million) by Deployment, 2023 to 2033 Figure 53: Latin America Market Value (US$ Million) by Enterprise Size, 2023 to 2033 Figure 54: Latin America Market Value (US$ Million) by Industry, 2023 to 2033 Figure 55: Latin America Market Value (US$ Million) by Country, 2023 to 2033 Figure 56: Latin America Market Value (US$ Million) Analysis by Country, 2018 to 2033 Figure 57: Latin America Market Value Share (%) and BPS Analysis by Country, 2023 to 2033 Figure 58: Latin America Market Y-o-Y Growth (%) Projections by Country, 2023 to 2033 Figure 59: Latin America Market Value (US$ Million) Analysis by Solution, 2018 to 2033 Figure 60: Latin America Market Value Share (%) and BPS Analysis by Solution, 2023 to 2033 Figure 61: Latin America Market Y-o-Y Growth (%) Projections by Solution, 2023 to 2033 Figure 62: Latin America Market Value (US$ Million) Analysis by Deployment, 2018 to 2033 Figure 63: Latin America Market Value Share (%) and BPS Analysis by Deployment, 2023 to 2033 Figure 64: Latin America Market Y-o-Y Growth (%) Projections by Deployment, 2023 to 2033 Figure 65: Latin America Market Value (US$ Million) Analysis by Enterprise Size, 2018 to 2033 Figure 66: Latin America Market Value Share (%) and BPS Analysis by Enterprise Size, 2023 to 2033 Figure 67: Latin America Market Y-o-Y Growth (%) Projections by Enterprise Size, 2023 to 2033 Figure 68: Latin America Market Value (US$ Million) Analysis by Industry, 2018 to 2033 Figure 69: Latin America Market Value Share (%) and BPS Analysis by Industry, 2023 to 2033 Figure 70: Latin America Market Y-o-Y Growth (%) Projections by Industry, 2023 to 2033 Figure 71: Latin America Market Attractiveness by Solution, 2023 to 2033 Figure 72: Latin America Market Attractiveness by Deployment, 2023 to 2033 Figure 73: Latin America Market Attractiveness by Enterprise Size, 2023 to 2033 Figure 74: Latin America Market Attractiveness by Industry, 2023 to 2033 Figure 75: Latin America Market Attractiveness by Country, 2023 to 2033 Figure 76: Europe Market Value (US$ Million) by Solution, 2023 to 2033 Figure 77: Europe Market Value (US$ Million) by Deployment, 2023 to 2033 Figure 78: Europe Market Value (US$ Million) by Enterprise Size, 2023 to 2033 Figure 79: Europe Market Value (US$ Million) by Industry, 2023 to 2033 Figure 80: Europe Market Value (US$ Million) by Country, 2023 to 2033 Figure 81: Europe Market Value (US$ Million) Analysis by Country, 2018 to 2033 Figure 82: Europe Market Value Share (%) and BPS Analysis by Country, 2023 to 2033 Figure 83: Europe Market Y-o-Y Growth (%) Projections by Country, 2023 to 2033 Figure 84: Europe Market Value (US$ Million) Analysis by Solution, 2018 to 2033 Figure 85: Europe Market Value Share (%) and BPS Analysis by Solution, 2023 to 2033 Figure 86: Europe Market Y-o-Y Growth (%) Projections by Solution, 2023 to 2033 Figure 87: Europe Market Value (US$ Million) Analysis by Deployment, 2018 to 2033 Figure 88: Europe Market Value Share (%) and BPS Analysis by Deployment, 2023 to 2033 Figure 89: Europe Market Y-o-Y Growth (%) Projections by Deployment, 2023 to 2033 Figure 90: Europe Market Value (US$ Million) Analysis by Enterprise Size, 2018 to 2033 Figure 91: Europe Market Value Share (%) and BPS Analysis by Enterprise Size, 2023 to 2033 Figure 92: Europe Market Y-o-Y Growth (%) Projections by Enterprise Size, 2023 to 2033 Figure 93: Europe Market Value (US$ Million) Analysis by Industry, 2018 to 2033 Figure 94: Europe Market Value Share (%) and BPS Analysis by Industry, 2023 to 2033 Figure 95: Europe Market Y-o-Y Growth (%) Projections by Industry, 2023 to 2033 Figure 96: Europe Market Attractiveness by Solution, 2023 to 2033 Figure 97: Europe Market Attractiveness by Deployment, 2023 to 2033 Figure 98: Europe Market Attractiveness by Enterprise Size, 2023 to 2033 Figure 99: Europe Market Attractiveness by Industry, 2023 to 2033 Figure 100: Europe Market Attractiveness by Country, 2023 to 2033 Figure 101: South Asia Market Value (US$ Million) by Solution, 2023 to 2033 Figure 102: South Asia Market Value (US$ Million) by Deployment, 2023 to 2033 Figure 103: South Asia Market Value (US$ Million) by Enterprise Size, 2023 to 2033 Figure 104: South Asia Market Value (US$ Million) by Industry, 2023 to 2033 Figure 105: South Asia Market Value (US$ Million) by Country, 2023 to 2033 Figure 106: South Asia Market Value (US$ Million) Analysis by Country, 2018 to 2033 Figure 107: South Asia Market Value Share (%) and BPS Analysis by Country, 2023 to 2033 Figure 108: South Asia Market Y-o-Y Growth (%) Projections by Country, 2023 to 2033 Figure 109: South Asia Market Value (US$ Million) Analysis by Solution, 2018 to 2033 Figure 110: South Asia Market Value Share (%) and BPS Analysis by Solution, 2023 to 2033 Figure 111: South Asia Market Y-o-Y Growth (%) Projections by Solution, 2023 to 2033 Figure 112: South Asia Market Value (US$ Million) Analysis by Deployment, 2018 to 2033 Figure 113: South Asia Market Value Share (%) and BPS Analysis by Deployment, 2023 to 2033 Figure 114: South Asia Market Y-o-Y Growth (%) Projections by Deployment, 2023 to 2033 Figure 115: South Asia Market Value (US$ Million) Analysis by Enterprise Size, 2018 to 2033 Figure 116: South Asia Market Value Share (%) and BPS Analysis by Enterprise Size, 2023 to 2033 Figure 117: South Asia Market Y-o-Y Growth (%) Projections by Enterprise Size, 2023 to 2033 Figure 118: South Asia Market Value (US$ Million) Analysis by Industry, 2018 to 2033 Figure 119: South Asia Market Value Share (%) and BPS Analysis by Industry, 2023 to 2033 Figure 120: South Asia Market Y-o-Y Growth (%) Projections by Industry, 2023 to 2033 Figure 121: South Asia Market Attractiveness by Solution, 2023 to 2033 Figure 122: South Asia Market Attractiveness by Deployment, 2023 to 2033 Figure 123: South Asia Market Attractiveness by Enterprise Size, 2023 to 2033 Figure 124: South Asia Market Attractiveness by Industry, 2023 to 2033 Figure 125: South Asia Market Attractiveness by Country, 2023 to 2033 Figure 126: East Asia Market Value (US$ Million) by Solution, 2023 to 2033 Figure 127: East Asia Market Value (US$ Million) by Deployment, 2023 to 2033 Figure 128: East Asia Market Value (US$ Million) by Enterprise Size, 2023 to 2033 Figure 129: East Asia Market Value (US$ Million) by Industry, 2023 to 2033 Figure 130: East Asia Market Value (US$ Million) by Country, 2023 to 2033 Figure 131: East Asia Market Value (US$ Million) Analysis by Country, 2018 to 2033 Figure 132: East Asia Market Value Share (%) and BPS Analysis by Country, 2023 to 2033 Figure 133: East Asia Market Y-o-Y Growth (%) Projections by Country, 2023 to 2033 Figure 134: East Asia Market Value (US$ Million) Analysis by Solution, 2018 to 2033 Figure 135: East Asia Market Value Share (%) and BPS Analysis by Solution, 2023 to 2033 Figure 136: East Asia Market Y-o-Y Growth (%) Projections by Solution, 2023 to 2033 Figure 137: East Asia Market Value (US$ Million) Analysis by Deployment, 2018 to 2033 Figure 138: East Asia Market Value Share (%) and BPS Analysis by Deployment, 2023 to 2033 Figure 139: East Asia Market Y-o-Y Growth (%) Projections by Deployment, 2023 to 2033 Figure 140: East Asia Market Value (US$ Million) Analysis by Enterprise Size, 2018 to 2033 Figure 141: East Asia Market Value Share (%) and BPS Analysis by Enterprise Size, 2023 to 2033 Figure 142: East Asia Market Y-o-Y Growth (%) Projections by Enterprise Size, 2023 to 2033 Figure 143: East Asia Market Value (US$ Million) Analysis by Industry, 2018 to 2033 Figure 144: East Asia Market Value Share (%) and BPS Analysis by Industry, 2023 to 2033 Figure 145: East Asia Market Y-o-Y Growth (%) Projections by Industry, 2023 to 2033 Figure 146: East Asia Market Attractiveness by Solution, 2023 to 2033 Figure 147: East Asia Market Attractiveness by Deployment, 2023 to 2033 Figure 148: East Asia Market Attractiveness by Enterprise Size, 2023 to 2033 Figure 149: East Asia Market Attractiveness by Industry, 2023 to 2033 Figure 150: East Asia Market Attractiveness by Country, 2023 to 2033 Figure 151: Oceania Market Value (US$ Million) by Solution, 2023 to 2033 Figure 152: Oceania Market Value (US$ Million) by Deployment, 2023 to 2033 Figure 153: Oceania Market Value (US$ Million) by Enterprise Size, 2023 to 2033 Figure 154: Oceania Market Value (US$ Million) by Industry, 2023 to 2033 Figure 155: Oceania Market Value (US$ Million) by Country, 2023 to 2033 Figure 156: Oceania Market Value (US$ Million) Analysis by Country, 2018 to 2033 Figure 157: Oceania Market Value Share (%) and BPS Analysis by Country, 2023 to 2033 Figure 158: Oceania Market Y-o-Y Growth (%) Projections by Country, 2023 to 2033 Figure 159: Oceania Market Value (US$ Million) Analysis by Solution, 2018 to 2033 Figure 160: Oceania Market Value Share (%) and BPS Analysis by Solution, 2023 to 2033 Figure 161: Oceania Market Y-o-Y Growth (%) Projections by Solution, 2023 to 2033 Figure 162: Oceania Market Value (US$ Million) Analysis by Deployment, 2018 to 2033 Figure 163: Oceania Market Value Share (%) and BPS Analysis by Deployment, 2023 to 2033 Figure 164: Oceania Market Y-o-Y Growth (%) Projections by Deployment, 2023 to 2033 Figure 165: Oceania Market Value (US$ Million) Analysis by Enterprise Size, 2018 to 2033 Figure 166: Oceania Market Value Share (%) and BPS Analysis by Enterprise Size, 2023 to 2033 Figure 167: Oceania Market Y-o-Y Growth (%) Projections by Enterprise Size, 2023 to 2033 Figure 168: Oceania Market Value (US$ Million) Analysis by Industry, 2018 to 2033 Figure 169: Oceania Market Value Share (%) and BPS Analysis by Industry, 2023 to 2033 Figure 170: Oceania Market Y-o-Y Growth (%) Projections by Industry, 2023 to 2033 Figure 171: Oceania Market Attractiveness by Solution, 2023 to 2033 Figure 172: Oceania Market Attractiveness by Deployment, 2023 to 2033 Figure 173: Oceania Market Attractiveness by Enterprise Size, 2023 to 2033 Figure 174: Oceania Market Attractiveness by Industry, 2023 to 2033 Figure 175: Oceania Market Attractiveness by Country, 2023 to 2033 Figure 176: MEA Market Value (US$ Million) by Solution, 2023 to 2033 Figure 177: MEA Market Value (US$ Million) by Deployment, 2023 to 2033 Figure 178: MEA Market Value (US$ Million) by Enterprise Size, 2023 to 2033 Figure 179: MEA Market Value (US$ Million) by Industry, 2023 to 2033 Figure 180: MEA Market Value (US$ Million) by Country, 2023 to 2033 Figure 181: MEA Market Value (US$ Million) Analysis by Country, 2018 to 2033 Figure 182: MEA Market Value Share (%) and BPS Analysis by Country, 2023 to 2033 Figure 183: MEA Market Y-o-Y Growth (%) Projections by Country, 2023 to 2033 Figure 184: MEA Market Value (US$ Million) Analysis by Solution, 2018 to 2033 Figure 185: MEA Market Value Share (%) and BPS Analysis by Solution, 2023 to 2033 Figure 186: MEA Market Y-o-Y Growth (%) Projections by Solution, 2023 to 2033 Figure 187: MEA Market Value (US$ Million) Analysis by Deployment, 2018 to 2033 Figure 188: MEA Market Value Share (%) and BPS Analysis by Deployment, 2023 to 2033 Figure 189: MEA Market Y-o-Y Growth (%) Projections by Deployment, 2023 to 2033 Figure 190: MEA Market Value (US$ Million) Analysis by Enterprise Size, 2018 to 2033 Figure 191: MEA Market Value Share (%) and BPS Analysis by Enterprise Size, 2023 to 2033 Figure 192: MEA Market Y-o-Y Growth (%) Projections by Enterprise Size, 2023 to 2033 Figure 193: MEA Market Value (US$ Million) Analysis by Industry, 2018 to 2033 Figure 194: MEA Market Value Share (%) and BPS Analysis by Industry, 2023 to 2033 Figure 195: MEA Market Y-o-Y Growth (%) Projections by Industry, 2023 to 2033 Figure 196: MEA Market Attractiveness by Solution, 2023 to 2033 Figure 197: MEA Market Attractiveness by Deployment, 2023 to 2033 Figure 198: MEA Market Attractiveness by Enterprise Size, 2023 to 2033 Figure 199: MEA Market Attractiveness by Industry, 2023 to 2033 Figure 200: MEA Market Attractiveness by Country, 2023 to 2033
Recommendations
Explore Technology Insights
View Reports