The global drilling tools market is projected to reach USD 11.5 billion by 2035, recording an absolute increase of USD 3.3 billion over the forecast period. The market is valued at USD 8.2 billion in 2025 and is set to rise at a CAGR of 3.4% during the assessment period. The overall market size is expected to grow by 1.4 times during the same period, supported by increasing offshore exploration activity and deepwater project development worldwide, driving demand for advanced drilling technology systems and increasing investments in unconventional resource development and well construction optimization globally. However, commodity price volatility and project execution complexity may pose challenges to market expansion.
Between 2025 and 2030, the drilling tools market is projected to expand from USD 8.2 billion to USD 9.7 billion, resulting in a value increase of USD 1.5 billion, which represents 45.5% of the total forecast growth for the decade. This phase of development will be shaped by rising demand for offshore drilling campaigns and deepwater exploration projects, product innovation in polycrystalline diamond compact (PDC) bit technologies and rotary steerable systems, as well as expanding integration with measurement-while-drilling platforms and automated drilling initiatives. Companies are establishing competitive positions through investment in advanced cutter technologies, digital drilling solutions, and strategic market expansion across offshore, unconventional, and geothermal drilling applications.
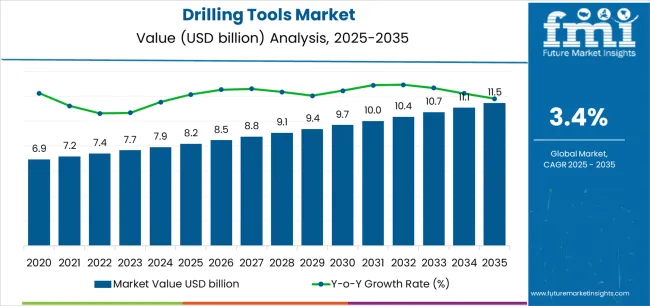
From 2030 to 2035, the market is forecast to grow from USD 9.7 billion to USD 11.5 billion, adding another USD 1.8 billion, which constitutes 54.5% of the overall ten-year expansion. This period is expected to be characterized by the expansion of specialized ultra-deepwater drilling systems, including advanced directional drilling technologies and integrated drilling automation solutions tailored for specific well requirements, strategic collaborations between tool manufacturers and drilling contractors, and an enhanced focus on operational efficiency and well construction optimization. The growing emphasis on energy transition drilling programs and intelligent well systems will drive demand for advanced, high-performance drilling tool solutions across diverse exploration and production applications.
| Metric | Value |
|---|---|
| Market Value (2025) | USD 8.2 billion |
| Market Forecast Value (2035) | USD 11.5 billion |
| Forecast CAGR (2025-2035) | 3.4% |
The drilling tools market grows by enabling drilling contractors to achieve superior penetration rates and well construction efficiency while meeting evolving exploration demands. Drilling operators face mounting pressure to improve operational performance and reduce non-productive time, with advanced drilling tool solutions typically providing 30-45% improvement in rate of penetration over conventional technologies, making premium drill bits and directional tools essential for complex offshore and unconventional drilling projects. The deepwater exploration movement's need for robust, reliable equipment creates demand for advanced drilling solutions that can enhance drilling efficiency, reduce well costs, and ensure consistent performance across challenging geological conditions.
Government initiatives promoting domestic energy production and resource development drive adoption in offshore, onshore, and geothermal applications, where drilling efficiency has a direct impact on project economics and field development profitability. The global shift toward unconventional resource development and extended-reach drilling accelerates drilling tools demand as operators seek alternatives to conventional drilling methods that cannot achieve the lateral distances and formation penetration required for shale and tight reservoir development. However, higher initial tool costs and technical complexity compared to conventional equipment may limit adoption rates among smaller independent operators and regions with mature conventional production.
The market is segmented by product, application, end-use industry, and region. By product, the market is divided into drill bits, motors, reamers and stabilizers, drill pipe and tubulars, and MWD/LWD and rotary steerable systems. Based on application, the market is categorized into offshore (shallow water, deepwater, ultra-deepwater) and onshore (conventional land, unconventional/shale and tight). By end-use industry, the market includes oil and gas, mining, and geothermal and other energy applications. Regionally, the market is divided into Asia Pacific, Europe, North America, Latin America, and Middle East & Africa.
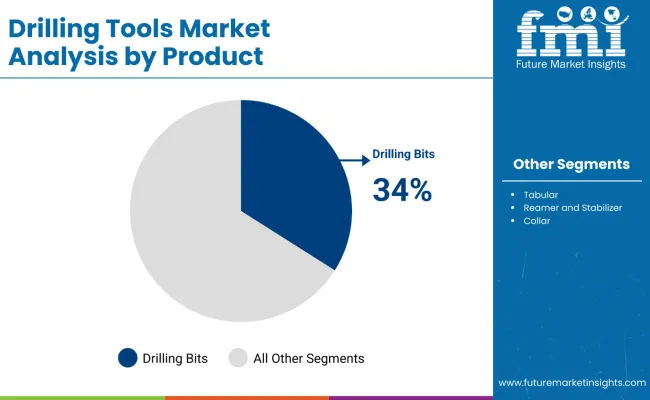
The drill bits segment represents the dominant force in the drilling tools market, capturing approximately 34% of total market share in 2025. This critical category encompasses PDC bits, roller-cone bits, diamond and impregnated bits, and hybrid specialty designs featuring advanced cutter technologies, optimized hydraulic systems, and application-specific configurations, delivering comprehensive drilling performance capabilities with superior penetration rates and extended run life. The drill bits segment's market leadership stems from its essential role in every drilling operation, continuous consumption and replacement requirements, and compatibility with diverse geological formations requiring specialized bit designs for optimal drilling performance.
The PDC bits subsegment maintains a substantial 21.1% market share within drill bits, serving operators requiring high penetration rates in medium to hard formations with polycrystalline diamond cutters. Roller-cone bits account for 9.2% market share, offering proven performance in hard rock and variable formation drilling. Diamond and impregnated bits represent 2.4% of the market, providing specialized capabilities for ultra-hard formations, while hybrid and specialty bits hold 1.3% market share with innovative designs combining multiple technologies.
Motors maintain an 18% market share, featuring downhole positive displacement and turbine systems for directional drilling. Reamers and stabilizers account for 16.5% market share, providing wellbore conditioning and stabilization. MWD/LWD and rotary steerable systems represent 16% of the market, enabling real-time formation evaluation and automated directional control, while drill pipe and tubulars hold 15.5% market share supporting load transmission and circulation requirements.
Key advantages driving the drill bits segment include:
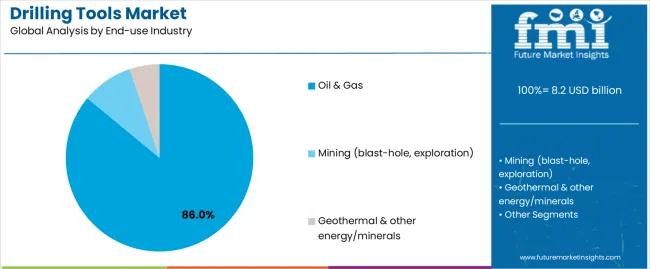
The oil and gas segment represents the leading end-use category in the drilling tools market, capturing approximately 86% of total market share in 2025. This dominant category encompasses upstream exploration and production drilling, workover and well services, and trenchless/HDD applications where drilling tools deliver essential well construction capabilities across global hydrocarbon development projects. The oil and gas segment's market leadership stems from massive drilling activity supporting global energy supply, continuous well development requirements across conventional and unconventional resources, and the fundamental role of drilling operations in reservoir access and hydrocarbon production.
Within oil and gas operations, upstream exploration and production drilling maintains 74% market share, serving new well construction and field development programs worldwide. Workover and well services account for 7% market share, featuring interventions to restore or enhance production from existing wells. Trenchless/HDD and midstream support represent 5% of the market, supporting pipeline installation and infrastructure development.
The mining segment maintains a substantial 9% market share, serving blast-hole drilling and mineral exploration operations where specialized tools support ore extraction and resource evaluation. Geothermal and other energy/minerals applications represent 5% of the market, including geothermal well construction, carbon capture drilling, and emerging energy transition projects requiring drilling capabilities.
Key factors driving oil and gas segment leadership include:
The market is driven by three concrete demand factors tied to exploration activity and drilling efficiency outcomes. First, accelerating offshore development and deepwater exploration create increasing requirements for specialized drilling equipment capable of extreme environments, with global offshore drilling activity growing 8-12% annually across major basins worldwide, requiring premium tools for subsea well construction and complex reservoir access. Second, unconventional resource development and horizontal drilling expansion drive operators toward advanced tool technologies, with PDC bits and rotary steerable systems enabling 50-70% improvement in drilling performance while reducing days-on-well and associated rig costs in shale and tight formation applications. Third, well complexity increases and extended-reach drilling requirements accelerate adoption of directional tools and measurement-while-drilling systems, where integrated drilling solutions reduce wellbore tortuosity by 30-40% compared to conventional motor assemblies while enabling precise reservoir placement and optimized drainage patterns.
Market restraints include high initial tool costs affecting project economics for marginal fields, with premium PDC bits priced 2-3 times higher than roller-cone alternatives, creating financial barriers for independent operators and mature field developments operating on limited capital budgets. Commodity price volatility and drilling activity fluctuations pose market challenges, as tool demand correlates directly with active rig counts where 20-30% variation in drilling activity creates corresponding swings in tool consumption and replacement cycles. Tool performance uncertainty in demanding applications creates additional challenges, particularly for ultra-deepwater and high-pressure/high-temperature wells where downhole conditions can result in premature tool failures, requiring multiple bit runs that extend well construction timelines by 15-25% and increase non-productive time costs.
Key trends indicate accelerated adoption of AI-guided drilling systems in unconventional plays, particularly in Permian Basin and Bakken operations where machine learning algorithms optimize tool parameters enabling 25-35% improvement in rate of penetration while reducing tool wear and extending run life through real-time drilling parameter optimization. Digital twin technology and predictive analytics advancement trends toward wellbore simulation models, bit-rock interaction analysis, and performance forecasting systems are enabling next-generation drilling efficiency improvements and tool selection optimization. However, the market thesis could face disruption if alternative well construction technologies or thermal drilling methods emerge as viable alternatives to mechanical rock destruction, potentially reshaping tool requirements and equipment specifications across the drilling services sector.
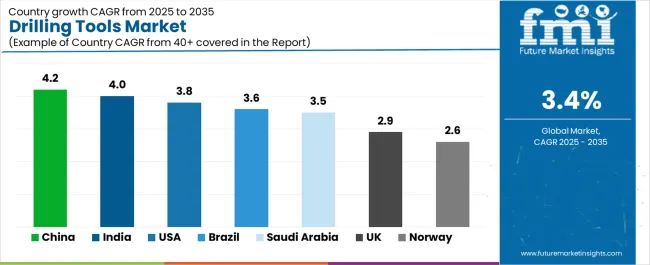
| Country | CAGR (2025-2035) |
|---|---|
| China | 4.2% |
| India | 4% |
| United States | 3.8% |
| Brazil | 3.6% |
| Saudi Arabia | 3.5% |
| United Kingdom | 2.9% |
| Norway | 2.6% |
The drilling tools market is gaining momentum worldwide, with China taking the lead thanks to offshore expansion programs and domestic manufacturing localization initiatives. Close behind, India benefits from upstream drilling intensity and emerging unconventional resource development, positioning itself as a strategic growth hub in the Asia-Pacific region. The United States shows strong advancement, where Permian Basin lateral complexity and Gulf of Mexico deepwater activity strengthen its role in North American drilling supply chains. Brazil demonstrates robust growth through pre-salt deepwater development and sustained FPSO project pipelines, signaling continued investment in offshore drilling infrastructure. Meanwhile, Saudi Arabia stands out for its gas expansion programs combined with in-country value manufacturing initiatives, while the United Kingdom and Norway continue to record consistent progress driven by North Sea life-extension projects and stringent health and safety standards. Together, China and India anchor the global expansion story, while established markets build stability and diversity into the market's growth path.
The report covers an in-depth analysis of 40+ countries; 7 top-performing countries are highlighted below.
China demonstrates the strongest growth potential in the Drilling Tools Market with a CAGR of 4.2% through 2035. The country's leadership position stems from comprehensive offshore drilling program expansion, intensive shale gas development initiatives, and aggressive domestic manufacturing localization targets driving adoption of modern drilling tool systems. Growth is concentrated in major production regions, including Bohai Bay offshore basin, Sichuan shale gas fields, Tarim Basin, and South China Sea blocks, where exploration campaigns, production drilling, and deepwater projects are implementing advanced drilling equipment for well construction optimization. Distribution channels through national oil companies, drilling contractors, and manufacturing joint ventures expand deployment across exploration clusters and development sites. The country's Belt and Road energy infrastructure programs and domestic content requirements provide policy support for tool manufacturing, including technology transfer agreements and local production incentives.
Key market factors:
In major producing basins, frontier exploration blocks, and emerging unconventional plays, the adoption of advanced drilling tool systems is accelerating across ONGC drilling programs, Oil India operations, and coalbed methane pilot projects, driven by domestic production targets and government exploration incentives. The market demonstrates strong growth momentum with a CAGR of 4% through 2035, linked to comprehensive drilling activity expansion and increasing focus on well construction efficiency enhancement solutions. Indian operators are implementing modern drilling tools and performance optimization platforms to improve penetration rates while meeting production targets in key regions including Mumbai High offshore, Krishna-Godavari Basin, Cambay Basin, and Rajasthan onshore fields. The country's Hydrocarbon Exploration and Licensing Policy creates sustained demand for drilling equipment solutions, while increasing emphasis on unconventional resources drives adoption of directional drilling systems that enhance reservoir access.
The United States' expanding drilling sector demonstrates sophisticated implementation of advanced tool systems, with documented case studies showing 45-60% improvement in drilling performance through PDC bit optimization and rotary steerable system adoption in unconventional plays. The country's drilling infrastructure in major producing regions, including Permian Basin, Bakken Formation, Eagle Ford Shale, and Gulf of Mexico offshore, showcases integration of cutting-edge drilling technologies with existing well construction practices, leveraging expertise in horizontal drilling and extended-reach applications. American operators emphasize drilling efficiency and cost optimization, creating demand for premium drilling tool solutions that support operational commitments and well delivery requirements. The market maintains strong growth through focus on unconventional development and offshore activity, with a CAGR of 3.8% through 2035.
Key development areas:
The Brazilian market leads in ultra-deepwater drilling technology based on integration with pre-salt reservoir development and sophisticated subsea well construction systems for enhanced offshore production. The country shows solid potential with a CAGR of 3.6% through 2035, driven by deepwater capital expenditure and sustained FPSO project pipelines across major offshore fields, including Santos Basin pre-salt, Campos Basin, and Sergipe-Alagoas Basin. Brazilian operators are adopting technology-enhanced drilling tools for compliance with deepwater drilling requirements and performance standards, particularly in high-pressure/high-temperature wells requiring specialized equipment and in ultra-deepwater environments with water depths exceeding 2,000 meters. Technology deployment channels through international service companies, Petrobras partnerships, and drilling contractor relationships expand coverage across offshore applications.
Leading market segments:
Saudi Arabia's drilling tools market demonstrates sophisticated implementation focused on gas field development systems and advanced unconventional drilling technologies, with documented integration of directional drilling achieving horizontal well construction in Jafurah shale gas development. The country maintains steady growth momentum with a CAGR of 3.5% through 2035, driven by gas expansion programs and operators' emphasis on in-country value creation aligned with domestic manufacturing development. Major drilling regions, including Jafurah unconventional play, Ghawar oil field, offshore gas fields, and northern basin developments, showcase advanced deployment of PDC bits and rotary steerable systems that integrate seamlessly with existing drilling infrastructure and reservoir development requirements.
Key market characteristics:
In North Sea producing fields, carbon capture drilling projects, and decommissioning wells, drilling operators are implementing tool programs to enhance well construction efficiency and meet strict environmental standards, with documented case studies showing reduced carbon intensity in drilling operations through premium tool adoption. The market shows solid growth potential with a CAGR of 2.9% through 2035, linked to ongoing life-extension initiatives, CCS project development requirements, and increasing focus on drilling efficiency enhancement solutions. British operators are adopting precision drilling tools and electrification-compatible systems to maintain production levels while complying with emissions regulations in mature offshore environments including Central North Sea, Northern North Sea, and West of Shetland regions.
Market development factors:
The Norwegian drilling tools market demonstrates mature implementation focused on harsh-environment drilling and stringent health/safety compliance systems, with documented integration achieving superior performance in high-pressure/high-temperature wells and Arctic drilling conditions. The country maintains steady growth through exploration investment programs and infrastructure development, with a CAGR of 2.6% through 2035, driven by comprehensive Barents Sea exploration requirements and policy support for Norwegian Continental Shelf development. Major drilling regions, including Barents Sea frontier areas, North Sea mature basins, and Norwegian Sea developments, showcase advanced drilling tool deployment where operators integrate premium equipment with existing offshore infrastructure for enhanced safety.
Key market characteristics:

The drilling tools market in Europe is projected to grow from USD 1.8 billion in 2025 to USD 2.5 billion by 2035, registering a CAGR of 3.3% over the forecast period. The North Sea cluster (United Kingdom and Norway combined) is expected to maintain its leadership position with a 44% market share in 2025, declining slightly to 43.2% by 2035, supported by its advanced offshore infrastructure and major life-extension programs, including Central North Sea, Northern North Sea, Barents Sea, and West of Shetland drilling operations.
Continental EU (Germany, Netherlands, Italy, France) follows with a 31% share in 2025, projected to reach 31.5% by 2035, driven by comprehensive onshore drilling programs and emerging geothermal well construction implementing efficient drilling tools. The Mediterranean region (Italy, Spain, Greece) holds a 15% share in 2025, expected to rise to 15.8% by 2035 through offshore field development and exploration activity expansion. Eastern Europe commands a 10% share in 2025, reaching 9.5% by 2035, backed by conventional onshore drilling and emerging unconventional resource assessment. Offshore applications drive approximately 68% of regional tool expenditure, with the product mix led by drill bits at 32%, MWD/LWD and rotary steerable systems at 20%, reamers and stabilizers at 18%, drill pipe and tubulars at 17%, and motors at 13%. Environmental regulations and carbon-intensity mandates steer demand toward longer-life PDC designs, recyclable tubulars, and low-emissions electronic systems.
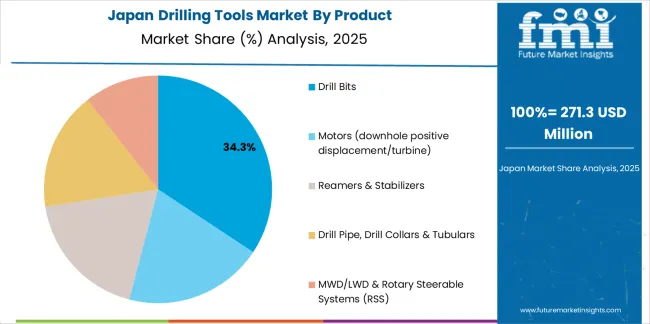
The Japanese drilling tools market demonstrates a mature and technology-focused landscape, characterized by sophisticated integration of premium drill bit designs and advanced directional drilling systems with existing offshore infrastructure across limited domestic exploration operations, technology testing projects, and international project support communities. Japan's emphasis on equipment reliability and operational excellence drives demand for certified drilling tools that support stringent quality commitments and performance expectations in premium international drilling standards. The market benefits from strong partnerships between international tool manufacturers and domestic trading companies including oilfield service cooperatives, creating comprehensive procurement ecosystems that prioritize equipment performance and technical support programs. Technology centers in Tokyo, Yokohama, and other industrial hubs showcase advanced drilling tool evaluation where testing programs achieve 98% qualification success through precision engineering validation and integrated quality assurance platforms.
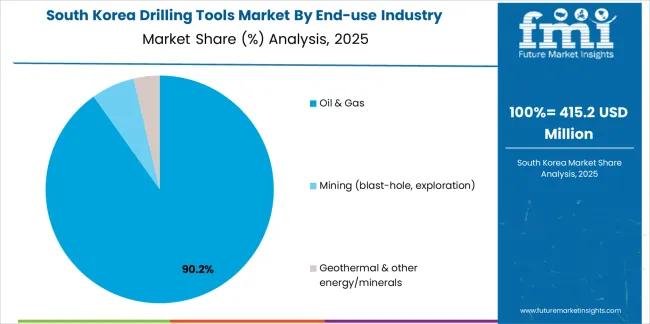
The South Korean drilling tools market is characterized by growing international technology provider presence, with companies maintaining significant positions through comprehensive technical support and engineering services capabilities for domestic manufacturing operations and international project applications. The market demonstrates increasing emphasis on precision manufacturing and technology licensing, as Korean industrial companies increasingly demand advanced drilling tool components that integrate with international service company systems and sophisticated oilfield equipment platforms deployed across major drilling projects. Regional equipment manufacturers are gaining market share through strategic partnerships with international tool companies, offering specialized services including component manufacturing support and application-specific production programs for global drilling operations. The competitive landscape shows increasing collaboration between multinational drilling tool companies and Korean precision manufacturing specialists, creating hybrid business models that combine international technology expertise with local manufacturing capabilities and advanced production systems.
The drilling tools market features approximately 10-15 meaningful players with moderate concentration, where the top three companies control roughly 45-50% of global market share through established manufacturing capabilities and comprehensive product portfolios. Competition centers on tool performance, reliability, and technical support capabilities rather than price competition alone. SLB (Schlumberger) leads with approximately 15.5% market share through its comprehensive drilling technology and oilfield services portfolio.
Market leaders include SLB (Schlumberger), Baker Hughes, and Halliburton, which maintain competitive advantages through global manufacturing infrastructure, extensive technical support networks, and deep expertise in drilling technology development across multiple product segments, creating trust and reliability advantages with major oil companies and drilling contractors. These companies leverage research and development capabilities in PDC cutter technologies and ongoing field service relationships to defend market positions while expanding into digital drilling solutions and automated well construction platforms.
Challengers encompass National Oilwell Varco (NOV) and Weatherford, which compete through comprehensive drilling equipment portfolios and strong presence in offshore drilling markets. Product specialists, including Drilling Tools International, Varel Energy Solutions, and Ulterra (Patterson-UTI), focus on specific tool categories or application segments, offering differentiated capabilities in bit designs, motor technologies, and customized equipment configurations. Regional players and emerging tool manufacturers create competitive pressure through localized production advantages and responsive technical support capabilities, particularly in high-growth markets including China and India, where proximity to drilling operations provides advantages in delivery timelines and field service relationships.
Drilling tools represent essential well construction solutions that enable drilling contractors to achieve 30-45% improvement in penetration rates compared to conventional equipment, delivering superior operational efficiency and well delivery performance with enhanced formation penetration in demanding drilling applications. With the market projected to grow from USD 8.2 billion in 2025 to USD 11.5 billion by 2035 at a 3.4% CAGR, these critical equipment systems offer compelling advantages - drilling efficiency improvements, reduced well costs, and operational performance opportunities - making them essential for offshore operations (57% market share), onshore drilling (43% share), and well construction projects seeking alternatives to conventional drilling methods that cannot achieve the performance requirements of modern complex wells.
| Item | Value |
|---|---|
| Quantitative Units | USD 8.2 billion |
| Product | Drill Bits (PDC bits, Roller-cone, Diamond/impregnated & core bits, Hybrid/other specialty bits), Motors (downhole positive displacement/turbine), Reamers & Stabilizers, Drill Pipe/Drill Collars & Tubulars, MWD/LWD & Rotary Steerable Systems |
| Application | Offshore (Shallow water, Deepwater, Ultra-deepwater), Onshore (Conventional land, Unconventional/shale & tight) |
| End-use Industry | Oil & Gas (Upstream E&P drilling, Workover & well services, Trenchless/HDD & midstream support), Mining (blast-hole, exploration), Geothermal & other energy/minerals |
| Regions Covered | Asia Pacific, Europe, North America, Latin America, Middle East & Africa |
| Country Covered | China, India, United States, Brazil, Saudi Arabia, United Kingdom, Norway, and 40+ countries |
| Key Companies Profiled | SLB (Schlumberger), Baker Hughes, Drilling Tools International, Epiroc, Halliburton, National Oilwell Varco (NOV), Sandvik, Varel Energy Solutions, Weatherford, Ulterra (Patterson-UTI) |
| Additional Attributes | Dollar sales by product, application, and end-use industry categories, regional adoption trends across Asia Pacific, North America, and Middle East & Africa, competitive landscape with tool manufacturers and service networks, technology requirements and specifications, integration with drilling automation platforms and performance monitoring systems, innovations in PDC cutter technology and directional drilling systems, and development of specialized drilling tools with enhanced efficiency and operational reliability capabilities. |
The global drilling tools market is estimated to be valued at USD 8.2 billion in 2025.
The market size for the drilling tools market is projected to reach USD 11.5 billion by 2035.
The drilling tools market is expected to grow at a 3.4% CAGR between 2025 and 2035.
The key product types in drilling tools market are drill bits, motors (downhole positive displacement/turbine), reamers & stabilizers, drill pipe, drill collars & tubulars and mwd/lwd & rotary steerable systems (rss).
In terms of end-use industry, oil & gas segment to command 86.0% share in the drilling tools market in 2025.


Full Research Suite comprises of:
Market outlook & trends analysis
Interviews & case studies
Strategic recommendations
Vendor profiles & capabilities analysis
5-year forecasts
8 regions and 60+ country-level data splits
Market segment data splits
12 months of continuous data updates
DELIVERED AS:
PDF EXCEL ONLINE
Mining & Construction Drilling Tools Market Growth – Trends & Forecast 2024-2034
Drilling Type EDM Market Size and Share Forecast Outlook 2025 to 2035
Drilling Machines Market Size and Share Forecast Outlook 2025 to 2035
Drilling and Completion Fluids Market Diapers Market Analysis - Size, Share & Forecast 2025 to 2035
Drilling Polymers Market Analysis, Growth, Applications and Outlook 2025 to 2035
Mining Drilling Service Market Size and Share Forecast Outlook 2025 to 2035
Rotary Drilling Rig Market Size and Share Forecast Outlook 2025 to 2035
Radial Drilling Machine Market Growth & Demand 2025 to 2035
Onshore Drilling Waste Management Market Size and Share Forecast Outlook 2025 to 2035
Onshore Drilling Fluids Market Growth - Trends & Forecast 2025 to 2035
Crawler Drilling Machine Market
Surface Drilling Rigs Market
Offshore Drilling Riser Market Size and Share Forecast Outlook 2025 to 2035
Multi Pad Drilling Market Size and Share Forecast Outlook 2025 to 2035
Directional Drilling Service Market Growth – Trends & Forecast 2024-2034
Diamond Core Drilling Market Analysis - Size, Share, and Forecast Outlook 2025 to 2035
Competitive Overview of Diamond Core Drilling Market Share
Multi-Axis PCB Drilling Machine Market Size and Share Forecast Outlook 2025 to 2035
Containment and Handling Drilling Waste Management Market Size and Share Forecast Outlook 2025 to 2035
Hand Tools Market Size and Share Forecast Outlook 2025 to 2035

Thank you!
You will receive an email from our Business Development Manager. Please be sure to check your SPAM/JUNK folder too.
Chat With
MaRIA