Reports

- Global Locations -

Headquarters

Future Market Insights, Inc.

Christiana Corporate, 200
Continental Drive, Suite 401,
Newark, Delaware - 19713,
United States

T: +1-845-579-5705

Americas

Future Market Insights, Inc.

616 Corporate Way, Suite 2-9018,
Valley Cottage, NY 10989, United States

T: +1-347-918-3531

MEA

Future Market Insights

1602-6 Jumeirah Bay X2 Tower, Plot No: JLT-PH2-X2A,
Jumeirah Lakes Towers, Dubai,
United Arab Emirates

Europe

Future Market Insights

3rd Floor, 207 Regent Street,
W1B 3HH London
United Kingdom

T: + 44 (0) 20 8123 9659
D: +44 (0) 20 3287 4268

Asia Pacific

Future Market Insights

IndiaLand Global Tech Park, Unit UG-1, Behind Grand HighStreet, Phase 1, Hinjawadi, MH, Pune – 411057, India

Drilling and Completion Fluids Market Outlook from (2023 to 2033)

The global drilling and completion fluids market size is expected to witness a CAGR of 3.8% from 2023 to 2033. It is anticipated to reach a valuation of US$ 13.9 billion by 2033.

It is projected to shape a distinct income-generating possibility worth US$ 4.3 billion in the review period. The drilling and completion fluids market is estimated to top US$ 9.6 billion in 2023.

Attributes Key Insights
Drilling and Completion Fluids Market Estimated Size (2023E) US$ 9.6 billion
Projected Drilling and Completion Fluids Market Valuation (2033F) US$ 13.9 billion
Value-based Drilling and Completion Fluids Market CAGR (2023 to 2033) 3.8%

Don't pay for what you don't need

Customize your report by selecting specific countries or regions and save 30%!

Drilling and Completion Fluids Market Highlights

Emergence of Smart Fluids to Spur Sales in Europe

Emergence of smart drilling and completion fluids across Europe is expected to accelerate growth through 2033. Their ability to respond to evolving downhole environments is set to aid demand.

Need for highly advanced drilling performance in the United Kingdom, Sweden, and Germany might propel demand as they can adjust the density and viscosity in real-time. This is estimated to result in low downtime, quick penetration rates, enhanced drilling efficiency, and high cost savings.

In May 2023, for instance, the SmartROC T25 R, a fresh premium wireless autonomous drill rig, was launched by Epiroc. The recently released compact drill rig, designed for quarrying and construction, is the initial model in its category to join the Epiroc SmartROC family.

It is outfitted with a variety of useful features and technologies. The rig has the most significant level of technology and automation in its segment thanks to the smart technology, which consists of an intelligent RCS control system.

Ultra-deep Water Drilling to Fuel Sales in Asia Pacific

Harsh climatic conditions, high temperatures, and extreme pressure faced during ultra-deepwater drilling activities in Asia Pacific might spur drilling and completion fluid demand. State-of-the-art drilling fluids are set to gain impetus as they help to maintain wellbore stability and prevent harsh conditions.

Leading oil & gas companies across Asia Pacific are expected to invest huge sums in acquiring cutting-edge ultra-deepwater drilling equipment. Adoption of innovative drilling fluids might expand in the region to lower operational downtime, extend the life of costly assets, and protect tools from wear & tear.

According to the chairman of Oil India, to significantly increase output, the company would increase drilling activities by 50% in 2023. It also plans to broaden exploration into new regions and use increased oil extraction techniques in established fields.

Oil India boosted its production by 5.5% to 3.18 million metric tons (mmt) and its gas output by 4.4% to 3.18 billion cubic meters (bcm) throughout the year. This rise comes on the heels of the production increase that was used to counteract the inevitable decline in already mature areas.

2018 to 2023 Drilling and Completion Fluids Market Insights Vs. 2023 to 2033

The global drilling and completion fluids market grew at a considerable CAGR of 5.8% in the historical period between 2018 and 2022. It is anticipated to witness a CAGR of 3.8% from 2023 to 2033. The drilling and completion fluids market stood at a valuation of US$ 9.1 billion in 2022.

Historical Drilling and Completion Fluids Market Size (2022) US$ 9.1 billion
Historical Drilling and Completion Fluids Market CAGR (2018 to 2022) 5.8%

Variable rock compositions and complex geological structures are inevitable in shale formations. As mentioned earlier, the need for specialized drilling and completion fluids might expand as shale drilling requires effective management of the hindrances. These fluids can also solve high formation damage, lost circulation, and wellbore instability.

Shale gas extraction includes hydraulic fracturing or fracking, which requires a large amount of specialized drilling fluids. These fluids help transport proppants and develop fractures in the shale rock to keep them open. This fracking process might only be complete with the presence of drilling fluids.

Shale formations might also have variable and unpredictable formation pressures. Hence, drilling and completion fluids are expected to ensure safety and lower blowouts. Advanced drilling fluids help balance this formation pressure, thereby enabling smooth operations.

Increasing investments in shale gas & oil extraction activities by key companies worldwide are anticipated to drive the drilling and completion fluid sales. For instance, oil companies in the United States have drilled below the earth's surface in both downward and sideways directions since the start of the shale boom.

The 2024 fiscal year could see about US $ 500 million invested in tight oil, shale oil, and development projects by Cairn Oil and Gas, a division of Vedanta Ltd. The corporation will spend about two-thirds of the money on initiatives that produce results. A third of the expenditure, or about US$ 166 million, will go toward projects that will promote expansion and exploration and produce volumes over the long term.

Nikhil Kaitwade
Nikhil Kaitwade

Principal Consultant

Talk to Analyst

Find your sweet spots for generating winning opportunities in this market.

Latest Drilling and Completion Fluids Trends, Opportunities, and Challenges

The table below provides the latest trends observed in the global drilling and completion fluids market, growth obstacles, and upcoming opportunities. Business strategies for the drilling and completion fluids market enable stakeholders to invest in the right area and gain profit.

Attributes Key Factors
Latest Trends
  • Rising demand for non-toxic and biodegradable drilling fluid formulations amid surging concerns about the environment might aid growth.
  • Integration of smart sensors and the Internet of Things (IoT) into drilling equipment to control fluid conditions in real-time is a key trend.
Upcoming Opportunities
  • Key companies are expected to enter untapped markets such as the Middle East & Africa and Latin America to fulfill the demand for drilling activities.
  • Ongoing inclination toward renewable energy sources such as offshore wind and geothermal energy is expected to create new opportunities.
Challenges
  • Fluctuations in terms of the prices of raw materials required for drilling such as specialty chemicals and barite are anticipated to hamper demand.
  • Stringent norms associated with the environment might compel key companies to launch environmentally friendly drilling fluids, which can often be expensive.

Comparative Analysis of Adjacent Drilling and Completion Fluids Markets

The global drilling and completion fluids market is likely to be impacted by the peer or tangential markets in the chemicals & materials sector. These include other markets such as the drilling polymers market and the on-shore drilling fluids market. The global sales outlook of the drilling and completion fluids market can provide deeper insights that might help develop unique differentiating strategies to pursue growth and opportunity.

Out of the three markets, the drilling and completion fluids market is set to dominate, followed by the on-shore drilling fluids market with valuations of US$ 9.6 billion and US$ 5.04 billion in 2023, respectively. All three markets are anticipated to expand amid increasing shale gas exploration activities worldwide.

Drilling and Completion Fluids Market:

Attributes Drilling and Completion Fluids Market
CAGR (2023 to 2033) 3.8%
Market Value (2023) US$ 9.6 billion
Growth Factor Global demand for energy amid ongoing industrialization and population growth is set to propel the need for drilling and completion fluids.
Key Trend Growing adoption of advanced additives and nanotechnology in drilling fluids to enhance fluid loss control, thermal stability, and lubricity is expected to drive growth.

Drilling Polymers Market:

Attributes Drilling Polymers Market
CAGR (2023 to 2033) 3.5%
Market Value (2023) US$ 2132.4 million
Growth Factor Increasing need to enhance wellbore stability by preventing damages during drilling, lowering fluid loss, and developing a robust filter on formation walls is set to aid sales.
Key Trend Growing exploration of complex oil & gas reservoirs such as tight oil and shale gas is expected to demand unique drilling polymers for efficient performance.

On-shore Drilling Fluids Market:

Attributes On-shore Drilling Fluids Market
CAGR (2023 to 2033) 5.1%
Market Value (2023) US$ 5.04 billion
Growth Factor Increasing focus of renowned oil & gas companies on ultra-deep and deep-water exploration activities is anticipated to push growth.
Key Trend Increasing adoption of shale gas across the globe on the back of easy accessibility and availability in emerging nations is a significant trend.

Get the data you need at a Fraction of the cost

Personalize your report by choosing insights you need
and save 40%!

Country-wise Insights

The table below explains the drilling and completion fluids market demand from the top 5 countries. Regional forecast for the drilling and completion fluids market by country states that the United States is anticipated to remain at the forefront by topping a size of US$ 2.5 billion by 2033.

China might reach US$ 2.0 billion in 2033. Japan is expected to follow the United States and China to create a moderate drilling and completion fluid demand worth US$ 1.1 billion.

Country Market Value (2033)
United States US$ 2.5 billion
United Kingdom US$ 445.9 million
China US$ 2.0 billion
Japan US$ 1.1 billion
South Korea US$ 858.5 million

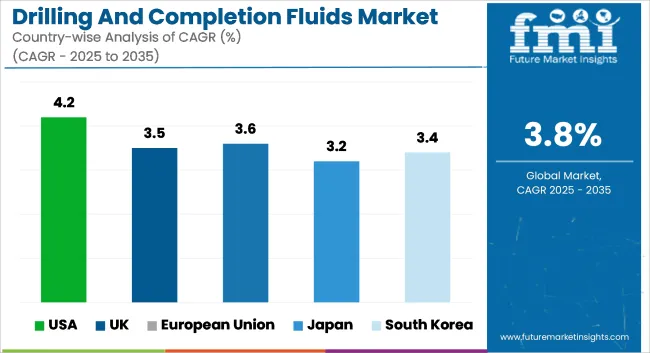
The table below shows the growth potential of the drilling and completion fluids market. CAGRs of the top 5 countries are provided. Out of the 5, South Korea will likely lead the drilling and completion fluids market by exhibiting a CAGR of 4.4% from 2023 to 2033. Following this, China and the United States are expected to witness drilling and completion fluid sales at the CAGRs of 4.2% and 3.5%, respectively.

Country Value-based CAGR (2023 to 2033)
United States 3.5%
United Kingdom 2.8%
China 4.2%
Japan 3.0%
South Korea 4.4%

Deepwater Drilling Fluids to Witness Demand in the United States amid Shale Boom

The United States drilling and completion fluids market is anticipated to top US$ 2.5 billion by 2033. It is expected to witness a CAGR of 3.5% from 2023 to 2033.

Rising shale boom in several parts of the United States, such as Marcellus, Eagle Ford, and the Permian Basin, is projected to push the drilling and completion fluids market. Ongoing development of shale gas & oil reserves in these areas is anticipated to aid demand. Special drilling fluids, such as hydraulic fracturing fluids, are expected to be required for increasing production across shale formations.

According to the United States Energy Information Administration (EIA), the country's tight oil reserves produced around 2.84 billion barrels of crude oil in 2022, or about 7.79 million barrels daily. In 2022, this amounted to about 66% of the United States’ total crude oil output.

Increasing oil & gas exploration activities in the United States will likely give rise to cutting-edge drilling techniques such as hydraulic fracturing and horizontal drilling. As the complexity of exploration and drilling operations surges, novel technologies are needed. It is projected to result in the development of specialized drilling and completion fluids for addressing technological hindrances.

HPHT Drilling Fluids Find Use in Radial Drilling Machines in the United Kingdom

The United Kingdom is projected to record a CAGR of 2.8% in the forecast period. It is anticipated to reach a valuation of US$ 445.9 million by 2033 in the water-based drilling and completion fluids market.

High sales of radial drilling machines in the United Kingdom are estimated to boost growth through 2033. Due to their high versatility, radial drilling machines are expected to be utilized in several drilling applications such as manufacturing, construction, and metalworking. High demand for infrastructure development and manufactured products will likely propel the need for radial drilling machines, pushing fluid sales.

Ability of radial drilling machines to offer efficient and precise drilling performance is another factor that might drive drilling and completion fluid demand. These fluids are set to help enhance the drilling performance by eliminating debris and lubricating or cooling the drill bit.

Utilization of drilling and completion fluids might surge in radial drilling machines to extend the life of cutting equipment such as drill bits. These fluids are anticipated to result in significant cost savings by lowering the number of tool replacements.

Rotary Drilling Rigs in China to Fuel Demand for Drilling Fluid Additives

China is likely to expand at a CAGR of 4.2% in the estimated time frame from 2023 to 2033. It is slated to register US$ 2.0 billion by 2033 in the drilling fluids market.

Increasing use of rotary drilling rigs in mining, geothermal drilling, construction, and oil & gas exploration industries is set to push demand in China. Growing drilling activities in the country amid high demand for energy production, infrastructure development, and resources are also expected to aid sales.

The high versatility and efficiency of rotary drilling rigs will likely make their usage ideal for several geological formations. The drilling and completion fluids market is set to surge with the increasing need for effective and smooth drilling operations in China. These further enhance the drilling performance by lowering friction, initiating cutting, and cooling down the drill bit.

Wellbore stability maintenance is another vital factor in China's oil & gas exploration space. It is expected to help maintain the integrity of wells and lower the risk of accidents. Using drilling and completion fluids might help ensure safe drilling operations, reduce formation collapse, and strengthen the wellbore.

Net-zero Goals in Japan to Spur Drilling Fluid Filtration Demand by 2033

Japan is anticipated to register a CAGR of 3.0% from 2023 to 2033 in the drilling and completion fluids market. It grew at a decent CAGR of 4.7% from 2018 to 2022.

Companies in Japan that are aiming to achieve net zero are either looking to buy low-carbon intensity barrels or sell high-intensity ones. They are suggesting that acreage consolidation or portfolio restructuring might be imminent.

A buyer devoted to achieving its net-zero targets might need to be more responsive despite a substantial resource size and a tempting offering price. Hence, merger & acquisition activity would be needed to promote environmental, social, and governance (ESG) goals and be financially accretive.

Partnerships, alliances, and mergers are becoming more important in bringing about significant reform in Japan's oil & gas industry. With the new energy or low-carbon justification taking center stage, growth in the drilling tools market is set to surge.

Off-shore Oil-based Drilling Fluids to Gain Impetus in South Korea

South Korea is expected to reach a valuation of US$ 858.5 million by 2033. It is anticipated to register a CAGR of around 4.4% in the drilling and completion fluids market evaluation period.

Rising popularity of off-shore drilling activities in South Korea to gain access to untapped gas & oil reservoirs under the ocean floor might boost demand. Off-shore exploration activities are anticipated to expand in this country due to the scarcity of on-shore resources. This is set further to propel the need for drilling and completion fluids.

Ongoing innovations in drilling technology are expected to help the sector produce and explore hydrocarbons deep beneath the ocean. Requirements of unique drilling fluids are anticipated to skyrocket as extreme off-shore conditions need safe and stable operations.

Drilling and completion fluids are also expected to manage harsh climatic conditions, enhance productivity, and lower the risk of well control problems. Increasing offshore drilling operations in complex reservoirs such as high-pressure and high-temperature (HPHT) ones will likely bolster sales.

Category-wise Insights

Water-based Drilling Fluids to Witness High Demand in Shale Drilling Activities

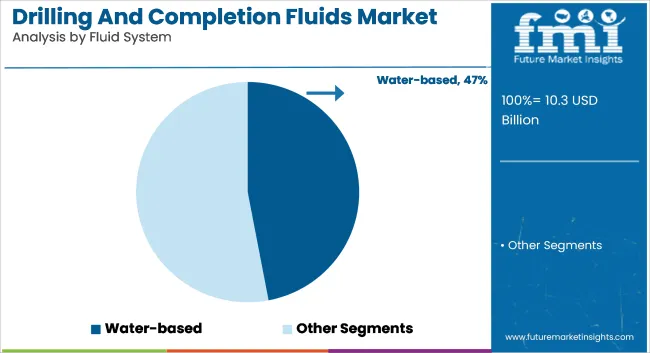
The table below highlights the global demand for drilling and completion fluids by fluid system. Under fluid systems, the demand for water-based drilling and completion fluids will likely remain high during the assessment period.

The water-based segment, while smaller, is set to showcase a significant CAGR of 3.7% through 2033. It is expected to be followed by oil-based, synthetic-based, and other segments.

Category Fluid System
Sub-category Water-based
Value-based CAGR (2023 to 2033) 3.7%

Regarding fluid systems, the water-based segment is projected to showcase a CAGR of 3.7% from 2023 to 2033. It expanded at a CAGR of 5.6% in the historical period between 2023 and 2033 in the drilling and completion fluids market.

Water-based drilling and completion fluid demand might surge globally with the shift toward sustainable products. Compared to oil-based fluids, water-based drilling and completion fluids have lower volatility, pose minor environmental risks in case of leaks or spills, and are less toxic. The adoption of water-based fluids might expand worldwide amid the implementation of stringent environmental norms.

Introduction of strict safety standards to ensure a healthy working environment for employees is another factor that bolsters demand. Water-based drilling and completion fluids are ideal solutions as they emit less hazardous fumes than oil-based fluids.

Water-based fluids are expected to be extensively used for shale drilling, an unconventional technique. Shale drilling has witnessed a high growth rate in the past few years. Ability of water-based fluids to lower environmental impacts and raise production levels might push their demand in shale drilling activities.

On-shore Drilling and Completion Fluids Applications to Expand through2033

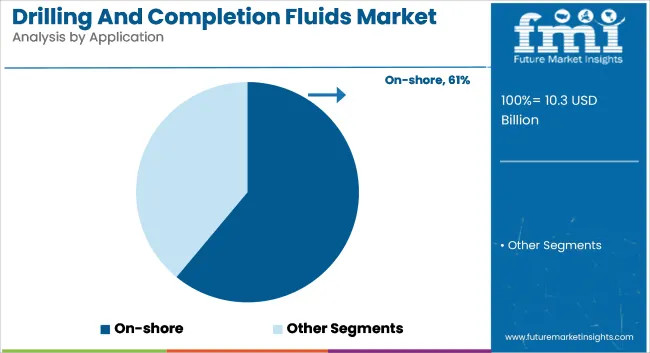
The table below highlights the global demand for drilling and completion fluids by application. Under application, the on-shore segment will likely dominate in the assessment period in terms of drilling and completion fluids market share.

The on-shore segment, while smaller, is set to showcase a significant CAGR of 3.5% through 2033. It is expected to be followed by the off-shore segment.

Category Application
Sub-category On-shore
Value-based CAGR (2023 to 2033) 3.5%

Based on application, the on-shore segment recorded a considerable CAGR of 5.5% from 2018 to 2022. The drilling and completion fluids market will likely register an average CAGR of 3.5% from 2023 to 2033.

Increasing inclination of oil & gas companies toward on-shore exploration activities is anticipated to propel drilling and completion fluid sales. The potential for low cost and easy accessibility of oil & gas reserves might augment their interest in on-shore drilling. Growing on-shore drilling activities are anticipated to push the market.

Rising shale oil and gas extraction from unconventional resources will likely accelerate the demand for on-shore drilling activities. Use of special drilling fluids to surge production might make them an ideal choice for on-shore drilling.

Growing adoption of enhanced oil recovery (EOR) methods in on-shore fields is another vital factor supporting demand. These methods are set to be suitable for extracting additional oil & gas reserves. Hence, the injection of several unique demands for on-shore drilling and completion fluids is required to enhance the productivity of reservoirs.

Competitive Landscape

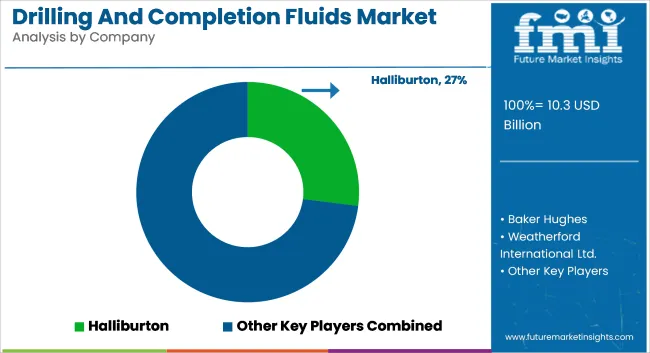
With international corporations and more than 100 firms engaged in the same business, the drilling and completion fluids market is currently very competitive. Leading companies would participate in product innovation through research & development expenditure. They aim to create multipurpose fluid additives that provide a competitive advantage over their opponents.

Top companies in the drilling and completion fluids market might distinguish themselves from their rivals by handling a variety of industry demands. These players are also engaged in implementing strategic initiatives to achieve a competitive edge. These strategies include new product development, partnerships, and acquisitions.

For instance,

  • In January 2023, modern fluid performance innovations were introduced to the digitized oilfield by MUDLabs. By collaborating with Cutpoint, Inc., the company is introducing fresh initiatives to cut down on drilling operators' wasted time. The goal of this rebranding is to lower costs, leave a less environmental footprint, and boost drilling activities that include fluids.
  • In November 2022, the proprietary drilling fluid loss additive Synergy 10AS Nano was released by NanoMalaysia Bhd (NMB). The introduction came after a fruitful four-year development and test period that was in accordance with Malaysia's National Energy Policy to lower carbon emissions through increased energy efficiency.
  • In April 2022, MacDermid Offshore Solutions launched a water-based hydraulic fluid called Erifon THF 32 for the offshore oil & gas sector. The company's Erifon Fluid line was created especially for hydraulic compensator and blow-out preventer systems used in drill rig operations. The recently introduced Erifon THF 32 might help enhance the company's current offerings.

Scope of the Drilling and Completion Fluids Market Report

Attribute Details
Estimated Drilling and Completion Fluids Market Size (2023) US$ 9.6 billion
Projected Drilling and Completion Fluids Market Valuation (2033) US$ 13.9 billion
Value-based Drilling and Completion Fluids Market CAGR (2023 to 2033) 3.8%
Historical Data 2018 to 2022
Forecast Period 2023 to 2033
Quantitative Units Value (US$ billion)
Segments Covered in Drilling and Completion Fluids Market Study
  • Fluid System
  • Application
  • Region
Regions Covered in Drilling and Completion Fluids Market Report North America, Latin America, East Asia, South Asia Pacific, Western Europe, Eastern Europe, Middle East & Africa
Key Countries Covered in Worldwide Drilling and Completion Fluids Market United States, Canada, Brazil, Mexico, Germany, Italy, France, United Kingdom, Spain, Russia, GCC Countries, India, China, Japan and Australia
Drilling and Completion Fluids Market Top Players
  • Baker Hughes
  • GE Company
  • CES Energy Solutions Corp
  • Global Drilling Fluids & Chemicals Limited
  • Halliburton
  • National Oilwell Varco
  • Newpark Resources, Inc.

Drilling and Completion Fluids Market Outlook by Category

By Fluid System:

  • Water-based
  • Oil-based
  • Synthetic-based
  • Other Fluid Systems

By Application:

  • On-shore
  • Off-shore

By Region:

  • North America
  • Latin America
  • Western Europe
  • Eastern Europe
  • South Asia and Pacific
  • East Asia
  • Middle East and Africa

Frequently Asked Questions

How big is the drilling and completion fluids market?

The drilling and completion fluids market might top US$ 13.9 billion by 2033.

Who are the key players in the drilling and completion fluids market?

Baker Hughes and GE Company are the leading players in the market.

What is the drilling and completion fluids market forecast?

The drilling and completion fluids market might witness a 3.8% CAGR from 2023 to 2033.

What are the applications of drilling and completion fluids?

Drilling and completion fluids are set to be used in on-shore and off-shore applications.

What are the latest trends in the drilling and completion fluids market?

Increasing oil and gas exploration activities worldwide is a key trend.

Table of Content

1. Executive Summary

    1.1. Global Market Outlook

    1.2. Demand-side Trends

    1.3. Supply-side Trends

    1.4. Technology Roadmap Analysis

    1.5. Analysis and Recommendations

2. Market Overview

    2.1. Market Coverage / Taxonomy

    2.2. Market Definition / Scope / Limitations

3. Market Background

    3.1. Market Dynamics

        3.1.1. Drivers

        3.1.2. Restraints

        3.1.3. Opportunity

        3.1.4. Trends

    3.2. Scenario Forecast

        3.2.1. Demand in Optimistic Scenario

        3.2.2. Demand in Likely Scenario

        3.2.3. Demand in Conservative Scenario

    3.3. Opportunity Map Analysis

    3.4. Product Life Cycle Analysis

    3.5. Supply Chain Analysis

        3.5.1. Supply Side Participants and their Roles

            3.5.1.1. Producers

            3.5.1.2. Mid-Level Participants (Traders/ Agents/ Brokers)

            3.5.1.3. Wholesalers and Distributors

        3.5.2. Value Added and Value Created at Node in the Supply Chain

        3.5.3. List of Raw Material Suppliers

        3.5.4. List of Existing and Potential Buyer’s

    3.6. Investment Feasibility Matrix

    3.7. Value Chain Analysis

        3.7.1. Profit Margin Analysis

        3.7.2. Wholesalers and Distributors

        3.7.3. Retailers

    3.8. PESTLE and Porter’s Analysis

    3.9. Regulatory Landscape

        3.9.1. By Key Regions

        3.9.2. By Key Countries

    3.10. Regional Parent Market Outlook

    3.11. Production and Consumption Statistics

    3.12. Import and Export Statistics

4. Global Market Analysis 2018 to 2022 and Forecast, 2023 to 2033

    4.1. Historical Market Size Value (US$ billion) & Volume (tons) Analysis, 2018 to 2022

    4.2. Current and Future Market Size Value (US$ billion) & Volume (tons) Projections, 2023 to 2033

        4.2.1. Y-o-Y Growth Trend Analysis

        4.2.2. Absolute $ Opportunity Analysis

5. Global Market Analysis 2018 to 2022 and Forecast 2023 to 2033, By Fluid System

    5.1. Introduction / Key Findings

    5.2. Historical Market Size Value (US$ billion) & Volume (tons) Analysis By Fluid System, 2018 to 2022

    5.3. Current and Future Market Size Value (US$ billion) & Volume (tons) Analysis and Forecast By Fluid System, 2023 to 2033

        5.3.1. Water-based

        5.3.2. Oil-based

        5.3.3. Synthetic-based

        5.3.4. Other Fluid Systems

    5.4. Y-o-Y Growth Trend Analysis By Fluid System, 2018 to 2022

    5.5. Absolute $ Opportunity Analysis By Fluid System, 2023 to 2033

6. Global Market Analysis 2018 to 2022 and Forecast 2023 to 2033, By Application

    6.1. Introduction / Key Findings

    6.2. Historical Market Size Value (US$ billion) & Volume (tons) Analysis By Application, 2018 to 2022

    6.3. Current and Future Market Size Value (US$ billion) & Volume (tons) Analysis and Forecast By Application, 2023 to 2033

        6.3.1. On-shore

        6.3.2. Off-shore

    6.4. Y-o-Y Growth Trend Analysis By Application, 2018 to 2022

    6.5. Absolute $ Opportunity Analysis By Application, 2023 to 2033

7. Global Market Analysis 2018 to 2022 and Forecast 2023 to 2033, By Region

    7.1. Introduction

    7.2. Historical Market Size Value (US$ billion) & Volume (tons) Analysis By Region, 2018 to 2022

    7.3. Current Market Size Value (US$ billion) & Volume (tons) Analysis and Forecast By Region, 2023 to 2033

        7.3.1. North America

        7.3.2. Latin America

        7.3.3. Western Europe

        7.3.4. Eastern Europe

        7.3.5. South Asia and Pacific

        7.3.6. East Asia

        7.3.7. Middle East and Africa

    7.4. Market Attractiveness Analysis By Region

8. North America Market Analysis 2018 to 2022 and Forecast 2023 to 2033, By Country

    8.1. Historical Market Size Value (US$ billion) & Volume (tons) Trend Analysis By Market Taxonomy, 2018 to 2022

    8.2. Market Size Value (US$ billion) & Volume (tons) Forecast By Market Taxonomy, 2023 to 2033

        8.2.1. By Country

            8.2.1.1. United States

            8.2.1.2. Canada

        8.2.2. By Fluid System

        8.2.3. By Application

    8.3. Market Attractiveness Analysis

        8.3.1. By Country

        8.3.2. By Fluid System

        8.3.3. By Application

    8.4. Key Takeaways

9. Latin America Market Analysis 2018 to 2022 and Forecast 2023 to 2033, By Country

    9.1. Historical Market Size Value (US$ billion) & Volume (tons) Trend Analysis By Market Taxonomy, 2018 to 2022

    9.2. Market Size Value (US$ billion) & Volume (tons) Forecast By Market Taxonomy, 2023 to 2033

        9.2.1. By Country

            9.2.1.1. Brazil

            9.2.1.2. Mexico

            9.2.1.3. Rest of Latin America

        9.2.2. By Fluid System

        9.2.3. By Application

    9.3. Market Attractiveness Analysis

        9.3.1. By Country

        9.3.2. By Fluid System

        9.3.3. By Application

    9.4. Key Takeaways

10. Western Europe Market Analysis 2018 to 2022 and Forecast 2023 to 2033, By Country

    10.1. Historical Market Size Value (US$ billion) & Volume (tons) Trend Analysis By Market Taxonomy, 2018 to 2022

    10.2. Market Size Value (US$ billion) & Volume (tons) Forecast By Market Taxonomy, 2023 to 2033

        10.2.1. By Country

            10.2.1.1. Germany

            10.2.1.2. United Kingdom

            10.2.1.3. France

            10.2.1.4. Spain

            10.2.1.5. Italy

            10.2.1.6. Rest of Western Europe

        10.2.2. By Fluid System

        10.2.3. By Application

    10.3. Market Attractiveness Analysis

        10.3.1. By Country

        10.3.2. By Fluid System

        10.3.3. By Application

    10.4. Key Takeaways

11. Eastern Europe Market Analysis 2018 to 2022 and Forecast 2023 to 2033, By Country

    11.1. Historical Market Size Value (US$ billion) & Volume (tons) Trend Analysis By Market Taxonomy, 2018 to 2022

    11.2. Market Size Value (US$ billion) & Volume (tons) Forecast By Market Taxonomy, 2023 to 2033

        11.2.1. By Country

            11.2.1.1. Poland

            11.2.1.2. Russia

            11.2.1.3. Czech Republic

            11.2.1.4. Romania

            11.2.1.5. Rest of Eastern Europe

        11.2.2. By Fluid System

        11.2.3. By Application

    11.3. Market Attractiveness Analysis

        11.3.1. By Country

        11.3.2. By Fluid System

        11.3.3. By Application

    11.4. Key Takeaways

12. South Asia and Pacific Market Analysis 2018 to 2022 and Forecast 2023 to 2033, By Country

    12.1. Historical Market Size Value (US$ billion) & Volume (tons) Trend Analysis By Market Taxonomy, 2018 to 2022

    12.2. Market Size Value (US$ billion) & Volume (tons) Forecast By Market Taxonomy, 2023 to 2033

        12.2.1. By Country

            12.2.1.1. India

            12.2.1.2. Bangladesh

            12.2.1.3. Australia

            12.2.1.4. New Zealand

            12.2.1.5. Rest of South Asia and Pacific

        12.2.2. By Fluid System

        12.2.3. By Application

    12.3. Market Attractiveness Analysis

        12.3.1. By Country

        12.3.2. By Fluid System

        12.3.3. By Application

    12.4. Key Takeaways

13. East Asia Market Analysis 2018 to 2022 and Forecast 2023 to 2033, By Country

    13.1. Historical Market Size Value (US$ billion) & Volume (tons) Trend Analysis By Market Taxonomy, 2018 to 2022

    13.2. Market Size Value (US$ billion) & Volume (tons) Forecast By Market Taxonomy, 2023 to 2033

        13.2.1. By Country

            13.2.1.1. China

            13.2.1.2. Japan

            13.2.1.3. South Korea

        13.2.2. By Fluid System

        13.2.3. By Application

    13.3. Market Attractiveness Analysis

        13.3.1. By Country

        13.3.2. By Fluid System

        13.3.3. By Application

    13.4. Key Takeaways

14. Middle East and Africa Market Analysis 2018 to 2022 and Forecast 2023 to 2033, By Country

    14.1. Historical Market Size Value (US$ billion) & Volume (tons) Trend Analysis By Market Taxonomy, 2018 to 2022

    14.2. Market Size Value (US$ billion) & Volume (tons) Forecast By Market Taxonomy, 2023 to 2033

        14.2.1. By Country

            14.2.1.1. GCC Countries

            14.2.1.2. South Africa

            14.2.1.3. Israel

            14.2.1.4. Rest of Middle East & Africa

        14.2.2. By Fluid System

        14.2.3. By Application

    14.3. Market Attractiveness Analysis

        14.3.1. By Country

        14.3.2. By Fluid System

        14.3.3. By Application

    14.4. Key Takeaways

15. Key Countries Market Analysis

    15.1. United States

        15.1.1. Pricing Analysis

        15.1.2. Market Share Analysis, 2022

            15.1.2.1. By Fluid System

            15.1.2.2. By Application

    15.2. Canada

        15.2.1. Pricing Analysis

        15.2.2. Market Share Analysis, 2022

            15.2.2.1. By Fluid System

            15.2.2.2. By Application

    15.3. Brazil

        15.3.1. Pricing Analysis

        15.3.2. Market Share Analysis, 2022

            15.3.2.1. By Fluid System

            15.3.2.2. By Application

    15.4. Mexico

        15.4.1. Pricing Analysis

        15.4.2. Market Share Analysis, 2022

            15.4.2.1. By Fluid System

            15.4.2.2. By Application

    15.5. Germany

        15.5.1. Pricing Analysis

        15.5.2. Market Share Analysis, 2022

            15.5.2.1. By Fluid System

            15.5.2.2. By Application

    15.6. United Kingdom

        15.6.1. Pricing Analysis

        15.6.2. Market Share Analysis, 2022

            15.6.2.1. By Fluid System

            15.6.2.2. By Application

    15.7. France

        15.7.1. Pricing Analysis

        15.7.2. Market Share Analysis, 2022

            15.7.2.1. By Fluid System

            15.7.2.2. By Application

    15.8. Spain

        15.8.1. Pricing Analysis

        15.8.2. Market Share Analysis, 2022

            15.8.2.1. By Fluid System

            15.8.2.2. By Application

    15.9. Italy

        15.9.1. Pricing Analysis

        15.9.2. Market Share Analysis, 2022

            15.9.2.1. By Fluid System

            15.9.2.2. By Application

    15.10. Poland

        15.10.1. Pricing Analysis

        15.10.2. Market Share Analysis, 2022

            15.10.2.1. By Fluid System

            15.10.2.2. By Application

    15.11. Russia

        15.11.1. Pricing Analysis

        15.11.2. Market Share Analysis, 2022

            15.11.2.1. By Fluid System

            15.11.2.2. By Application

    15.12. Czech Republic

        15.12.1. Pricing Analysis

        15.12.2. Market Share Analysis, 2022

            15.12.2.1. By Fluid System

            15.12.2.2. By Application

    15.13. Romania

        15.13.1. Pricing Analysis

        15.13.2. Market Share Analysis, 2022

            15.13.2.1. By Fluid System

            15.13.2.2. By Application

    15.14. India

        15.14.1. Pricing Analysis

        15.14.2. Market Share Analysis, 2022

            15.14.2.1. By Fluid System

            15.14.2.2. By Application

    15.15. Bangladesh

        15.15.1. Pricing Analysis

        15.15.2. Market Share Analysis, 2022

            15.15.2.1. By Fluid System

            15.15.2.2. By Application

    15.16. Australia

        15.16.1. Pricing Analysis

        15.16.2. Market Share Analysis, 2022

            15.16.2.1. By Fluid System

            15.16.2.2. By Application

    15.17. New Zealand

        15.17.1. Pricing Analysis

        15.17.2. Market Share Analysis, 2022

            15.17.2.1. By Fluid System

            15.17.2.2. By Application

    15.18. China

        15.18.1. Pricing Analysis

        15.18.2. Market Share Analysis, 2022

            15.18.2.1. By Fluid System

            15.18.2.2. By Application

    15.19. Japan

        15.19.1. Pricing Analysis

        15.19.2. Market Share Analysis, 2022

            15.19.2.1. By Fluid System

            15.19.2.2. By Application

    15.20. South Korea

        15.20.1. Pricing Analysis

        15.20.2. Market Share Analysis, 2022

            15.20.2.1. By Fluid System

            15.20.2.2. By Application

    15.21. GCC Countries

        15.21.1. Pricing Analysis

        15.21.2. Market Share Analysis, 2022

            15.21.2.1. By Fluid System

            15.21.2.2. By Application

    15.22. South Africa

        15.22.1. Pricing Analysis

        15.22.2. Market Share Analysis, 2022

            15.22.2.1. By Fluid System

            15.22.2.2. By Application

    15.23. Israel

        15.23.1. Pricing Analysis

        15.23.2. Market Share Analysis, 2022

            15.23.2.1. By Fluid System

            15.23.2.2. By Application

16. Market Structure Analysis

    16.1. Competition Dashboard

    16.2. Competition Benchmarking

    16.3. Market Share Analysis of Top Players

        16.3.1. By Regional

        16.3.2. By Fluid System

        16.3.3. By Application

17. Competition Analysis

    17.1. Competition Deep Dive

        17.1.1. Baker Hughes

            17.1.1.1. Overview

            17.1.1.2. Product Portfolio

            17.1.1.3. Profitability by Market Segments

            17.1.1.4. Sales Footprint

            17.1.1.5. Strategy Overview

                17.1.1.5.1. Marketing Strategy

                17.1.1.5.2. Product Strategy

                17.1.1.5.3. Channel Strategy

        17.1.2. CES Energy Solutions Corp.

            17.1.2.1. Overview

            17.1.2.2. Product Portfolio

            17.1.2.3. Profitability by Market Segments

            17.1.2.4. Sales Footprint

            17.1.2.5. Strategy Overview

                17.1.2.5.1. Marketing Strategy

                17.1.2.5.2. Product Strategy

                17.1.2.5.3. Channel Strategy

        17.1.3. Global Drilling Fluids & Chemicals Limited (GDFCL)

            17.1.3.1. Overview

            17.1.3.2. Product Portfolio

            17.1.3.3. Profitability by Market Segments

            17.1.3.4. Sales Footprint

            17.1.3.5. Strategy Overview

                17.1.3.5.1. Marketing Strategy

                17.1.3.5.2. Product Strategy

                17.1.3.5.3. Channel Strategy

        17.1.4. Halliburton

            17.1.4.1. Overview

            17.1.4.2. Product Portfolio

            17.1.4.3. Profitability by Market Segments

            17.1.4.4. Sales Footprint

            17.1.4.5. Strategy Overview

                17.1.4.5.1. Marketing Strategy

                17.1.4.5.2. Product Strategy

                17.1.4.5.3. Channel Strategy

        17.1.5. National Oilwell Varco, Inc.

            17.1.5.1. Overview

            17.1.5.2. Product Portfolio

            17.1.5.3. Profitability by Market Segments

            17.1.5.4. Sales Footprint

            17.1.5.5. Strategy Overview

                17.1.5.5.1. Marketing Strategy

                17.1.5.5.2. Product Strategy

                17.1.5.5.3. Channel Strategy

        17.1.6. Newpark Resources, Inc.

            17.1.6.1. Overview

            17.1.6.2. Product Portfolio

            17.1.6.3. Profitability by Market Segments

            17.1.6.4. Sales Footprint

            17.1.6.5. Strategy Overview

                17.1.6.5.1. Marketing Strategy

                17.1.6.5.2. Product Strategy

                17.1.6.5.3. Channel Strategy

        17.1.7. Q'Max Solutions Inc.

            17.1.7.1. Overview

            17.1.7.2. Product Portfolio

            17.1.7.3. Profitability by Market Segments

            17.1.7.4. Sales Footprint

            17.1.7.5. Strategy Overview

                17.1.7.5.1. Marketing Strategy

                17.1.7.5.2. Product Strategy

                17.1.7.5.3. Channel Strategy

        17.1.8. Sagemines

            17.1.8.1. Overview

            17.1.8.2. Product Portfolio

            17.1.8.3. Profitability by Market Segments

            17.1.8.4. Sales Footprint

            17.1.8.5. Strategy Overview

                17.1.8.5.1. Marketing Strategy

                17.1.8.5.2. Product Strategy

                17.1.8.5.3. Channel Strategy

        17.1.9. Schlumberger Ltd.

            17.1.9.1. Overview

            17.1.9.2. Product Portfolio

            17.1.9.3. Profitability by Market Segments

            17.1.9.4. Sales Footprint

            17.1.9.5. Strategy Overview

                17.1.9.5.1. Marketing Strategy

                17.1.9.5.2. Product Strategy

                17.1.9.5.3. Channel Strategy

        17.1.10. Scomi Group Bhd

            17.1.10.1. Overview

            17.1.10.2. Product Portfolio

            17.1.10.3. Profitability by Market Segments

            17.1.10.4. Sales Footprint

            17.1.10.5. Strategy Overview

                17.1.10.5.1. Marketing Strategy

                17.1.10.5.2. Product Strategy

                17.1.10.5.3. Channel Strategy

        17.1.11. Secure Energy Services Inc.

            17.1.11.1. Overview

            17.1.11.2. Product Portfolio

            17.1.11.3. Profitability by Market Segments

            17.1.11.4. Sales Footprint

            17.1.11.5. Strategy Overview

                17.1.11.5.1. Marketing Strategy

                17.1.11.5.2. Product Strategy

                17.1.11.5.3. Channel Strategy

        17.1.12. Tetra Technologies, Inc.

            17.1.12.1. Overview

            17.1.12.2. Product Portfolio

            17.1.12.3. Profitability by Market Segments

            17.1.12.4. Sales Footprint

            17.1.12.5. Strategy Overview

                17.1.12.5.1. Marketing Strategy

                17.1.12.5.2. Product Strategy

                17.1.12.5.3. Channel Strategy

        17.1.13. Weatherford International Ltd.

            17.1.13.1. Overview

            17.1.13.2. Product Portfolio

            17.1.13.3. Profitability by Market Segments

            17.1.13.4. Sales Footprint

            17.1.13.5. Strategy Overview

                17.1.13.5.1. Marketing Strategy

                17.1.13.5.2. Product Strategy

                17.1.13.5.3. Channel Strategy

18. Assumptions & Acronyms Used

19. Research Methodology

List of Tables

Table 1: Global Market Value (US$ billion) Forecast by Region, 2018 to 2033

Table 2: Global Market Volume (tons) Forecast by Region, 2018 to 2033

Table 3: Global Market Value (US$ billion) Forecast by Fluid System, 2018 to 2033

Table 4: Global Market Volume (tons) Forecast by Fluid System, 2018 to 2033

Table 5: Global Market Value (US$ billion) Forecast by Application, 2018 to 2033

Table 6: Global Market Volume (tons) Forecast by Application, 2018 to 2033

Table 7: North America Market Value (US$ billion) Forecast by Country, 2018 to 2033

Table 8: North America Market Volume (tons) Forecast by Country, 2018 to 2033

Table 9: North America Market Value (US$ billion) Forecast by Fluid System, 2018 to 2033

Table 10: North America Market Volume (tons) Forecast by Fluid System, 2018 to 2033

Table 11: North America Market Value (US$ billion) Forecast by Application, 2018 to 2033

Table 12: North America Market Volume (tons) Forecast by Application, 2018 to 2033

Table 13: Latin America Market Value (US$ billion) Forecast by Country, 2018 to 2033

Table 14: Latin America Market Volume (tons) Forecast by Country, 2018 to 2033

Table 15: Latin America Market Value (US$ billion) Forecast by Fluid System, 2018 to 2033

Table 16: Latin America Market Volume (tons) Forecast by Fluid System, 2018 to 2033

Table 17: Latin America Market Value (US$ billion) Forecast by Application, 2018 to 2033

Table 18: Latin America Market Volume (tons) Forecast by Application, 2018 to 2033

Table 19: Western Europe Market Value (US$ billion) Forecast by Country, 2018 to 2033

Table 20: Western Europe Market Volume (tons) Forecast by Country, 2018 to 2033

Table 21: Western Europe Market Value (US$ billion) Forecast by Fluid System, 2018 to 2033

Table 22: Western Europe Market Volume (tons) Forecast by Fluid System, 2018 to 2033

Table 23: Western Europe Market Value (US$ billion) Forecast by Application, 2018 to 2033

Table 24: Western Europe Market Volume (tons) Forecast by Application, 2018 to 2033

Table 25: Eastern Europe Market Value (US$ billion) Forecast by Country, 2018 to 2033

Table 26: Eastern Europe Market Volume (tons) Forecast by Country, 2018 to 2033

Table 27: Eastern Europe Market Value (US$ billion) Forecast by Fluid System, 2018 to 2033

Table 28: Eastern Europe Market Volume (tons) Forecast by Fluid System, 2018 to 2033

Table 29: Eastern Europe Market Value (US$ billion) Forecast by Application, 2018 to 2033

Table 30: Eastern Europe Market Volume (tons) Forecast by Application, 2018 to 2033

Table 31: South Asia and Pacific Market Value (US$ billion) Forecast by Country, 2018 to 2033

Table 32: South Asia and Pacific Market Volume (tons) Forecast by Country, 2018 to 2033

Table 33: South Asia and Pacific Market Value (US$ billion) Forecast by Fluid System, 2018 to 2033

Table 34: South Asia and Pacific Market Volume (tons) Forecast by Fluid System, 2018 to 2033

Table 35: South Asia and Pacific Market Value (US$ billion) Forecast by Application, 2018 to 2033

Table 36: South Asia and Pacific Market Volume (tons) Forecast by Application, 2018 to 2033

Table 37: East Asia Market Value (US$ billion) Forecast by Country, 2018 to 2033

Table 38: East Asia Market Volume (tons) Forecast by Country, 2018 to 2033

Table 39: East Asia Market Value (US$ billion) Forecast by Fluid System, 2018 to 2033

Table 40: East Asia Market Volume (tons) Forecast by Fluid System, 2018 to 2033

Table 41: East Asia Market Value (US$ billion) Forecast by Application, 2018 to 2033

Table 42: East Asia Market Volume (tons) Forecast by Application, 2018 to 2033

Table 43: Middle East and Africa Market Value (US$ billion) Forecast by Country, 2018 to 2033

Table 44: Middle East and Africa Market Volume (tons) Forecast by Country, 2018 to 2033

Table 45: Middle East and Africa Market Value (US$ billion) Forecast by Fluid System, 2018 to 2033

Table 46: Middle East and Africa Market Volume (tons) Forecast by Fluid System, 2018 to 2033

Table 47: Middle East and Africa Market Value (US$ billion) Forecast by Application, 2018 to 2033

Table 48: Middle East and Africa Market Volume (tons) Forecast by Application, 2018 to 2033

List of Charts

Figure 1: Global Market Value (US$ billion) by Fluid System, 2023 to 2033

Figure 2: Global Market Value (US$ billion) by Application, 2023 to 2033

Figure 3: Global Market Value (US$ billion) by Region, 2023 to 2033

Figure 4: Global Market Value (US$ billion) Analysis by Region, 2018 to 2033

Figure 5: Global Market Volume (tons) Analysis by Region, 2018 to 2033

Figure 6: Global Market Value Share (%) and BPS Analysis by Region, 2023 to 2033

Figure 7: Global Market Y-o-Y Growth (%) Projections by Region, 2023 to 2033

Figure 8: Global Market Value (US$ billion) Analysis by Fluid System, 2018 to 2033

Figure 9: Global Market Volume (tons) Analysis by Fluid System, 2018 to 2033

Figure 10: Global Market Value Share (%) and BPS Analysis by Fluid System, 2023 to 2033

Figure 11: Global Market Y-o-Y Growth (%) Projections by Fluid System, 2023 to 2033

Figure 12: Global Market Value (US$ billion) Analysis by Application, 2018 to 2033

Figure 13: Global Market Volume (tons) Analysis by Application, 2018 to 2033

Figure 14: Global Market Value Share (%) and BPS Analysis by Application, 2023 to 2033

Figure 15: Global Market Y-o-Y Growth (%) Projections by Application, 2023 to 2033

Figure 16: Global Market Attractiveness by Fluid System, 2023 to 2033

Figure 17: Global Market Attractiveness by Application, 2023 to 2033

Figure 18: Global Market Attractiveness by Region, 2023 to 2033

Figure 19: North America Market Value (US$ billion) by Fluid System, 2023 to 2033

Figure 20: North America Market Value (US$ billion) by Application, 2023 to 2033

Figure 21: North America Market Value (US$ billion) by Country, 2023 to 2033

Figure 22: North America Market Value (US$ billion) Analysis by Country, 2018 to 2033

Figure 23: North America Market Volume (tons) Analysis by Country, 2018 to 2033

Figure 24: North America Market Value Share (%) and BPS Analysis by Country, 2023 to 2033

Figure 25: North America Market Y-o-Y Growth (%) Projections by Country, 2023 to 2033

Figure 26: North America Market Value (US$ billion) Analysis by Fluid System, 2018 to 2033

Figure 27: North America Market Volume (tons) Analysis by Fluid System, 2018 to 2033

Figure 28: North America Market Value Share (%) and BPS Analysis by Fluid System, 2023 to 2033

Figure 29: North America Market Y-o-Y Growth (%) Projections by Fluid System, 2023 to 2033

Figure 30: North America Market Value (US$ billion) Analysis by Application, 2018 to 2033

Figure 31: North America Market Volume (tons) Analysis by Application, 2018 to 2033

Figure 32: North America Market Value Share (%) and BPS Analysis by Application, 2023 to 2033

Figure 33: North America Market Y-o-Y Growth (%) Projections by Application, 2023 to 2033

Figure 34: North America Market Attractiveness by Fluid System, 2023 to 2033

Figure 35: North America Market Attractiveness by Application, 2023 to 2033

Figure 36: North America Market Attractiveness by Country, 2023 to 2033

Figure 37: Latin America Market Value (US$ billion) by Fluid System, 2023 to 2033

Figure 38: Latin America Market Value (US$ billion) by Application, 2023 to 2033

Figure 39: Latin America Market Value (US$ billion) by Country, 2023 to 2033

Figure 40: Latin America Market Value (US$ billion) Analysis by Country, 2018 to 2033

Figure 41: Latin America Market Volume (tons) Analysis by Country, 2018 to 2033

Figure 42: Latin America Market Value Share (%) and BPS Analysis by Country, 2023 to 2033

Figure 43: Latin America Market Y-o-Y Growth (%) Projections by Country, 2023 to 2033

Figure 44: Latin America Market Value (US$ billion) Analysis by Fluid System, 2018 to 2033

Figure 45: Latin America Market Volume (tons) Analysis by Fluid System, 2018 to 2033

Figure 46: Latin America Market Value Share (%) and BPS Analysis by Fluid System, 2023 to 2033

Figure 47: Latin America Market Y-o-Y Growth (%) Projections by Fluid System, 2023 to 2033

Figure 48: Latin America Market Value (US$ billion) Analysis by Application, 2018 to 2033

Figure 49: Latin America Market Volume (tons) Analysis by Application, 2018 to 2033

Figure 50: Latin America Market Value Share (%) and BPS Analysis by Application, 2023 to 2033

Figure 51: Latin America Market Y-o-Y Growth (%) Projections by Application, 2023 to 2033

Figure 52: Latin America Market Attractiveness by Fluid System, 2023 to 2033

Figure 53: Latin America Market Attractiveness by Application, 2023 to 2033

Figure 54: Latin America Market Attractiveness by Country, 2023 to 2033

Figure 55: Western Europe Market Value (US$ billion) by Fluid System, 2023 to 2033

Figure 56: Western Europe Market Value (US$ billion) by Application, 2023 to 2033

Figure 57: Western Europe Market Value (US$ billion) by Country, 2023 to 2033

Figure 58: Western Europe Market Value (US$ billion) Analysis by Country, 2018 to 2033

Figure 59: Western Europe Market Volume (tons) Analysis by Country, 2018 to 2033

Figure 60: Western Europe Market Value Share (%) and BPS Analysis by Country, 2023 to 2033

Figure 61: Western Europe Market Y-o-Y Growth (%) Projections by Country, 2023 to 2033

Figure 62: Western Europe Market Value (US$ billion) Analysis by Fluid System, 2018 to 2033

Figure 63: Western Europe Market Volume (tons) Analysis by Fluid System, 2018 to 2033

Figure 64: Western Europe Market Value Share (%) and BPS Analysis by Fluid System, 2023 to 2033

Figure 65: Western Europe Market Y-o-Y Growth (%) Projections by Fluid System, 2023 to 2033

Figure 66: Western Europe Market Value (US$ billion) Analysis by Application, 2018 to 2033

Figure 67: Western Europe Market Volume (tons) Analysis by Application, 2018 to 2033

Figure 68: Western Europe Market Value Share (%) and BPS Analysis by Application, 2023 to 2033

Figure 69: Western Europe Market Y-o-Y Growth (%) Projections by Application, 2023 to 2033

Figure 70: Western Europe Market Attractiveness by Fluid System, 2023 to 2033

Figure 71: Western Europe Market Attractiveness by Application, 2023 to 2033

Figure 72: Western Europe Market Attractiveness by Country, 2023 to 2033

Figure 73: Eastern Europe Market Value (US$ billion) by Fluid System, 2023 to 2033

Figure 74: Eastern Europe Market Value (US$ billion) by Application, 2023 to 2033

Figure 75: Eastern Europe Market Value (US$ billion) by Country, 2023 to 2033

Figure 76: Eastern Europe Market Value (US$ billion) Analysis by Country, 2018 to 2033

Figure 77: Eastern Europe Market Volume (tons) Analysis by Country, 2018 to 2033

Figure 78: Eastern Europe Market Value Share (%) and BPS Analysis by Country, 2023 to 2033

Figure 79: Eastern Europe Market Y-o-Y Growth (%) Projections by Country, 2023 to 2033

Figure 80: Eastern Europe Market Value (US$ billion) Analysis by Fluid System, 2018 to 2033

Figure 81: Eastern Europe Market Volume (tons) Analysis by Fluid System, 2018 to 2033

Figure 82: Eastern Europe Market Value Share (%) and BPS Analysis by Fluid System, 2023 to 2033

Figure 83: Eastern Europe Market Y-o-Y Growth (%) Projections by Fluid System, 2023 to 2033

Figure 84: Eastern Europe Market Value (US$ billion) Analysis by Application, 2018 to 2033

Figure 85: Eastern Europe Market Volume (tons) Analysis by Application, 2018 to 2033

Figure 86: Eastern Europe Market Value Share (%) and BPS Analysis by Application, 2023 to 2033

Figure 87: Eastern Europe Market Y-o-Y Growth (%) Projections by Application, 2023 to 2033

Figure 88: Eastern Europe Market Attractiveness by Fluid System, 2023 to 2033

Figure 89: Eastern Europe Market Attractiveness by Application, 2023 to 2033

Figure 90: Eastern Europe Market Attractiveness by Country, 2023 to 2033

Figure 91: South Asia and Pacific Market Value (US$ billion) by Fluid System, 2023 to 2033

Figure 92: South Asia and Pacific Market Value (US$ billion) by Application, 2023 to 2033

Figure 93: South Asia and Pacific Market Value (US$ billion) by Country, 2023 to 2033

Figure 94: South Asia and Pacific Market Value (US$ billion) Analysis by Country, 2018 to 2033

Figure 95: South Asia and Pacific Market Volume (tons) Analysis by Country, 2018 to 2033

Figure 96: South Asia and Pacific Market Value Share (%) and BPS Analysis by Country, 2023 to 2033

Figure 97: South Asia and Pacific Market Y-o-Y Growth (%) Projections by Country, 2023 to 2033

Figure 98: South Asia and Pacific Market Value (US$ billion) Analysis by Fluid System, 2018 to 2033

Figure 99: South Asia and Pacific Market Volume (tons) Analysis by Fluid System, 2018 to 2033

Figure 100: South Asia and Pacific Market Value Share (%) and BPS Analysis by Fluid System, 2023 to 2033

Figure 101: South Asia and Pacific Market Y-o-Y Growth (%) Projections by Fluid System, 2023 to 2033

Figure 102: South Asia and Pacific Market Value (US$ billion) Analysis by Application, 2018 to 2033

Figure 103: South Asia and Pacific Market Volume (tons) Analysis by Application, 2018 to 2033

Figure 104: South Asia and Pacific Market Value Share (%) and BPS Analysis by Application, 2023 to 2033

Figure 105: South Asia and Pacific Market Y-o-Y Growth (%) Projections by Application, 2023 to 2033

Figure 106: South Asia and Pacific Market Attractiveness by Fluid System, 2023 to 2033

Figure 107: South Asia and Pacific Market Attractiveness by Application, 2023 to 2033

Figure 108: South Asia and Pacific Market Attractiveness by Country, 2023 to 2033

Figure 109: East Asia Market Value (US$ billion) by Fluid System, 2023 to 2033

Figure 110: East Asia Market Value (US$ billion) by Application, 2023 to 2033

Figure 111: East Asia Market Value (US$ billion) by Country, 2023 to 2033

Figure 112: East Asia Market Value (US$ billion) Analysis by Country, 2018 to 2033

Figure 113: East Asia Market Volume (tons) Analysis by Country, 2018 to 2033

Figure 114: East Asia Market Value Share (%) and BPS Analysis by Country, 2023 to 2033

Figure 115: East Asia Market Y-o-Y Growth (%) Projections by Country, 2023 to 2033

Figure 116: East Asia Market Value (US$ billion) Analysis by Fluid System, 2018 to 2033

Figure 117: East Asia Market Volume (tons) Analysis by Fluid System, 2018 to 2033

Figure 118: East Asia Market Value Share (%) and BPS Analysis by Fluid System, 2023 to 2033

Figure 119: East Asia Market Y-o-Y Growth (%) Projections by Fluid System, 2023 to 2033

Figure 120: East Asia Market Value (US$ billion) Analysis by Application, 2018 to 2033

Figure 121: East Asia Market Volume (tons) Analysis by Application, 2018 to 2033

Figure 122: East Asia Market Value Share (%) and BPS Analysis by Application, 2023 to 2033

Figure 123: East Asia Market Y-o-Y Growth (%) Projections by Application, 2023 to 2033

Figure 124: East Asia Market Attractiveness by Fluid System, 2023 to 2033

Figure 125: East Asia Market Attractiveness by Application, 2023 to 2033

Figure 126: East Asia Market Attractiveness by Country, 2023 to 2033

Figure 127: Middle East and Africa Market Value (US$ billion) by Fluid System, 2023 to 2033

Figure 128: Middle East and Africa Market Value (US$ billion) by Application, 2023 to 2033

Figure 129: Middle East and Africa Market Value (US$ billion) by Country, 2023 to 2033

Figure 130: Middle East and Africa Market Value (US$ billion) Analysis by Country, 2018 to 2033

Figure 131: Middle East and Africa Market Volume (tons) Analysis by Country, 2018 to 2033

Figure 132: Middle East and Africa Market Value Share (%) and BPS Analysis by Country, 2023 to 2033

Figure 133: Middle East and Africa Market Y-o-Y Growth (%) Projections by Country, 2023 to 2033

Figure 134: Middle East and Africa Market Value (US$ billion) Analysis by Fluid System, 2018 to 2033

Figure 135: Middle East and Africa Market Volume (tons) Analysis by Fluid System, 2018 to 2033

Figure 136: Middle East and Africa Market Value Share (%) and BPS Analysis by Fluid System, 2023 to 2033

Figure 137: Middle East and Africa Market Y-o-Y Growth (%) Projections by Fluid System, 2023 to 2033

Figure 138: Middle East and Africa Market Value (US$ billion) Analysis by Application, 2018 to 2033

Figure 139: Middle East and Africa Market Volume (tons) Analysis by Application, 2018 to 2033

Figure 140: Middle East and Africa Market Value Share (%) and BPS Analysis by Application, 2023 to 2033

Figure 141: Middle East and Africa Market Y-o-Y Growth (%) Projections by Application, 2023 to 2033

Figure 142: Middle East and Africa Market Attractiveness by Fluid System, 2023 to 2033

Figure 143: Middle East and Africa Market Attractiveness by Application, 2023 to 2033

Figure 144: Middle East and Africa Market Attractiveness by Country, 2023 to 2033

Recommendations

Chemicals & Materials

Welding Materials Market

Published : August 2023

Chemicals & Materials

Cold Gas Spray Coating Market

Published : August 2023

Chemicals & Materials

Drilling Polymers Market

Published : August 2023

Chemicals & Materials

Onshore Drilling Fluids Market

Published : January 2023

Explore Chemicals & Materials Insights

View Reports

Drilling and Completion Fluids Market