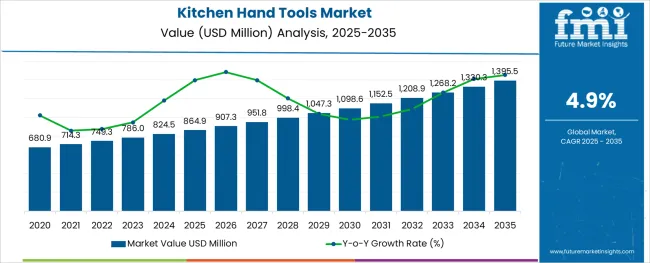
The Kitchen Hand Tools Market is estimated to be valued at USD 864.9 million in 2025 and is projected to reach USD 1395.5 million by 2035, registering a compound annual growth rate (CAGR) of 4.9% over the forecast period.
The alginic acid market is undergoing consistent growth, propelled by rising demand from food processing, pharmaceutical formulations, and cosmetic applications. A growing focus on natural and sustainable ingredients in manufacturing processes has positioned alginic acid as a preferred biopolymer across industries.
The market is further supported by its diverse functional benefits, including water retention, gelling, and stabilizing properties, which make it indispensable in high-performance formulations. Increased regulatory acceptance of alginates as safe additives and the push towards cleaner labeling in food and personal care products have reinforced their adoption.
Ongoing innovation in extraction technologies and the utilization of algae as a renewable resource are paving the way for cost-effective production and expanded applications, ensuring sustained market expansion in the coming years.
The market is segmented by Tool Type, Buyer Type, and Sales Channel and region. By Tool Type, the market is divided into Spatula, Scrapper, Skimmer, Tongs, Grater, and Others. In terms of Buyer Type, the market is classified into Residential / Household and Commercial. Based on Sales Channel, the market is segmented into eCommerce Platforms, Kitchen Speciality Retailer, Modern Trade, and Other Channels. Regionally, the market is classified into North America, Latin America, Western Europe, Eastern Europe, Balkan & Baltic Countries, Russia & Belarus, Central Asia, East Asia, South Asia & Pacific, and the Middle East & Africa.
The market is segmented by Tool Type, Buyer Type, and Sales Channel and region. By Tool Type, the market is divided into Spatula, Scrapper, Skimmer, Tongs, Grater, and Others. In terms of Buyer Type, the market is classified into Residential / Household and Commercial. Based on Sales Channel, the market is segmented into eCommerce Platforms, Kitchen Speciality Retailer, Modern Trade, and Other Channels. Regionally, the market is classified into North America, Latin America, Western Europe, Eastern Europe, Balkan & Baltic Countries, Russia & Belarus, Central Asia, East Asia, South Asia & Pacific, and the Middle East & Africa.
When segmented by salts, sodium alginate is expected to command 27.5% of the market revenue in 2025, marking it as the leading subsegment in this category. This leadership has been driven by its superior solubility, ease of incorporation into formulations, and versatility in a wide range of applications.
Its ability to form stable gels and maintain viscosity under varying conditions has made it highly sought after in both food and pharmaceutical sectors. Manufacturers have prioritized sodium alginate due to its consistent performance, cost-effectiveness, and regulatory acceptance, which have collectively strengthened its position.
The segment’s prominence has also been enhanced by its adaptability to evolving consumer preferences for plant-derived and sustainable ingredients, reinforcing its market share.
Segmented by end user industry, the food industry is projected to hold 33.0% of the market revenue in 2025, positioning it as the most prominent sector. This dominance has been shaped by the industry’s increasing reliance on alginic acid and its derivatives to deliver desirable textures, stabilize emulsions, and improve shelf life of processed foods.
As consumer demand for clean label and natural additives has intensified, the food sector has responded by integrating alginates into bakery, dairy, and confectionery products. Enhanced production efficiency and compliance with food safety standards have further encouraged widespread use.
The segment’s leadership has also been supported by product differentiation strategies where alginates contribute to premium quality and innovation, securing their role in modern food formulations.
When analyzed by functionality, thickening agents are forecast to account for 29.0% of the market revenue in 2025, establishing themselves as the dominant functional category. This preeminence has been underpinned by the growing need for consistent texture and viscosity in a wide array of end products.
Alginic acid’s natural origin and high efficiency in creating uniform, stable thickness without altering taste or color have solidified its appeal. The demand for thickeners in both edible and topical applications has expanded, with manufacturers leveraging its rheological properties to meet performance and regulatory requirements.
The functionality’s leading share has also been reinforced by the ability to deliver cost savings through lower dosages and its compatibility with other ingredients, securing its position as an indispensable component in formulation strategies.
In the first half of 2025, the global market for kitchen hand tools increased by 3.1%. Though not equally distributed throughout all regions, this growth is stronger in developing markets, where it is predicted to reach at the end of 2025 by 4.9%.
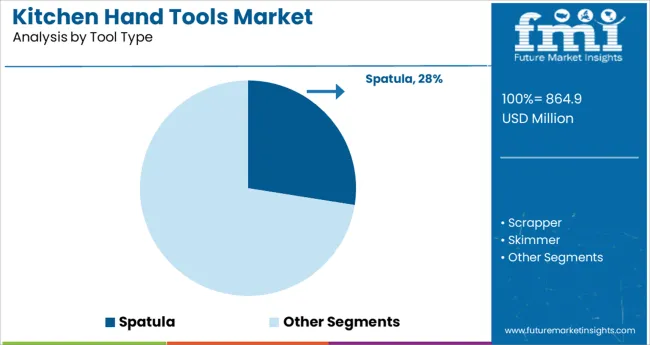
Recent research has shown the top tool type, i.e. spatula, to grow at a CAGR worth 3.7% in the year 2020 to 2025. The market during the period 2025 to 2035 registered a CAGR of 5.3%. The primary use of commercial equipment is to prepare food for large numbers of people.
Consequently, market players manufacture products that are durable, easy to operate, and robust. From 2025 to 2025, the total commercial buyer market is estimated to grow at a CAGR of 4.6%. The market during the period 2020 to 2025 registered a CAGR of 3.3%.
Kitchen Hand Tools Market:
| Attributes | Kitchen Hand Tools Market |
|---|---|
| CAGR (2025 to 2035) | 4.9% |
| Market Value (2035) | USD 998.39 Million |
| Growth Factor | Energy-efficient hand tools and government efforts to reduce electricity consumption |
| Opportunity | An array of distinctive colors in the kitchen, and a sense of style |
| Key Trends | Using different types of kitchen hand tools for cooking different cuisines. |
Smart Appliances Market:
| Attributes | Smart Appliances Market |
|---|---|
| CAGR (2025 to 2035) | 17.7% |
| Market Value(2035) | USD 76.4 Billion |
| Growth Factor | The rising availability of wireless connectivity solutions like Bluetooth and Wi-Fi |
| Opportunity | Integration of new technologies, such as in-built AI, with smart appliances. |
| Key Trends | On-fridge displays let users keep track of food stored in their refrigerators and sync the information to their smartphones. |
Hand Tools & Woodworking Tools Market:
| Attributes | Hand Tools & Woodworking Tools Market |
|---|---|
| CAGR (2025 to 2035) | 4% |
| Market Value (2035) | USD 11.14 Billion |
| Growth Factor | Construction and other infrastructure industries are developing rapidly and the demand for hand tools is increasing; therefore, hand tool manufacturers are innovating their products to meet the needs of the market. |
| Opportunity | The use of hand tools might increase with an increase in the automation of hand tools to reduce physical work. |
| Key Trends | A surge in construction and infrastructure activities as well as the evolution of the hand tool industry |
Consumers in emerging nations are increasingly demanding products that allow them to show off their unique sense of style in the kitchen, and a range of distinctive color choices, as well as higher disposable incomes and changing lifestyles of people in emerging nations, which is leading to an increase in consumer demand for these items.
According to FMI's analysis, spatulas account for the highest market share by tool type in the global kitchen hand tools market. Spatulas, as kitchen tools with a specialized purpose, are not likely to find widespread use in low-income countries. The manufacturers in the global spatulas market are unlikely to generate much revenue from these regions. This is anticipated to be a potential constraint for the market. At present, this segment is moving forward at a moderate pace, recording a CAGR of 5.3%. The segment accounted for a historical CAGR of 3.7% during the period 2020 to 2025. Further, consumers are not aware of the benefits spatulas offer, which is also expected to affect the market demand for spatulas.
The kitchen hand tools market is segmented by buyer type into commercial and residential households. Currently, the commercial segment is anticipated to expand at a slow pace, registering a CAGR of 4.6%. The segment accounted for a historical CAGR of 3.3% during the base period of 2020 to 2025. A shift toward a low-calorie and healthy diet among the youth population is expected to positively influence the demand for nutritious food chains and associated commercial kitchen hand tools.
Offline shopping dominates the market, accounting for a larger percentage of revenue. Being a traditional method of shopping and having leading manufacturers such as Inter Ikea Group and Home centers with a wide variety of products and discounts are the major factors driving the segment. Further, the perception among the consumer group that online retailers can't deliver fragile items such as ceramic and glass kitchen tools is one of the reasons for the segment's growth.
Internet penetration is increasing in rural areas, online portals deliver items faster, and replacement options are driving demand. As a result of easy access and doorstep service, the young working consumer group prefers to buy online over offline due to their hectic schedules.
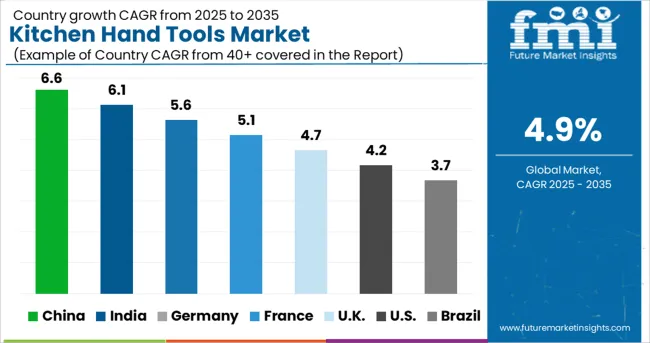
North America currently dominates the global kitchen hand tools market, and this trend is expected to continue in the coming years. In North America, the USA holds a large share of the market and is expected to observe positive growth in the next few years. The United Kingdom currently holds the largest number of shares and has registered a market valuation of USD 864.9 million in 2025. The USA kitchen hand tools market is projected to reach a valuation of USD 1395.5 million by the end of 2035
CAGR for 2025 to 2035: 5.3%
Historical CAGR (2020 to 2025): 3.8%
The rising purchasing power of consumers is expected to contribute to the growth of the North American kitchen hand tools market in the coming few years. Technological advancements in the food processing industry increased Research and Development (R&D) activities in the food and beverage industry, and rising health concerns are driving the regional market growth. Restaurants, hotels, and food businesses are expected to grow in this region as the population increases.
The North American kitchen hand tool market is also driven by the growing use of different types of kitchen tools in commercial spaces and the early adoption of technologically advanced tools.
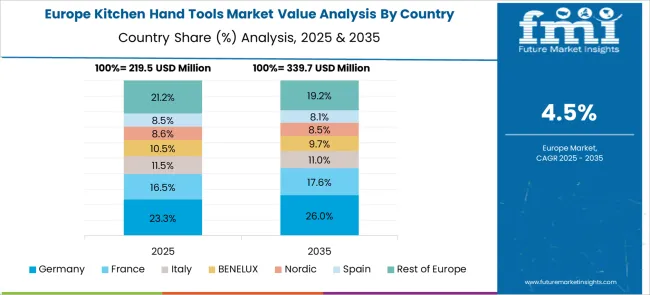
Europe is identified to hold a significant market share in the kitchen hand tools market. Currently, the United Kingdom is the leading country and is expected to account for a market valuation of USD 28.47 million in 2025, advancing at a moderate-paced CAGR of 3.1%.
It is anticipated that the market valuation will surpass USD 75.9 Million in 2035, with a CAGR of 6.4%. The market in the region is driven by the high usage of various types of kitchen hand tools and the high spending power of the consumer group.
As a result of high demand from developing countries such as India and China, the Asia Pacific market is expected to continue to flourish over the forecast period. Currently, China is the leading country in the pacific region and is expected to account for a market valuation of USD 189.75 million by 2035, advancing at a moderate-paced CAGR of 6.4% followed by Japan with a market valuation of USD 92.34 million by 2035 with a CAGR of 5%.
Changing lifestyles and an increase in disposable income are expected to drive the region's market growth over the forecast period. There are also numerous prominent factors boosting the market growth in the region, such as an increasing number of households due to a growing population and rapid development. As the trend of traveling to destinations such as Thailand and Malaysia continues to grow, the region is experiencing an increase in hotels and resorts.
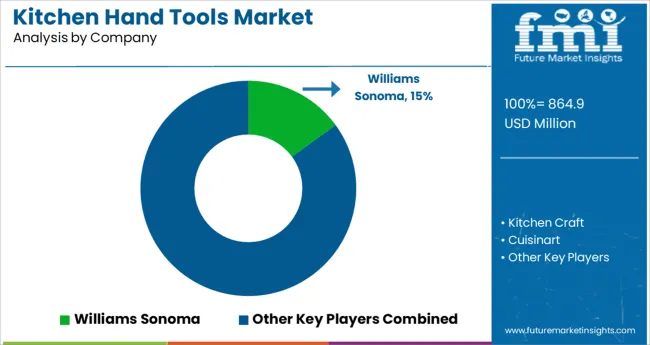
With a massive number of local and international players operating worldwide, the global market for kitchen hand tools is extremely competitive. Several new players are entering the market and enhancing their penetration across the globe as a result of the increasing number of growth opportunities available.
Among the leading players in the kitchen hand tools market, the leading players are concentrating on the development of brand-new products and innovations, strengthening competition among the players. In addition to this, these players are investing heavily in marketing and advertising activities in order to attract a large number of consumers.
Additionally, small companies are collaborating and being acquired, which is further accelerating market growth. As an example, companies are coming up with innovative designs and smart kitchen ideas. Manufacturing companies are investing heavily in research and development to gain an edge over their competitors.
| Attribute | Details |
|---|---|
| Forecast Period | 2025 to 2035 |
| Historical Data Available for | 2020 to 2025 |
| Market Analysis | billion for Value and MT for Volume |
| Key Regions Covered | North America; Latin America; Europe; East Asia; South Asia; Oceania; and the Middle East & Africa |
| Key Countries Covered | The USA, Canada, Brazil, Mexico, Chile, Peru, Germany, The United Kingdom, Spain, Italy, France, Russia, Poland, China, India, Japan, Australia, New Zealand, GCC Countries, North Africa, South Africa, and Turkey |
| Key Segments Covered | Tool Type, Buyer Type, Sales Channel, and Region |
| Key Companies Profiled | Williams Sonoma; Kitchen Craft; Cuisinart; KitchenAid; OXO; Betty Crocker; Cuisinart; Cuisipro; Culinare; Farberware; Gourmet; IKEA; Maxam; Premier |
| Report Coverage | Market Forecast, Company Share Analysis, Competition Intelligence, DROT Analysis, Market Dynamics and Challenges, and Strategic Growth Initiatives |
| Customization & Pricing | Available upon Request |
The global kitchen hand tools market is estimated to be valued at USD 864.9 million in 2025.
It is projected to reach USD 1,395.5 million by 2035.
The market is expected to grow at a 4.9% CAGR between 2025 and 2035.
The key product types are spatula, scrapper, skimmer, tongs, grater and others.
residential / household segment is expected to dominate with a 62.0% industry share in 2025.


Full Research Suite comprises of:
Market outlook & trends analysis
Interviews & case studies
Strategic recommendations
Vendor profiles & capabilities analysis
5-year forecasts
8 regions and 60+ country-level data splits
Market segment data splits
12 months of continuous data updates
DELIVERED AS:
PDF EXCEL ONLINE
Kitchen/ Toilet Roll Converting Machines Market Size and Share Forecast Outlook 2025 to 2035
Kitchen Trailers Market Analysis - Size, Share, and Forecast Outlook 2025 to 2035
Kitchen Hood System Market Size and Share Forecast Outlook 2025 to 2035
Kitchen Hood Market Insights – Trends & Growth Forecast 2025 to 2035
Kitchen Islands and Carts Market
Kitchen Storage Market
Kitchen & Dining Furniture Market
Kitchen Tools and Accessories Market Size and Share Forecast Outlook 2025 to 2035
Toy Kitchens and Play Food Market Size and Share Forecast Outlook 2025 to 2035
MEA Kitchen Storage Market Growth – Trends & Forecast 2025 to 2035
Smart Kitchen Appliances Market Size and Share Forecast Outlook 2025 to 2035
Cloud Kitchen Market Trends – Size, Demand & Forecast 2025-2035
Small Kitchen Appliances Market Growth – Demand & Trends to 2033
Outdoor Kitchen Appliances Market Size and Share Forecast Outlook 2025 to 2035
Modular Kitchen Baskets Market Size and Share Forecast Outlook 2025 to 2035
Built-In Kitchen Appliance Market Outlook – Size, Share & Innovations 2025 to 2035
Household Kitchen Appliances Market Size and Share Forecast Outlook 2025 to 2035
Table and Kitchen Linen Market Size and Share Forecast Outlook 2025 to 2035
Commercial Kitchen Ventilation System Market Growth - Trends & Forecast 2025 to 2035
Smart Built-In Kitchen Appliance Market Size and Share Forecast Outlook 2025 to 2035

Thank you!
You will receive an email from our Business Development Manager. Please be sure to check your SPAM/JUNK folder too.
Chat With
MaRIA