Reports

- Global Locations -

Headquarters

Future Market Insights, Inc.

Christiana Corporate, 200
Continental Drive, Suite 401,
Newark, Delaware - 19713,
United States

T: +1-845-579-5705

Americas

Future Market Insights, Inc.

616 Corporate Way, Suite 2-9018,
Valley Cottage, NY 10989, United States

T: +1-347-918-3531

MEA

Future Market Insights

1602-6 Jumeirah Bay X2 Tower, Plot No: JLT-PH2-X2A,
Jumeirah Lakes Towers, Dubai,
United Arab Emirates

Europe

Future Market Insights

3rd Floor, 207 Regent Street,
W1B 3HH London
United Kingdom

T: + 44 (0) 20 8123 9659
D: +44 (0) 20 3287 4268

Asia Pacific

Future Market Insights

IndiaLand Global Tech Park, Unit UG-1, Behind Grand HighStreet, Phase 1, Hinjawadi, MH, Pune – 411057, India

Kitchen Hood System Market Outlook (2023 to 2033)

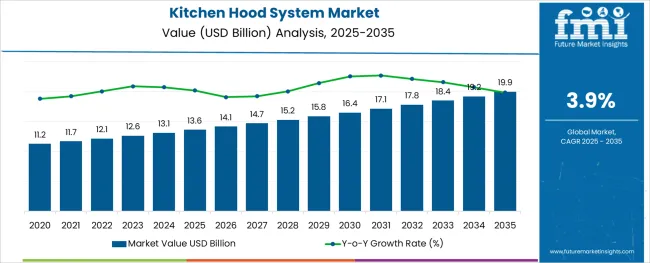
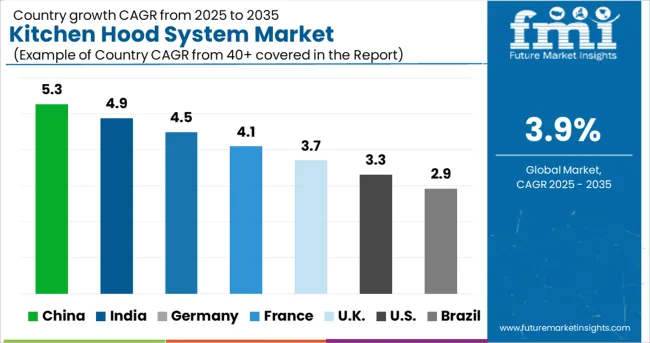
The global kitchen hood system market is estimated to progress at a moderate CAGR of 3.9% during the forecast period. This market will be worth US$ 12.58 billion in 2023 based on its current valuation. Market analysts of Future Market Insight predict that the sales of kitchen hood systems will generate US$ 18.45 billion in revenue by 2033. In the base year, when the market was expanding at a slow-paced CAGR of 1.5%, analysts from Future Market Insights revealed a historical market valuation of US$ 12.13 billion.

One crucial component of the kitchen is ventilation. As a consequence, the kitchen hood system market is growing as more customers from the commercial and residential sectors adopt kitchen hood systems. The following reasons encourage its expansion:

  • Kitchen hood systems effectively remove unwelcome particles from the house and away from everyone using the kitchen, lowering the quantity of hazardous air and thwarting the development of bacteria, germs, and even mould.
  • The kitchen hood systems are made to exhaust gases and odours from the house in addition to providing useful filtration assistance for the burner.
  • Customers are now spending more on modular house constructions due to the increased need for effective storage and space-saving that maximizes floor utilization in compact places.
  • Kitchen hoods are also in charge of reducing any indoor carbon monoxide levels that could exist. Carbon monoxide poses several health risks, and insufficient ventilation will only make matters worse if there are already existing issues.
  • Modern range kitchen hood systems are being installed by consumers in smart kitchens to improve aesthetics and comfort in the house as a whole.
  • Commercial food establishments are becoming more prevalent around the world, particularly in emerging countries, as a result of the expanding out-of-home dining habit.
  • Owing to the increasing urbanization, strict guidelines from many regional governments governing sanitation and hygiene in restaurants and food chains have made the installation of any kind of kitchen ventilation mandatory.
  • The trend toward overindulging in luxury and leading-edge commodities is growing.
  • Lifestyle changes brought on by hectic work schedules, in addition to an increase in the number of motels and fast-food franchises
  • Smart kitchen hoods with remote connectivity offer convenience to customers in addition to being energy and environmentally sustainable.
  • The addition of fresh forms and dimensions along with additional functions to enhance functionality.
  • The increasing inclination of consumers for online shopping.

Despite the significant growth that is anticipated for the kitchen hood system market, expert researchers of Future Market Insight have identified a few factors that might restrain the expansion of the market during the forecast period. Factors that currently hinder the market are listed below:

  • Sales of upgraded kitchen hoods may be somewhat constrained by their high initial cost.
  • Variability and unpredictability in raw materials, in addition to the availability of alternatives such as kitchen exhaust fans.
  • Due to their affordability and capability to efficiently remove odours, steam, and smoke from the kitchen, window fans are largely becoming popular in domestic applications.
  • Growing global consciousness of the greenhouse effect in addition to a sharp upswing in pollution.

Don't pay for what you don't need

Customize your report by selecting specific countries or regions and save 30%!

Mounting Demand for Smart Kitchen Formats is Generating Market Buzz for Kitchen Hood Systems - A Snowball Effect

Appliances for the home kitchen are becoming quite popular in several areas throughout the world. The use of technologically advanced kitchen gadgets like kitchen exhaust hoods has been greatly influenced by busy lives. Manufacturers of kitchen hood systems are attempting to gain market share through social media. More customers are drawn in by various promotions, campaigns, commercials, and deals.

The developers of kitchen hood systems are making investments in new product research and development. This can be attributed to the existence of hydraulic efficiency requirements, such as those about venting and ventilation systems for ovens, as well as restrictions for fuel combustion emissions associated with operations. Manufacturers now carve sweeping patterns into marble as part of interior decoration, combining the kitchen hood and backsplash with a startling sinuousness.

By introducing technologically advanced kitchen hood systems that are collected with the Internet of Things, manufacturers are catering to consumers. Global manufacturers are incorporating up-to-date technology like noise reduction, internet connectivity, and the inclusion of sensors like infrared and optical in hoods. Innovative goods including self-cleaning appliances, transportable kitchen hoods, and UV protection hoods are being developed by manufacturers. Smart home kitchen appliances are anticipated to gain appeal during the forecast year.

Report Attribute Details
Kitchen Hood System Market Value (2023) US$ 12.58 Billion
Kitchen Hood System Market Anticipated Value (2033) US$ 18.45 Billion
Kitchen Hood System Market Projected Growth Rate (2023 to 2033) 3.9%
Kitchen Hood System Market Historical Growth Rate (2017 to 2022) 1.5%

Sights of the Historical Market Scenario and Current Growth Indicators

After conducting a thorough market analysis, analysts from Future Market Insight found that the kitchen hood system market has witnessed significant growth in recent years. From 1.5% between 2018 and 2022 to 3.9% between 2023 and 2033, the CAGR of this market climbed progressively. The overall market value increased by around US$ 449.1 million from 2022 to 2023.

Major factors influencing the current global expansion of restaurants and hotels, as well as rapid urbanization in developing nations, are what dominate the kitchen hood system market. From fast food to dining and quick service, many nations and cultures have distinct types of service. The hotel business is expanding constantly. The expansion of the hotel sector is being fueled by an increase in consumer buying power, a need for distinctive travel experiences, and an increase in the number of virtual influences. As a result, an expanding number of hotels are driving the adoption of kitchen hood systems.

Another important element driving the growth of the kitchen hood system market is the changing lifestyles of people around the globe. Consumers now demand wirelessly accessible smart home appliances with cutting-edge features like sensor devices for performance enhancement. On the other hand, the introduction of strict hygiene and cleanliness standards in restaurants and other food chains mandating the installation of kitchen cooking hoods.

Over time, people have identified the importance of installing kitchen hood systems because of the advantages it offers, including heat reduction, clean air maintenance, greater safety, and consumer awareness of the value of maintaining a clean and healthy cooking environment. The growth of e-commerce retail channels, increasing disposable income, and successful strategic marketing activities are further factors that support the kitchen hood system market. Additionally, during the foreseeable period, kitchen hood system market participants will have access to considerable prospects due to recent breakthroughs and debuts.

Nandini Roy Choudhury

Principal Consultant

Talk to Analyst

Find your sweet spots for generating winning opportunities in this market.

Comparative Analysis of Adjacent Markets

Kitchen Hood System Market:

Differentiating Aspects Kitchen Hood System Market
CAGR 3.9%
Market Valuation in 2023 US$ 12.58 Billion
Projected Market Value in 2033 US$ 18.45 Billion
Driver
  • Kitchen hood systems efficiently remove unwanted materials away from anybody using the kitchen, reducing the amount of dangerous air and preventing the growth of bacteria, germs, and even mould.
  • Due to the rising popularity of eating out, there are more commercial food restaurants everywhere, especially in developing nations.

Cooker Hoods Market:

Differentiating Aspects Cooker Hoods Market
CAGR 3.6%
Market Valuation in 2023 US$ 12.54 Billion
Projected Market Value in 2033 US$ 17.85 Billion
Driver
  • The development of new products and associated Research and Development projects are being funded by cooker hood manufacturers.
  • Demand for cooker hoods is boosted by strict laws governing sanitation and hygiene in the hotel and restaurant industries.

Commercial Kitchen Ventilation System Market:

Differentiating Aspects Commercial Kitchen Ventilation System Market
CAGR 3.9%
Market Valuation in 2023 US$ 2.57 Billion
Projected Market Value in 2033 US$ 3.77 Billion
Driver
  • Current trends, such as the use of the Demand Controlled Ventilation (DCV) system, are helping to increase the adoption of commercial kitchen ventilation systems.
  • As a consequence of improved airflow brought on by sufficient ventilation, long-term utility expenses, and maintenance costs, there is an increase in demand for integrated commercial kitchen ventilation systems.

Category-wise Insights

Domineering Segments Attaining Reputation in Light of Specific Requirements

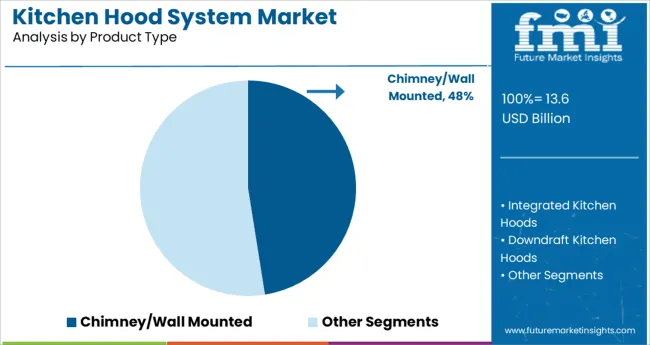
Chimney/ Wall Mounted - By Product Type

The kitchen hood system market is segmented into chimney/wall-mounted, integrated kitchen hoods, and downdraft kitchen hoods based on the top product type. The chimney/wall-mounted category is anticipated to have the largest global market share throughout the projected period, accounting for almost 39.4% of the entire market. The following factors are boosting market expansion:

  • Several versions are available with several cutting-edge technologies, such as Bluetooth and Wi-Fi connectivity.
  • Over the stove, wall-mounted cooking hoods are fixed directly on the kitchen wall. They are easier to install, takes up less room, and even fit inside cabinets without taking up cabinet space.
  • Due to their huge diameters, wall-mounted kitchen hoods can entirely collect all of the smoke and dust inside the kitchen.
  • It is best to use a wall-mounted range hood if the stove is situated on the external wall because these hoods often vent the air outdoors via the outer wall behind them.
  • Wall-mounted kitchen hoods relieve smoke and oil by employing a fan that can be adjusted depending on the cooking.
  • To improve visibility when cooking or cleaning, some chimneys additionally come with built-in lights.

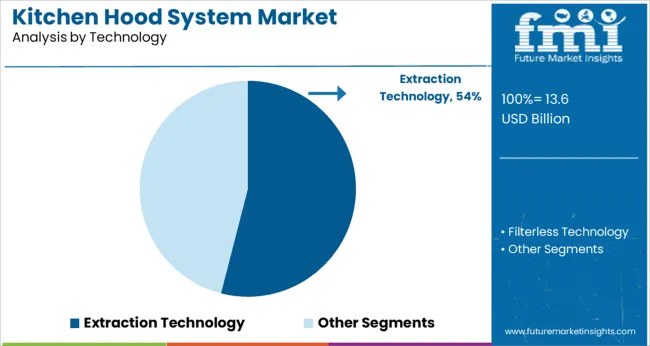
Extraction Technology - By Technology

The kitchen hood system market is bifurcated into extraction technology and filterless technology in terms of technology. Since it is the most accepted technology among these categories among customers, the extraction technology segment has the biggest market share, which is around 58.2% of the global market. The following factors are accountable for its ongoing development:
  • Extraction technology deploys a big pipe or a vent over which the hot steam or smoke is ejected into the atmosphere. Large volumes of smoke and hot air can be quickly and efficiently drawn in by the suction motor inside the kitchen hood vent.
  • Heavy-duty cooking that produces a lot of smoke and fumes can be handled by the extraction technology-equipped chimney since it is sturdy.
  • It has fewer parts, so the vendor needs to visit less frequently for maintenance.
  • Chimneys equipped with extraction technology also run silently. The built-in fans do not make a lot of noise.

Get the data you need at a Fraction of the cost

Personalize your report by choosing insights you need
and save 40%!

Country-wise Insights

The Dominant Industry of the US Economy is Food Service and Hospitality

The kitchen hood system market in North America is still dominated by the USA. By the end of 2033, the US kitchen hood system market is expected to acquire almost 21.6% of the entire market. The primary market drivers are the quick uptake of technological innovations and the resulting requirement for connected and smart devices. The demand for kitchen hood systems in the USA is also rising due to the ongoing expansion of the residential sector brought on by the rising number of families and significant home renovation projects carried out by individuals.

Instead of doing routine maintenance, homeowners are spending more on initiatives that improve their quality of life. In addition, the trend of millennials purchasing houses, especially older properties, is increasing the demand for repairs. According to HomeAdvisor research, millennials invest in more home improvement projects annually than other age groups do. The growing tendency will increase demand for kitchen hood systems in the USA.

There is a High Demand for Luxury Kitchen Hoods in the UK

Kitchen hood system market expansion in Europe, particularly in the UK, is being driven by rising preference as a result of more consumer understanding of the advantages of the products. The UK kitchen hood system market is anticipated to expand at a CAGR of 6.9% during the forecast period. The presence of several eateries and hotels, a sizable tourist sector, and high consumer disposable income are the primary drivers of domination. Additionally, the market in this country is also expanding due to rising demand for customized kitchens, rising expenditure on kitchen belongings, and rising disposable income.

As the number of working people rises, there is a growing need for simple home cleaners, which is further boosting the supply. Furthermore, factors like the development of the hospitality sector, rising consumer health consciousness, stringent government energy efficiency regulations, rising demand for energy-efficient and cost-effective products, and expansion of the food service sector are also contributing to the expected growth of the UK kitchen hood system market.

Customers Desire Pragmatic Kitchen Designs in China

The Chinese kitchen hood system market is expanding quickly due to rising consumer buying power and strong demand brought on by more customer understanding of the advantages of the products. China is expected to grow at a CAGR of 8.2% during the forecast period. China is expected to have vast potential in the upcoming years due to its rapidly rising population. The demand for the product is also being driven by an increase in the demand for practical cleaning solutions due to the rising number of working people. Consumers favour practical kitchen designs, such as modular patterns, which are likely to further fuel demand, given the rising urbanization and the widespread tendency of small and compact dwellings.

A significant manufacturer of both industrial and consumer goods worldwide is China. Rising disposable income in China is anticipated to accelerate kitchen hood system market expansion soon. Modern cooking equipment is being purchased by the growing working population. Hong Kong is the leading export market of China, more than 80% of kitchen hood systems are from China. Due to the growing number of Quick Service Restaurants (QSRs) and new eateries, the requirement for cooking hoods is also expected to increase nationwide.

Start-up Ecosystem

New competitors in the kitchen hood system market are developing fresh goods and obtaining a competitive edge by utilizing technical breakthroughs. These companies continuously spend money on Research and Development in order to stay on top of changing customer tastes and expectations from the end-use industry. Sales of kitchen hood systems are aided by initiatives taken by start-ups to improve their standing in the global market.

Leading Start-ups in the Kitchen Hood System Market Right Now

Kitchen Air Inc - United States of America

After recognizing a clear need for a different sort of service provider in the niche field of commercial kitchen ventilation, Kitchen Air Inc. was established in January 2010. A certified member of the National Balancing Council since 2013, Kitchen Air Inc. started offering airflow testing and balancing services for whole restaurants in 2013 and is still doing so today. Kitchen Air Inc started creating its own kitchen ventilation systems in 2016 and started privately labeling them. The first Grease Hood Filter deep Cleaning/Exchange division was introduced by Kitchen Air Inc. in 2017.

Sagar Air Pvt Ltd - India

In 1987, V V Murthy launched Sagar Air Pvt Ltd. Since its beginning, Sagar Air has worked diligently to provide cutting-edge technology in several HVAC & R industries. This sector stands out as one of India's oldest producers of HVAC equipment. AHUs, Air Washers, Wet Scrubbers, Air Ventilation Units, FCUs, Plenums, kitchen hoods, industrial Centrifugal Fans, Axial Flow Fans, and Air Distribution Products- Grilles, Dampers, Diffusers, and Desiccant Dehumidifiers are just a few of the many HVAC components the firm offers.

Brief About Key Applications in Kitchen Hood SystemMarket

In 2010, Elica SpA established a joint venture in India called Elica PB Whirlpool Kitchen Appliances Private Limited (formerly Elica PB India Private Limited). Pune, Maharashtra, is where the Indian manufacturing facility is situated. The machinery, automated assembly lines, and equipment in this cutting-edge manufacturing facility were all imported from Italy. Italy provides technical help for each production phase. With the ability to manufacture more than 15 kinds of built-in cooktops and more than 50 variations of kitchen exhaust. The company is prepared to completely transform the Indian kitchen hood system market.

Every home needs a kitchen, and Ciarra Appliances, a top manufacturer of professional cooking hoods, is aware of this. The business has been around for a while and has planned ahead to provide more enjoyable culinary experiences.

Impex Appliances Pvt. Ltd., a manufacturer, importer, and marketer of appliances and home goods in India and the Middle East, offers a variety of items in the kitchen appliance, home appliance, and home entertainment sectors. It boasts an expanding professional business system and efficient, qualified management. The business sells its goods under a variety of well-known names, including Impex and luxury labels like Delici. With a range of almost 400 items, more than 100 regional partners, and 5000 retailers, Impex has a solid reputation in the market and industry.

Recent Developments

  • In July 2022, Franke introduced the Avant Silence range hoods, which offer excellent performance and minimal noise. Open kitchens are the perfect place for the new wall and island range hoods. The new Franke Sound Pro Blowers, which provide noise reduction and a more pleasant operating sound, are included with these models.
  • In March 2022, a portable cooking hood called AirHood has been released by Smart Product Concepts Ltd. Through Kickstarter, the AirHood may be pre-ordered, and early supporters will have access to special savings of up to 40%.
  • In February 2022, by expanding its product line-up and addressing more markets, BSH Home Appliances, which produces and distributes items under the Bosch and Siemens brands, intends to grow to a Rs 5,000 crore firm in India by 2026.
  • In January 2022, an updated range of kitchen appliances with better air quality systems has been introduced by Broan-NuTone, LLC. Aside from other ventilation devices, the new line will have dehumidifiers and range hoods.
  • In March 2021, with the proper suction power, a beautiful appearance, and high-quality construction, Hafele introduced the new filter-free cooker hood in its Hafele premium appliances. This guarantees that no smells or undesired gas are produced.
  • In January 2019, Elica introduced the Varna Black Vent Hood, which has a black stainless steel finish and improved visual appeal. To improve user comfort, the system has multipurpose and clear electronic touch controls. A cutting-edge HUSH Sound Suppression System is built into the hood to ensure minimal noise and a peaceful working environment in the kitchen.

Some of the other key companies proliferating in the market are

Key Segments in the Kitchen Hood System Market

By Product Type:

  • Chimney/Wall Mounted
  • Integrated Kitchen Hoods
  • Downdraft Kitchen Hoods

By Technology:

  • Extraction Technology
  • Filterless Technology

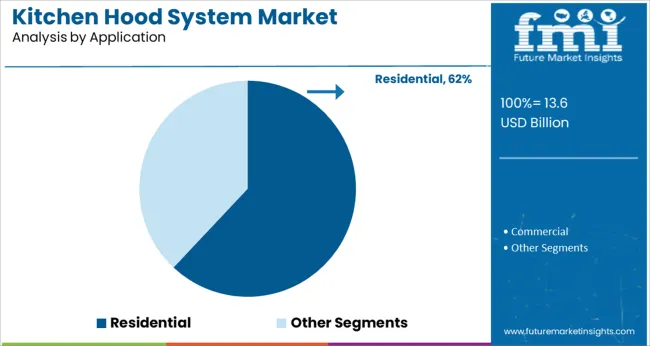
By Application:

  • Residential
  • Commercial

By Sales Channel:

  • Multi-branded Stores
  • Exclusive Stores
  • Online Stores
  • Others

By Region:

  • North America
  • Latin America
  • Europe
  • East Asia
  • South Asia and the Pacific
  • Middle East and Africa

Frequently Asked Questions

What is the Growth Outlook for the Kitchen Hood System Market?

The growth outlook for the kitchen hood system market is predicted to advance at a CAGR of 3.9% from 2023 to 2033.

What is the market valuation of Kitchen Hood System in 2023?

The market valuation of the kitchen hood system market stands at US$ 12.58 billion in 2023.

How much Growth Potential does Kitchen Hood System hold?

The kitchen hood system market is likely to hold a valuation of US$ 18.45 billion by 2033.

Table of Content

1. Executive Summary | Kitchen Hood System Market

    1.1. Global Market Outlook

    1.2. Demand Side Trends

    1.3. Supply Side Trends

    1.4. Technology Roadmap

    1.5. Analysis and Recommendations

2. Market Overview

    2.1. Market Coverage / Taxonomy

    2.2. Market Definition / Scope / Limitations

3. Key Market Trends

    3.1. Key Trends Impacting the Market

    3.2. Product Innovation / Development Trends

4. Key Success Factors

    4.1. Product Adoption / Usage Analysis

    4.2. Product USPs / Features

    4.3. Strategic Promotional Strategies

5. Global Market Demand Analysis 2018 to 2022 and Forecast, 2023 to 2033

    5.1. Historical Market Volume (Units) Analysis, 2018 to 2023

    5.2. Current and Future Market Volume (Units) Projections, 2023 to 2033

    5.3. Y-o-Y Growth Trend Analysis

6. Global Market - Pricing Analysis

    6.1. Regional Pricing Analysis by Product Type and Pricing Forecast

        6.1.1. Distributor Level pricing

        6.1.2. Manufacturer Level pricing

    6.2. Global Average Pricing Analysis Benchmark

7. Global Market Demand (in Value or Size in US$ Million) Analysis 2018 to 2022 and Forecast, 2023 to 2033

    7.1. Historical Market Value (US$ Million) Analysis, 2018 to 2023

    7.2. Current and Future Market Value (US$ Million) Projections, 2023 to 2033

        7.2.1. Y-o-Y Growth Trend Analysis

        7.2.2. Absolute $ Opportunity Analysis

8. Market Background

    8.1. Macro-Economic Factors

        8.1.1. Global GDP Growth Outlook

        8.1.2. Global HORECA sector Outlook

        8.1.3. Global Urbanization Growth Outlook

        8.1.4. Global Kitchen & Home Décor Industry Outlook

        8.1.5. Other Key Macro-Economic factors

    8.2. Forecast Factors - Relevance & Impact

        8.2.1. Historic Growth Rate of Companies

        8.2.2. Global Food Consumption Outlook

        8.2.3. Government Regulations

        8.2.4. Other key forecast factors

    8.3. Value Chain

        8.3.1. Raw Product Type Suppliers

        8.3.2. Product Manufacturers

        8.3.3. Average Profitability Margins

    8.4. COVID-19 Crisis - Impact Assessment

        8.4.1. Current Statistics

        8.4.2. Short-Mid-Long Term Outlook

        8.4.3. Likely Rebound

    8.5. Market Dynamics

        8.5.1. Drivers

        8.5.2. Restraints

        8.5.3. Opportunity Analysis

    8.6. Buyers Decision Analysis

    8.7. Demand-Supply Analysis

9. Global Market Analysis 2018 to 2022 and Forecast 2023 to 2033, by Product Type

    9.1. Introduction / Key Findings

    9.2. Historical Market Size (US$ Million) and Volume Analysis By Product Type, 2018 to 2023

    9.3. Current and Future Market Size (US$ Million) and Volume Analysis and Forecast By Product Type, 2023 to 2033

        9.3.1. ChiMillioney/Wall Mounted

        9.3.2. Integrated Kitchen Hoods

        9.3.3. Downdraft Kitchen Hoods

    9.4. Market Attractiveness Analysis By Product Type

10. Global Market Analysis 2018 to 2022 and Forecast 2023 to 2033, by Technology

    10.1. Introduction / Key Findings

    10.2. Historical Market Size (US$ Million) and Volume Analysis By Technology, 2018 to 2023

    10.3. Current and Future Market Size (US$ Million) and Volume Analysis and Forecast By Technology, 2023 to 2033

        10.3.1. Extraction Technology

        10.3.2. Filterless Technology

    10.4. Market Attractiveness Analysis By Technology

11. Global Market Analysis 2018 to 2022 and Forecast 2023 to 2033, by Application

    11.1. Introduction / Key Findings

    11.2. Historical Market Size (US$ Million) and Volume Analysis By Application, 2018 to 2023

    11.3. Current and Future Market Size (US$ Million) and Volume Analysis and Forecast By Application, 2023 to 2033

        11.3.1. Residential

        11.3.2. Commercial

    11.4. Market Attractiveness Analysis By Application

12. Global Market Analysis 2018 to 2022 and Forecast 2023 to 2033, by Sales Channel

    12.1. Introduction / Key Findings

    12.2. Historical Market Size (US$ Million) and Volume Analysis By Sales Channel, 2018 to 2023

    12.3. Current and Future Market Size (US$ Million) and Volume Analysis and Forecast By Sales Channel, 2023 to 2033

        12.3.1. Multi-Branded Stores

        12.3.2. Exclusive Stores

        12.3.3. Online Stores

        12.3.4. Others

    12.4. Market Attractiveness Analysis By Sales Channel

13. Global Market Analysis 2018 to 2022 and Forecast 2023 to 2033, by Region

    13.1. Introduction

    13.2. Historical Market Size (US$ Million) and Volume Analysis By Region, 2018 to 2023

    13.3. Current Market Size (US$ Million) and Volume Analysis and Forecast By Region, 2023 to 2033

        13.3.1. North America

        13.3.2. Latin America

        13.3.3. Europe

        13.3.4. East Asia

        13.3.5. South Asia and Pacific

        13.3.6. Middle East and Africa

    13.4. Market Attractiveness Analysis By Region

14. North America Market Analysis 2018 to 2022 and Forecast 2023 to 2033

    14.1. Introduction

    14.2. Pricing Analysis

    14.3. Historical Market Size (US$ Million) and Volume Trend Analysis By Market Taxonomy, 2018 to 2023

    14.4. Market Size (US$ Million) and Volume Forecast By Market Taxonomy, 2023 to 2033

        14.4.1. By Country

            14.4.1.1. United States of America

            14.4.1.2. Canada

        14.4.2. By Product Type

        14.4.3. By Technology

        14.4.4. By Application

        14.4.5. By Sales Channel

    14.5. Market Attractiveness Analysis

        14.5.1. By Country

        14.5.2. By Product Type

        14.5.3. By Technology

        14.5.4. By Application

        14.5.5. By Sales Channel

    14.6. Market Trends

    14.7. Drivers and Restraints - Impact Analysis

15. Latin America Market Analysis 2018 to 2022 and Forecast 2023 to 2033

    15.1. Introduction

    15.2. Pricing Analysis

    15.3. Historical Market Size (US$ Million) and Volume Trend Analysis By Market Taxonomy, 2018 to 2023

    15.4. Market Size (US$ Million) and Volume Forecast By Market Taxonomy, 2023 to 2033

        15.4.1. By Country

            15.4.1.1. Brazil

            15.4.1.2. Mexico

            15.4.1.3. Rest of Latin America

        15.4.2. By Product Type

        15.4.3. By Technology

        15.4.4. By Application

        15.4.5. By Sales Channel

    15.5. Market Attractiveness Analysis

        15.5.1. By Country

        15.5.2. By Product Type

        15.5.3. By Technology

        15.5.4. By Application

        15.5.5. By Sales Channel

    15.6. Market Trends

    15.7. Drivers and Restraints - Impact Analysis

16. Europe Market Analysis 2018 to 2022 and Forecast 2023 to 2033

    16.1. Introduction

    16.2. Pricing Analysis

    16.3. Historical Market Size (US$ Million) and Volume Trend Analysis By Market Taxonomy, 2018 to 2023

    16.4. Market Size (US$ Million) and Volume Forecast By Market Taxonomy, 2023 to 2033

        16.4.1. By Country

            16.4.1.1. Germany

            16.4.1.2. Italy

            16.4.1.3. France

            16.4.1.4. United Kingdom

            16.4.1.5. Spain

            16.4.1.6. BENELUX

            16.4.1.7. Russia

            16.4.1.8. Rest of Europe

        16.4.2. By Product Type

        16.4.3. By Technology

        16.4.4. By Application

        16.4.5. By Sales Channel

    16.5. Market Attractiveness Analysis

        16.5.1. By Country

        16.5.2. By Product Type

        16.5.3. By Technology

        16.5.4. By Application

        16.5.5. By Sales Channel

    16.6. Market Trends

    16.7. Drivers and Restraints - Impact Analysis

17. East Asia Market Analysis 2018 to 2022 and Forecast 2023 to 2033

    17.1. Introduction

    17.2. Pricing Analysis

    17.3. Historical Market Size (US$ Million) and Volume Trend Analysis By Market Taxonomy, 2018 to 2023

    17.4. Market Size (US$ Million) and Volume Forecast By Market Taxonomy, 2023 to 2033

        17.4.1. By Country

            17.4.1.1. China

            17.4.1.2. Japan

            17.4.1.3. South Korea

        17.4.2. By Product Type

        17.4.3. By Technology

        17.4.4. By Application

        17.4.5. By Sales Channel

    17.5. Market Attractiveness Analysis

        17.5.1. By Country

        17.5.2. By Product Type

        17.5.3. By Technology

        17.5.4. By Application

        17.5.5. By Sales Channel

    17.6. Market Trends

    17.7. Drivers and Restraints - Impact Analysis

18. South Asia and Pacific Market Analysis 2018 to 2022 and Forecast 2023 to 2033

    18.1. Introduction

    18.2. Pricing Analysis

    18.3. Historical Market Size (US$ Million) and Volume Trend Analysis By Market Taxonomy, 2018 to 2023

    18.4. Market Size (US$ Million) and Volume Forecast By Market Taxonomy, 2023 to 2033

        18.4.1. By Country

            18.4.1.1. India

            18.4.1.2. ASEAN

            18.4.1.3. Australia and New Zealand

            18.4.1.4. Rest of South Asia & Pacific

        18.4.2. By Product Type

        18.4.3. By Technology

        18.4.4. By Application

        18.4.5. By Sales Channel

    18.5. Market Attractiveness Analysis

        18.5.1. By Country

        18.5.2. By Product Type

        18.5.3. By Technology

        18.5.4. By Application

        18.5.5. By Sales Channel

    18.6. Market Trends

    18.7. Key Market Participants - Intensity Mapping

    18.8. Drivers and Restraints - Impact Analysis

19. Middle East and Africa Market Analysis 2018 to 2022 and Forecast 2023 to 2033

    19.1. Introduction

    19.2. Pricing Analysis

    19.3. Historical Market Size (US$ Million) and Volume Trend Analysis By Market Taxonomy, 2018 to 2023

    19.4. Market Size (US$ Million) and Volume Forecast By Market Taxonomy, 2023 to 2033

        19.4.1. By Country

            19.4.1.1. GCC Countries

            19.4.1.2. Turkey

            19.4.1.3. Northern Africa

            19.4.1.4. South Africa

            19.4.1.5. Rest of Middle East and Africa

        19.4.2. By Product Type

        19.4.3. By Technology

        19.4.4. By Application

        19.4.5. By Sales Channel

    19.5. Market Attractiveness Analysis

        19.5.1. By Country

        19.5.2. By Product Type

        19.5.3. By Technology

        19.5.4. By Application

        19.5.5. By Sales Channel

    19.6. Market Trends

    19.7. Key Market Participants - Intensity Mapping

    19.8. Drivers and Restraints - Impact Analysis

20. Country-wise Market Analysis

    20.1. Introduction

        20.1.1. Market Value Proportion Analysis, By Key Countries

        20.1.2. Global Vs. Country Growth Comparison

    20.2. USA Market Analysis

        20.2.1. By Product Type

        20.2.2. By Technology

        20.2.3. By Application

        20.2.4. By Sales Channel

    20.3. Canada Market Analysis

        20.3.1. By Product Type

        20.3.2. By Technology

        20.3.3. By Application

        20.3.4. By Sales Channel

    20.4. Mexico Market Analysis

        20.4.1. By Product Type

        20.4.2. By Technology

        20.4.3. By Application

        20.4.4. By Sales Channel

    20.5. Brazil Market Analysis

        20.5.1. By Product Type

        20.5.2. By Technology

        20.5.3. By Application

        20.5.4. By Sales Channel

    20.6. Germany Market Analysis

        20.6.1. By Product Type

        20.6.2. By Technology

        20.6.3. By Application

        20.6.4. By Sales Channel

    20.7. Italy Market Analysis

        20.7.1. By Product Type

        20.7.2. By Technology

        20.7.3. By Application

        20.7.4. By Sales Channel

    20.8. France Market Analysis

        20.8.1. By Product Type

        20.8.2. By Technology

        20.8.3. By Application

        20.8.4. By Sales Channel

    20.9. United Kingdom Market Analysis

        20.9.1. By Product Type

        20.9.2. By Technology

        20.9.3. By Application

        20.9.4. By Sales Channel

    20.10. Spain Market Analysis

        20.10.1. By Product Type

        20.10.2. By Technology

        20.10.3. By Application

        20.10.4. By Sales Channel

    20.11. Russia Market Analysis

        20.11.1. By Product Type

        20.11.2. By Technology

        20.11.3. By Application

        20.11.4. By Sales Channel

    20.12. China Market Analysis

        20.12.1. By Product Type

        20.12.2. By Technology

        20.12.3. By Application

        20.12.4. By Sales Channel

    20.13. Japan Market Analysis

        20.13.1. By Product Type

        20.13.2. By Technology

        20.13.3. By Application

        20.13.4. By Sales Channel

    20.14. S. Korea Market Analysis

        20.14.1. By Product Type

        20.14.2. By Technology

        20.14.3. By Application

        20.14.4. By Sales Channel

    20.15. India Market Analysis

        20.15.1. By Product Type

        20.15.2. By Technology

        20.15.3. By Application

        20.15.4. By Sales Channel

    20.16. ASEAN Market Analysis

        20.16.1. By Product Type

        20.16.2. By Technology

        20.16.3. By Application

        20.16.4. By Sales Channel

    20.17. Australia and New Zealand Market Analysis

        20.17.1. By Product Type

        20.17.2. By Technology

        20.17.3. By Application

        20.17.4. By Sales Channel

    20.18. GCC Countries Market Analysis

        20.18.1. By Product Type

        20.18.2. By Technology

        20.18.3. By Application

        20.18.4. By Sales Channel

    20.19. Turkey Market Analysis

        20.19.1. By Product Type

        20.19.2. By Technology

        20.19.3. By Application

        20.19.4. By Sales Channel

    20.20. Northern Africa Market Analysis

        20.20.1. By Product Type

        20.20.2. By Technology

        20.20.3. By Application

        20.20.4. By Sales Channel

    20.21. South Africa Market Analysis

        20.21.1. By Product Type

        20.21.2. By Technology

        20.21.3. By Application

        20.21.4. By Sales Channel

21. Market Structure Analysis

    21.1. Market Analysis by Tier of Companies

    21.2. Market Concentration

    21.3. Market Share Analysis of Top Players

    21.4. Production Capacity Analysis

    21.5. Market Presence Analysis

        21.5.1. By Product Type Footprint of Players

        21.5.2. By Regional Footprint of Players

22. Competition Analysis

    22.1. Competition Dashboard

    22.2. Competition Benchmarking

    22.3. Competition Deep Dive 

        22.3.1. Bosch

            22.3.1.1. Overview

            22.3.1.2. Product Portfolio

            22.3.1.3. Profitability by Market Segments (Product/Channel/Region)

            22.3.1.4. Sales Footprint

            22.3.1.5. Strategy Overview

        22.3.2. SNDOAS

            22.3.2.1. Overview

            22.3.2.2. Product Portfolio

            22.3.2.3. Profitability by Market Segments (Product/Channel/Region)

            22.3.2.4. Sales Footprint

            22.3.2.5. Strategy Overview

        22.3.3. PROLINE

            22.3.3.1. Overview

            22.3.3.2. Product Portfolio

            22.3.3.3. Profitability by Market Segments (Product/Channel/Region)

            22.3.3.4. Sales Footprint

            22.3.3.5. Strategy Overview

        22.3.4. Elica S.p.A.

            22.3.4.1. Overview

            22.3.4.2. Product Portfolio

            22.3.4.3. Profitability by Market Segments (Product/Channel/Region)

            22.3.4.4. Sales Footprint

            22.3.4.5. Strategy Overview

        22.3.5. Impex

            22.3.5.1. Overview

            22.3.5.2. Product Portfolio

            22.3.5.3. Profitability by Market Segments (Product/Channel/Region)

            22.3.5.4. Sales Footprint

            22.3.5.5. Strategy Overview

        22.3.6. Rani Trunk House

            22.3.6.1. Overview

            22.3.6.2. Product Portfolio

            22.3.6.3. Profitability by Market Segments (Product/Channel/Region)

            22.3.6.4. Sales Footprint

            22.3.6.5. Strategy Overview

        22.3.7. Ciarra Appliances

            22.3.7.1. Overview

            22.3.7.2. Product Portfolio

            22.3.7.3. Profitability by Market Segments (Product/Channel/Region)

            22.3.7.4. Sales Footprint

            22.3.7.5. Strategy Overview

        22.3.8. FABER

            22.3.8.1. Overview

            22.3.8.2. Product Portfolio

            22.3.8.3. Profitability by Market Segments (Product/Channel/Region)

            22.3.8.4. Sales Footprint

            22.3.8.5. Strategy Overview

        22.3.9. MieleBSH Home Appliances Group

            22.3.9.1. Overview

            22.3.9.2. Product Portfolio

            22.3.9.3. Profitability by Market Segments (Product/Channel/Region)

            22.3.9.4. Sales Footprint

            22.3.9.5. Strategy Overview

        22.3.10. Siemens

            22.3.10.1. Overview

            22.3.10.2. Product Portfolio

            22.3.10.3. Profitability by Market Segments (Product/Channel/Region)

            22.3.10.4. Sales Footprint

            22.3.10.5. Strategy Overview

        22.3.11. Inflame Appliances Ltd

            22.3.11.1. Overview

            22.3.11.2. Product Portfolio

            22.3.11.3. Profitability by Market Segments (Product/Channel/Region)

            22.3.11.4. Sales Footprint

            22.3.11.5. Strategy Overview

        22.3.12. Eico A/S

            22.3.12.1. Overview

            22.3.12.2. Product Portfolio

            22.3.12.3. Profitability by Market Segments (Product/Channel/Region)

            22.3.12.4. Sales Footprint

            22.3.12.5. Strategy Overview

        22.3.13. Westin

            22.3.13.1. Overview

            22.3.13.2. Product Portfolio

            22.3.13.3. Profitability by Market Segments (Product/Channel/Region)

            22.3.13.4. Sales Footprint

            22.3.13.5. Strategy Overview

        22.3.14. Candy Hoover Group S.r.l

            22.3.14.1. Overview

            22.3.14.2. Product Portfolio

            22.3.14.3. Profitability by Market Segments (Product/Channel/Region)

            22.3.14.4. Sales Footprint

            22.3.14.5. Strategy Overview

        22.3.15. Falmec Kitchen Appliance Limited

            22.3.15.1. Overview

            22.3.15.2. Product Portfolio

            22.3.15.3. Profitability by Market Segments (Product/Channel/Region)

            22.3.15.4. Sales Footprint

            22.3.15.5. Strategy Overview

        22.3.16. Hafele Appliances

            22.3.16.1. Overview

            22.3.16.2. Product Portfolio

            22.3.16.3. Profitability by Market Segments (Product/Channel/Region)

            22.3.16.4. Sales Footprint

            22.3.16.5. Strategy Overview

23. Assumptions and Acronyms Used

24. Research Methodology

List of Tables

Table 01: Global Market Size (US$ Million) and Volume (Units) Forecast By Product Type, 2018 to 2033

Table 02: Global Market Size (US$ Million) and Volume (Units) Forecast By Application, 2018 to 2033

Table 03: Global Market Size (US$ Million) and Volume (Units) Forecast By Technology, 2018 to 2033

Table 04: Global Market Size (US$ Million) and Volume (Units) Forecast By Sales Channel, 2018 to 2033

Table 05: Global Market Size (US$ Million) and Volume (Units) Forecast by Region, 2018 to 2033

Table 06: North America Market Size (US$ Million) and Volume (Units) Forecast by Country, 2018 to 2033

Table 07: North America Market Size (US$ Million) and Volume (Units) Forecast By Product Type, 2018 to 2033

Table 08: North America Market Size (US$ Million) and Volume (Units) Forecast By Application, 2018 to 2033

Table 09: North America Market Size (US$ Million) and Volume (Units) Forecast By Technology, 2018 to 2033

Table 10: North America Market Size (US$ Million) and Volume (Units) Forecast By Sales Channel, 2018 to 2033

Table 11: Latin America Market Size (US$ Million) and Volume (Units) Forecast by Country, 2018 to 2033

Table 12: Latin America Market Size (US$ Million) and Volume (Units) Forecast By Product Type, 2018 to 2033

Table 13: Latin America Market Size (US$ Million) and Volume (Units) Forecast By Application, 2018 to 2033

Table 14: Latin America Market Size (US$ Million) and Volume (Units) Forecast By Technology, 2018 to 2033

Table 15: Latin America Market Size (US$ Million) and Volume (Units) Forecast By Sales Channel, 2018 to 2033

Table 16: Europe Market Size (US$ Million) and Volume (Units) Forecast by Country, 2018 to 2033

Table 17: Europe Market Size (US$ Million) and Volume (Units) Forecast By Product Type, 2018 to 2033

Table 18: Europe Market Size (US$ Million) and Volume (Units) Forecast By Application, 2018 to 2033

Table 19: Europe Market Size (US$ Million) and Volume (Units) Forecast By Technology, 2018 to 2033

Table 20: Europe Market Size (US$ Million) and Volume (Units) Forecast By Sales Channel, 2018 to 2033

Table 21: East Asia Market Size (US$ Million) and Volume (Units) Forecast by Country, 2018 to 2033

Table 22: East Asia Market Size (US$ Million) and Volume (Units) Forecast By Product Type, 2018 to 2033

Table 23: East Asia Market Size (US$ Million) and Volume (Units) Forecast By Application, 2018 to 2033

Table 24: East Asia Market Size (US$ Million) and Volume (Units) Forecast By Technology, 2018 to 2033

Table 25: East Asia Market Size (US$ Million) and Volume (Units) Forecast By Sales Channel, 2018 to 2033

Table 26: South Asia & Pacific Market Size (US$ Million) and Volume (Units) Forecast by Country, 2018 to 2033

Table 27: South Asia & Pacific Market Size (US$ Million) and Volume (Units) Forecast By Product Type, 2018 to 2033

Table 28: South Asia & Pacific Market Size (US$ Million) and Volume (Units) Forecast By Application, 2018 to 2033

Table 29: South Asia & Pacific Market Size (US$ Million) and Volume (Units) Forecast By Technology, 2018 to 2033

Table 30: South Asia & Pacific Market Size (US$ Million) and Volume (Units) Forecast By Sales Channel, 2018 to 2033

Table 31: Middle East & Africa Market Size (US$ Million) and Volume (Units) Forecast by Country, 2018 to 2033

Table 32: Middle East & Africa Market Size (US$ Million) and Volume (Units) Forecast By Product Type, 2018 to 2033

Table 33: Middle East & Africa Market Size (US$ Million) and Volume (Units) Forecast By Application, 2018 to 2033

Table 34: Middle East & Africa Market Size (US$ Million) and Volume (Units) Forecast By Technology, 2018 to 2033

Table 35: Middle East & Africa Market Size (US$ Million) and Volume (Units) Forecast By Sales Channel, 2018 to 2033

List of Charts

Figure 01: Global Market Value (US$ Million) Historical Data and Forecast 2018 to 2033

Figure 02: Global Market Absolute $ Opportunity Analysis, 2018 to 2033

Figure 03: Global Market Historical Volume (Units) & Value (US$ Million), 2018 to 2022

Figure 04: Global Market Volume (Units) & Value (US$ Million) Forecast, 2023 to 2033

Figure 05: Global Market Volume (Units) Forecast by Region, 2023 to 2033

Figure 06: Global Market Share and BPS Analysis by Product Type, 2023 to 2033

Figure 07: Global Market Y-o-Y Growth by Product Type, 2023 to 2033

Figure 08: Global Market Attractiveness Analysis by Product Type, 2023 to 2033

Figure 09: Global Market Absolute $ Opportunity by ChiMillioney/Wall Mounted Segment, 2018 to 2033

Figure 10: Global Market Absolute $ Opportunity by Integrated Kitchen Hoods Segment, 2018 to 2033

Figure 11: Global Market Absolute $ Opportunity by Downdraft Kitchen Hoods Segment, 2018 to 2033

Figure 12: Global Market Share and BPS Analysis by Application, 2023 to 2033

Figure 13: Global Market Y-o-Y Growth by Application, 2023 to 2033

Figure 14: Global Market Attractiveness Analysis by Application, 2023 to 2033

Figure 15: Global Market Absolute $ Opportunity by Residential Segment, 2018 to 2033

Figure 16: Global Market Absolute $ Opportunity by Commercial Segment, 2018 to 2033

Figure 17: Global Market Share and BPS Analysis by Technology, 2023 to 2033

Figure 18: Global Market Y-o-Y Growth by Technology, 2023 to 2033

Figure 19: Global Market Attractiveness Analysis by Technology, 2023 to 2033

Figure 20: Global Market Absolute $ Opportunity by Extraction Technology Segment, 2018 to 2033

Figure 21: Global Market Absolute $ Opportunity by Filterless Technology Segment, 2018 to 2033

Figure 22: Global Market Share and BPS Analysis by Sales Channel, 2023 to 2033

Figure 23: Global Market Y-o-Y Growth by Sales Channel, 2023 to 2033

Figure 25: Global Market Attractiveness Analysis by Sales Channel, 2023 to 2033

Figure 26: Global Market Absolute $ Opportunity by Multi-Branded Stores Segment, 2018 to 2033

Figure 27: Global Market Absolute $ Opportunity by Exclusive Stores Segment, 2018 to 2033

Figure 28: Global Market Absolute $ Opportunity by Online Stores Segment, 2018 to 2033

Figure 29: Global Market Absolute $ Opportunity by Others Segment, 2018 to 2033

Figure 30: Global Market Share and BPS Analysis by Region, 2023 to 2033

Figure 31: Global Market Y-o-Y Growth by Region, 2023 to 2033

Figure 32: Global Market Attractiveness Analysis by Region, 2023 to 2033

Figure 33: Global Market Absolute $ Opportunity, 2018 to 2033

Figure 34: North America Market Share and BPS Analysis by Product Type, 2023 to 2033

Figure 35: North America Market Y-o-Y Growth by Product Type, 2023 to 2033

Figure 36: North America Market Attractiveness Analysis by Product Type, 2023 to 2033

Figure 37: North America Market Share and BPS Analysis by Application, 2023 to 2033

Figure 38: North America Market Y-o-Y Growth by Application, 2023 to 2033

Figure 39: North America Market Attractiveness Analysis by Application, 2023 to 2033

Figure 40: North America Market Share and BPS Analysis by Technology, 2023 to 2033

Figure 41: North America Market Y-o-Y Growth by Technology, 2023 to 2033

Figure 42: North America Market Attractiveness Analysis by Technology, 2023 to 2033

Figure 43: North America Market Share and BPS Analysis by Sales Channel, 2023 to 2033

Figure 44: North America Market Y-o-Y Growth by Sales Channel, 2023 to 2033

Figure 45: North America Market Attractiveness Analysis by Sales Channel, 2023 to 2033

Figure 46: North America Market Share and BPS Analysis by Country, 2023 to 2033

Figure 47: North America Market Y-o-Y Growth by Country, 2023 to 2033

Figure 48: North America Market Attractiveness Analysis by Country, 2023 to 2033

Figure 49: North America Market Absolute $ Opportunity, 2018 to 2033

Figure 50: Latin America Market Share and BPS Analysis by Product Type, 2023 to 2033

Figure 51: Latin America Market Y-o-Y Growth by Product Type, 2023 to 2033

Figure 52: Latin America Market Attractiveness Analysis by Product Type, 2023 to 2033

Figure 53: Latin America Market Share and BPS Analysis by Application, 2023 to 2033

Figure 54: Latin America Market Y-o-Y Growth by Application, 2023 to 2033

Figure 55: Latin America Market Attractiveness Analysis by Application, 2023 to 2033

Figure 56: Latin America Market Share and BPS Analysis by Technology, 2023 to 2033

Figure 57: Latin America Market Y-o-Y Growth by Technology, 2023 to 2033

Figure 58: Latin America Market Attractiveness Analysis by Technology, 2023 to 2033

Figure 59: Latin America Market Share and BPS Analysis by Sales Channel, 2023 to 2033

Figure 60: Latin America Market Y-o-Y Growth by Sales Channel, 2023 to 2033

Figure 61: Latin America Market Attractiveness Analysis by Sales Channel, 2023 to 2033

Figure 62: Latin America Market Share and BPS Analysis by Country, 2023 to 2033

Figure 63: Latin America Market Y-o-Y Growth by Country, 2023 to 2033

Figure 64: Latin America Market Attractiveness Analysis by Country, 2023 to 2033

Figure 65: Latin America Market Absolute $ Opportunity, 2018 to 2033

Figure 67: Europe Market Share and BPS Analysis by Product Type, 2023 to 2033

Figure 68: Europe Market Y-o-Y Growth by Product Type, 2023 to 2033

Figure 69: Europe Market Attractiveness Analysis by Product Type, 2023 to 2033

Figure 70: Europe Market Share and BPS Analysis by Application, 2023 to 2033

Figure 71: Europe Market Y-o-Y Growth by Application, 2023 to 2033

Figure 72: Europe Market Attractiveness Analysis by Application, 2023 to 2033

Figure 73: Europe Market Share and BPS Analysis by Technology, 2023 to 2033

Figure 74: Europe Market Y-o-Y Growth by Technology, 2023 to 2033

Figure 75: Europe Market Attractiveness Analysis by Technology, 2023 to 2033

Figure 76: Europe Market Share and BPS Analysis by Sales Channel, 2023 to 2033

Figure 77: Europe Market Y-o-Y Growth by Sales Channel, 2023 to 2033

Figure 78: Europe Market Attractiveness Analysis by Sales Channel, 2023 to 2033

Figure 79: Europe Market Share and BPS Analysis by Country, 2023 to 2033

Figure 80: Europe Market Y-o-Y Growth by Country, 2023 to 2033

Figure 81: Europe Market Attractiveness Analysis by Country, 2023 to 2033

Figure 82: Europe Market Absolute $ Opportunity, 2018 to 2033

Figure 83: East Asia Market Share and BPS Analysis by Product Type, 2023 to 2033

Figure 84: East Asia Market Y-o-Y Growth by Product Type, 2023 to 2033

Figure 85: East Asia Market Attractiveness Analysis by Product Type, 2023 to 2033

Figure 86: East Asia Market Share and BPS Analysis by Application, 2023 to 2033

Figure 87: East Asia Market Y-o-Y Growth by Application, 2023 to 2033

Figure 89: East Asia Market Attractiveness Analysis by Application, 2023 to 2033

Figure 90: East Asia Market Share and BPS Analysis by Technology, 2023 to 2033

Figure 91: East Asia Market Y-o-Y Growth by Technology, 2023 to 2033

Figure 92: East Asia Market Attractiveness Analysis by Technology, 2023 to 2033

Figure 93: East Asia Market Share and BPS Analysis by Sales Channel, 2023 to 2033

Figure 94: East Asia Market Y-o-Y Growth by Sales Channel, 2023 to 2033

Figure 95: East Asia Market Attractiveness Analysis by Sales Channel, 2023 to 2033

Figure 96: East Asia Market Share and BPS Analysis by Country, 2023 to 2033

Figure 97: East Asia Market Y-o-Y Growth by Country, 2023 to 2033

Figure 98: East Asia Market Attractiveness Analysis by Country, 2023 to 2033

Figure 99: East Asia Market Absolute $ Opportunity, 2018 to 2033

Figure 100: South Asia & Pacific Market Share and BPS Analysis by Product Type, 2023 to 2033

Figure 101: South Asia & Pacific Market Y-o-Y Growth by Product Type, 2023 to 2033

Figure 102: South Asia & Pacific Market Attractiveness Analysis by Product Type, 2023 to 2033

Figure 103: South Asia & Pacific Market Share and BPS Analysis by Application, 2023 to 2033

Figure 104: South Asia & Pacific Market Y-o-Y Growth by Application, 2023 to 2033

Figure 105: South Asia & Pacific Market Attractiveness Analysis by Application, 2023 to 2033

Figure 106: South Asia & Pacific Market Share and BPS Analysis by Technology, 2023 to 2033

Figure 107: South Asia & Pacific Market Y-o-Y Growth by Technology, 2023 to 2033

Figure 108: South Asia & Pacific Market Attractiveness Analysis by Technology, 2023 to 2033

Figure 109: South Asia & Pacific Market Share and BPS Analysis by Sales Channel, 2023 to 2033

Figure 110: South Asia & Pacific Market Y-o-Y Growth by Sales Channel, 2023 to 2033

Figure 111: South Asia & Pacific Market Attractiveness Analysis by Sales Channel, 2023 to 2033

Figure 112: South Asia & Pacific Market Share and BPS Analysis by Country, 2023 to 2033

Figure 113: South Asia & Pacific Market Y-o-Y Growth by Country, 2023 to 2033

Figure 114: South Asia & Pacific Market Attractiveness Analysis by Country, 2023 to 2033

Figure 115: South Asia & Pacific Market Absolute $ Opportunity, 2018 to 2033

Figure 116: Middle East & Africa Market Share and BPS Analysis by Product Type, 2023 to 2033

Figure 117: Middle East & Africa Market Y-o-Y Growth by Product Type, 2023 to 2033

Figure 118: Middle East & Africa Market Attractiveness Analysis by Product Type, 2023 to 2033

Figure 119: Middle East & Africa Market Share and BPS Analysis by Application, 2023 to 2033

Figure 120: Middle East & Africa Market Y-o-Y Growth by Application, 2023 to 2033

Figure 121: Middle East & Africa Market Attractiveness Analysis by Application, 2023 to 2033

Figure 122: Middle East & Africa Market Share and BPS Analysis by Technology, 2023 to 2033

Figure 123: Middle East & Africa Market Y-o-Y Growth by Technology, 2023 to 2033

Figure 124: Middle East & Africa Market Attractiveness Analysis by Technology, 2023 to 2033

Figure 125: Middle East & Africa Market Share and BPS Analysis by Sales Channel, 2023 to 2033

Figure 126: Middle East & Africa Market Y-o-Y Growth by Sales Channel, 2023 to 2033

Figure 127: Middle East & Africa Market Attractiveness Analysis by Sales Channel, 2023 to 2033

Figure 128: Middle East & Africa Sodium Chloride Market Share and BPS Analysis by Country, 2023 to 2033

Figure 129: Middle East & Africa Sodium Chloride Market Y-o-Y Growth by Country, 2023 to 2033

Figure 130: Middle East & Africa Sodium Chloride Market Attractiveness Analysis by Country, 2023 to 2033

Figure 131: Middle East & Africa Market Absolute $ Opportunity, 2018 to 2033

Explore Process Automation Insights

View Reports

Kitchen Hood System Market