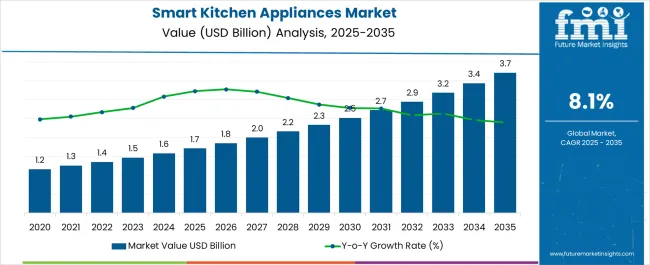
The smart kitchen appliances market is poised to reach a valuation of USD 1,450.8 million in 2023. In 2022, the market's valuation was reached around USD 1,326.1 million.
The market is predicted to register a healthy CAGR of 8.5% until the end of the forecast period. The valuation at the end of the forecast period is predicted to be USD 3,280.1 million. Thus, the smart kitchen appliances market is in for a promising period from 2023 to 2033.
Consumption Analysis in the Smart Kitchen Appliances Market
Attributes | Details |
---|---|
Smart Kitchen Appliances Market Value for 2023 | USD 1,450.8 million |
Projected Market Value for 2033 | USD 3,280.1 million |
Value-based CAGR of Market for 2023 to 2033 | 8.5% |
The smart kitchen appliances industry recorded significant growth during the historical period. While cost remains a sticking point in the appeal of smart kitchen appliances, the severity of the issue could be reduced over the forecast period.
Attributes | Details |
---|---|
Smart Kitchen Appliances Market Value in 2022 | USD 1,326.1 million |
More and more people are accessing disposable income, which could be spent on smart kitchen appliances. Smart kitchen appliance manufacturers are also making their products more affordable. Thus, the smart kitchen appliances market is expected to grow its consumer base during the forecast period.
For the forecast period, the smart kitchen appliances market is projected to grow at a significant rate of 8.5%. With consumers increasingly striving to ease their lives, smart kitchen appliances potentially have a big role. There is expected to be an increasing adaptation of smart kitchen appliances as people look to make trips to the kitchen more convenient.
Smart microwaves that send reminders to smartphones and smart refrigerators that keep a list of the food remaining in them are examples of smart kitchen appliances that increase convenience in kitchens. The smart kitchen appliances market is expected to benefit in the forecast period because these products make consumers' lives more comfortable.
Smart kitchen appliances rely on technology. The innovations in technology are expected to raise the bar as we advance. The infusion of AI into smart kitchen appliances is just one innovation that has propelled the market. With technology continuing to advance in leaps and bounds, the progression of the smart kitchen appliances market is expected to be strong.
The smart kitchen appliances market can be divided into the following segments: appliances and connectivity technology. By looking at the segments, consumers can determine what they prefer in their smart kitchen appliances. Information is also gleaned about what the consumers want their smart kitchen appliances to do.
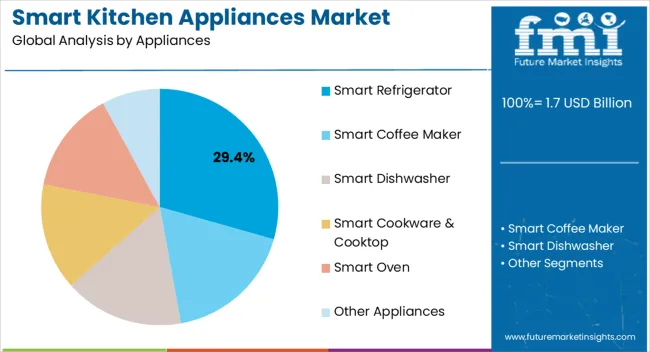
Smart refrigerators lead the appliances segment of the smart kitchen appliances market. In 2022, smart refrigerators accounted for 25.70% of appliance market share.
Attributes | Details |
---|---|
Top Appliance | Smart refrigerators |
Market Share in 2022 | 25.70% |
Smart refrigerators are becoming increasingly common in households. Due to constant innovations, smart refrigerators are getting smarter and smarter. With smart refrigerators, consumers can get to know what is inside the refrigerator without leaving their place with the help of an app. This and other advancements like modifying temperatures have ensured the demand for smart refrigerators remains high.
While smart refrigerators enjoy the highest share of the market, other appliances are predicted to show growth, too. Smart coffee makers and smart dishwashers are expected to grow strongly during the forecast period.
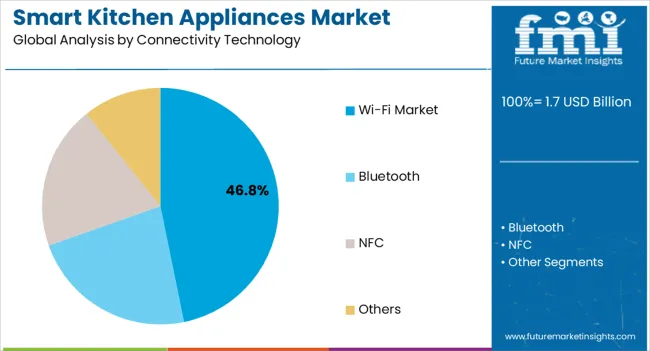
The rising importance of the internet has led to an increasing reliance on Wi-Fi. Customers are partial to having Wi-Fi connectivity even in their kitchen appliances. This has led to Wi-Fi-enabled smart kitchen appliances having a massive market share in the connectivity technology segment. Smart kitchen appliances with Wi-Fi connectivity accounted for 20.40% of the market in 2022.
Attributes | Details |
---|---|
Top Connectivity Technology | Wi-Fi |
Market Share in 2022 | 20.40% |
During earlier periods, smart kitchen appliances with Bluetooth technology were in vogue. However, the internet, and consequently Wi-Fi, have become necessary commodities in people's daily lives. As a result, Wi-Fi-enabled smart kitchen appliances have taken over from Bluetooth-enabled smart kitchen appliances.
North America and Europe are the beneficiaries of leading technologies. Thus, the technology-driven smart kitchen appliances market enjoys significant market share in the two regions. North America is especially fertile ground for the smart kitchen appliances market, with the United States having a mammoth market share.
Asia Pacific is also a rapidly growing market. Japan and China are forecasted to have significant growth in the coming years, contributing to the smart kitchen appliances growth in the Asia Pacific. Another region tipped to experience notable growth is the Middle East and Africa (MEA).
Countries | Market Share in 2022 |
---|---|
United States | 23% |
United Kingdom | 7.4% |
Germany | 6.2% |
Japan | 4.8% |
China | 6.2% |
The United States reigns supreme in terms of share in the smart kitchen appliances market. In 2022, the country accounted for a staggering 23% of the market.
Over the forecast period, the smart kitchen appliances market is projected to reach new heights in the country. Several factors contribute to making the United States such a lucrative market for smart kitchen appliances.
The abundance of top-notch hotels as well as houses is conducive to the growth of the smart kitchen appliances market. The market is also aided by government schemes that promote smarter living.
The high demand for smart kitchen appliances in the United Kingdom is a prime example of a revolution in smart appliances. The United Kingdom accounted for 7.4% of the smart kitchen appliances market share in 2022.
The acceptance of smart kitchen appliances in people's homes is a leading growth factor in the United Kingdom. The hospitality sector, too, is embracing smart kitchen appliances, further aiding the market.
Germany is another lucrative European country for the smart kitchen appliances market. In 2022, Germany accounted for a 6.2% share of the smart kitchen appliances market.
Germany is at the forefront of technological developments in Europe. There has also been an increase in the standard of living in Germany. These and other factors are expected to fuel the growth of Germany's smart kitchen appliances market.
Asia Pacific is a region with great potential for the smart kitchen appliances market. Japan is one of the leaders in this region. In 2022, Japan accounted for a 4.8% share of the global smart kitchen appliances market.
The ever-expanding economy of Japan is a significant contributing factor to the growth of the smart kitchen appliances market. The growing economy leads to development in the residential sectors, which in turn leads to more homes with smart requirements. Thus, the smart kitchen appliances market is propelled in Japan.
China is another region in the Asia Pacific where the smart kitchen appliances market is expected to grow at a rapid pace. In 2022, China accounted for 6.2% of the global smart kitchen appliances market share.
The intermingling of international brands and local manufacturers has left consumers with a variety of options in China. With the Chinese people’s lifestyle improving due to disposable income, the smart kitchen appliances market is enjoying notable growth in the country.
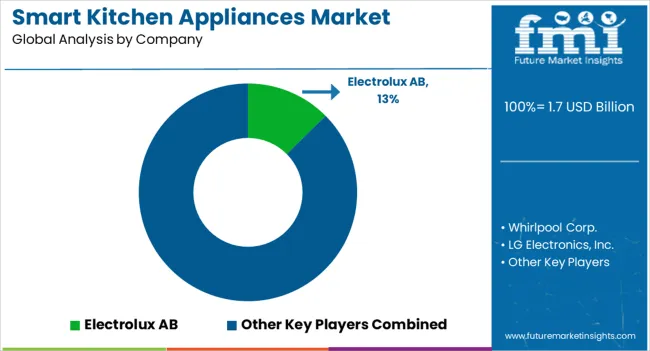
With technology essential to smart kitchen appliances, manufacturers are investing heavily to improve it. Significant money is going towards Research and Development (R&D) to come up with innovations. Smart kitchen appliance manufacturers are looking to get ahead of the competition through this strategy.
The market is fragmented, though several established players exist. There are opportunities for new entrants, and competition can be provided to the established manufacturers.
Recent Developments in the Smart Kitchen Appliances Market
Key Companies in the Smart Kitchen Appliances Market
Table 1: Global Market Value (US$ Million) Forecast by Region, 2018 to 2033
Table 2: Global Market Volume (Units) Forecast by Region, 2018 to 2033
Table 3: Global Market Value (US$ Million) Forecast by Components, 2018 to 2033
Table 4: Global Market Volume (Units) Forecast by Components, 2018 to 2033
Table 5: Global Market Value (US$ Million) Forecast by Appliances, 2018 to 2033
Table 6: Global Market Volume (Units) Forecast by Appliances, 2018 to 2033
Table 7: Global Market Value (US$ Million) Forecast by Connectivity Technology, 2018 to 2033
Table 8: Global Market Volume (Units) Forecast by Connectivity Technology, 2018 to 2033
Table 9: North America Market Value (US$ Million) Forecast by Country, 2018 to 2033
Table 10: North America Market Volume (Units) Forecast by Country, 2018 to 2033
Table 11: North America Market Value (US$ Million) Forecast by Components, 2018 to 2033
Table 12: North America Market Volume (Units) Forecast by Components, 2018 to 2033
Table 13: North America Market Value (US$ Million) Forecast by Appliances, 2018 to 2033
Table 14: North America Market Volume (Units) Forecast by Appliances, 2018 to 2033
Table 15: North America Market Value (US$ Million) Forecast by Connectivity Technology, 2018 to 2033
Table 16: North America Market Volume (Units) Forecast by Connectivity Technology, 2018 to 2033
Table 17: Latin America Market Value (US$ Million) Forecast by Country, 2018 to 2033
Table 18: Latin America Market Volume (Units) Forecast by Country, 2018 to 2033
Table 19: Latin America Market Value (US$ Million) Forecast by Components, 2018 to 2033
Table 20: Latin America Market Volume (Units) Forecast by Components, 2018 to 2033
Table 21: Latin America Market Value (US$ Million) Forecast by Appliances, 2018 to 2033
Table 22: Latin America Market Volume (Units) Forecast by Appliances, 2018 to 2033
Table 23: Latin America Market Value (US$ Million) Forecast by Connectivity Technology, 2018 to 2033
Table 24: Latin America Market Volume (Units) Forecast by Connectivity Technology, 2018 to 2033
Table 25: Western Europe Market Value (US$ Million) Forecast by Country, 2018 to 2033
Table 26: Western Europe Market Volume (Units) Forecast by Country, 2018 to 2033
Table 27: Western Europe Market Value (US$ Million) Forecast by Components, 2018 to 2033
Table 28: Western Europe Market Volume (Units) Forecast by Components, 2018 to 2033
Table 29: Western Europe Market Value (US$ Million) Forecast by Appliances, 2018 to 2033
Table 30: Western Europe Market Volume (Units) Forecast by Appliances, 2018 to 2033
Table 31: Western Europe Market Value (US$ Million) Forecast by Connectivity Technology, 2018 to 2033
Table 32: Western Europe Market Volume (Units) Forecast by Connectivity Technology, 2018 to 2033
Table 33: Eastern Europe Market Value (US$ Million) Forecast by Country, 2018 to 2033
Table 34: Eastern Europe Market Volume (Units) Forecast by Country, 2018 to 2033
Table 35: Eastern Europe Market Value (US$ Million) Forecast by Components, 2018 to 2033
Table 36: Eastern Europe Market Volume (Units) Forecast by Components, 2018 to 2033
Table 37: Eastern Europe Market Value (US$ Million) Forecast by Appliances, 2018 to 2033
Table 38: Eastern Europe Market Volume (Units) Forecast by Appliances, 2018 to 2033
Table 39: Eastern Europe Market Value (US$ Million) Forecast by Connectivity Technology, 2018 to 2033
Table 40: Eastern Europe Market Volume (Units) Forecast by Connectivity Technology, 2018 to 2033
Table 41: South Asia and Pacific Market Value (US$ Million) Forecast by Country, 2018 to 2033
Table 42: South Asia and Pacific Market Volume (Units) Forecast by Country, 2018 to 2033
Table 43: South Asia and Pacific Market Value (US$ Million) Forecast by Components, 2018 to 2033
Table 44: South Asia and Pacific Market Volume (Units) Forecast by Components, 2018 to 2033
Table 45: South Asia and Pacific Market Value (US$ Million) Forecast by Appliances, 2018 to 2033
Table 46: South Asia and Pacific Market Volume (Units) Forecast by Appliances, 2018 to 2033
Table 47: South Asia and Pacific Market Value (US$ Million) Forecast by Connectivity Technology, 2018 to 2033
Table 48: South Asia and Pacific Market Volume (Units) Forecast by Connectivity Technology, 2018 to 2033
Table 49: East Asia Market Value (US$ Million) Forecast by Country, 2018 to 2033
Table 50: East Asia Market Volume (Units) Forecast by Country, 2018 to 2033
Table 51: East Asia Market Value (US$ Million) Forecast by Components, 2018 to 2033
Table 52: East Asia Market Volume (Units) Forecast by Components, 2018 to 2033
Table 53: East Asia Market Value (US$ Million) Forecast by Appliances, 2018 to 2033
Table 54: East Asia Market Volume (Units) Forecast by Appliances, 2018 to 2033
Table 55: East Asia Market Value (US$ Million) Forecast by Connectivity Technology, 2018 to 2033
Table 56: East Asia Market Volume (Units) Forecast by Connectivity Technology, 2018 to 2033
Table 57: Middle East and Africa Market Value (US$ Million) Forecast by Country, 2018 to 2033
Table 58: Middle East and Africa Market Volume (Units) Forecast by Country, 2018 to 2033
Table 59: Middle East and Africa Market Value (US$ Million) Forecast by Components, 2018 to 2033
Table 60: Middle East and Africa Market Volume (Units) Forecast by Components, 2018 to 2033
Table 61: Middle East and Africa Market Value (US$ Million) Forecast by Appliances, 2018 to 2033
Table 62: Middle East and Africa Market Volume (Units) Forecast by Appliances, 2018 to 2033
Table 63: Middle East and Africa Market Value (US$ Million) Forecast by Connectivity Technology, 2018 to 2033
Table 64: Middle East and Africa Market Volume (Units) Forecast by Connectivity Technology, 2018 to 2033
Figure 1: Global Market Value (US$ Million) by Components, 2023 to 2033
Figure 2: Global Market Value (US$ Million) by Appliances, 2023 to 2033
Figure 3: Global Market Value (US$ Million) by Connectivity Technology, 2023 to 2033
Figure 4: Global Market Value (US$ Million) by Region, 2023 to 2033
Figure 5: Global Market Value (US$ Million) Analysis by Region, 2018 to 2033
Figure 6: Global Market Volume (Units) Analysis by Region, 2018 to 2033
Figure 7: Global Market Value Share (%) and BPS Analysis by Region, 2023 to 2033
Figure 8: Global Market Y-o-Y Growth (%) Projections by Region, 2023 to 2033
Figure 9: Global Market Value (US$ Million) Analysis by Components, 2018 to 2033
Figure 10: Global Market Volume (Units) Analysis by Components, 2018 to 2033
Figure 11: Global Market Value Share (%) and BPS Analysis by Components, 2023 to 2033
Figure 12: Global Market Y-o-Y Growth (%) Projections by Components, 2023 to 2033
Figure 13: Global Market Value (US$ Million) Analysis by Appliances, 2018 to 2033
Figure 14: Global Market Volume (Units) Analysis by Appliances, 2018 to 2033
Figure 15: Global Market Value Share (%) and BPS Analysis by Appliances, 2023 to 2033
Figure 16: Global Market Y-o-Y Growth (%) Projections by Appliances, 2023 to 2033
Figure 17: Global Market Value (US$ Million) Analysis by Connectivity Technology, 2018 to 2033
Figure 18: Global Market Volume (Units) Analysis by Connectivity Technology, 2018 to 2033
Figure 19: Global Market Value Share (%) and BPS Analysis by Connectivity Technology, 2023 to 2033
Figure 20: Global Market Y-o-Y Growth (%) Projections by Connectivity Technology, 2023 to 2033
Figure 21: Global Market Attractiveness by Components, 2023 to 2033
Figure 22: Global Market Attractiveness by Appliances, 2023 to 2033
Figure 23: Global Market Attractiveness by Connectivity Technology, 2023 to 2033
Figure 24: Global Market Attractiveness by Region, 2023 to 2033
Figure 25: North America Market Value (US$ Million) by Components, 2023 to 2033
Figure 26: North America Market Value (US$ Million) by Appliances, 2023 to 2033
Figure 27: North America Market Value (US$ Million) by Connectivity Technology, 2023 to 2033
Figure 28: North America Market Value (US$ Million) by Country, 2023 to 2033
Figure 29: North America Market Value (US$ Million) Analysis by Country, 2018 to 2033
Figure 30: North America Market Volume (Units) Analysis by Country, 2018 to 2033
Figure 31: North America Market Value Share (%) and BPS Analysis by Country, 2023 to 2033
Figure 32: North America Market Y-o-Y Growth (%) Projections by Country, 2023 to 2033
Figure 33: North America Market Value (US$ Million) Analysis by Components, 2018 to 2033
Figure 34: North America Market Volume (Units) Analysis by Components, 2018 to 2033
Figure 35: North America Market Value Share (%) and BPS Analysis by Components, 2023 to 2033
Figure 36: North America Market Y-o-Y Growth (%) Projections by Components, 2023 to 2033
Figure 37: North America Market Value (US$ Million) Analysis by Appliances, 2018 to 2033
Figure 38: North America Market Volume (Units) Analysis by Appliances, 2018 to 2033
Figure 39: North America Market Value Share (%) and BPS Analysis by Appliances, 2023 to 2033
Figure 40: North America Market Y-o-Y Growth (%) Projections by Appliances, 2023 to 2033
Figure 41: North America Market Value (US$ Million) Analysis by Connectivity Technology, 2018 to 2033
Figure 42: North America Market Volume (Units) Analysis by Connectivity Technology, 2018 to 2033
Figure 43: North America Market Value Share (%) and BPS Analysis by Connectivity Technology, 2023 to 2033
Figure 44: North America Market Y-o-Y Growth (%) Projections by Connectivity Technology, 2023 to 2033
Figure 45: North America Market Attractiveness by Components, 2023 to 2033
Figure 46: North America Market Attractiveness by Appliances, 2023 to 2033
Figure 47: North America Market Attractiveness by Connectivity Technology, 2023 to 2033
Figure 48: North America Market Attractiveness by Country, 2023 to 2033
Figure 49: Latin America Market Value (US$ Million) by Components, 2023 to 2033
Figure 50: Latin America Market Value (US$ Million) by Appliances, 2023 to 2033
Figure 51: Latin America Market Value (US$ Million) by Connectivity Technology, 2023 to 2033
Figure 52: Latin America Market Value (US$ Million) by Country, 2023 to 2033
Figure 53: Latin America Market Value (US$ Million) Analysis by Country, 2018 to 2033
Figure 54: Latin America Market Volume (Units) Analysis by Country, 2018 to 2033
Figure 55: Latin America Market Value Share (%) and BPS Analysis by Country, 2023 to 2033
Figure 56: Latin America Market Y-o-Y Growth (%) Projections by Country, 2023 to 2033
Figure 57: Latin America Market Value (US$ Million) Analysis by Components, 2018 to 2033
Figure 58: Latin America Market Volume (Units) Analysis by Components, 2018 to 2033
Figure 59: Latin America Market Value Share (%) and BPS Analysis by Components, 2023 to 2033
Figure 60: Latin America Market Y-o-Y Growth (%) Projections by Components, 2023 to 2033
Figure 61: Latin America Market Value (US$ Million) Analysis by Appliances, 2018 to 2033
Figure 62: Latin America Market Volume (Units) Analysis by Appliances, 2018 to 2033
Figure 63: Latin America Market Value Share (%) and BPS Analysis by Appliances, 2023 to 2033
Figure 64: Latin America Market Y-o-Y Growth (%) Projections by Appliances, 2023 to 2033
Figure 65: Latin America Market Value (US$ Million) Analysis by Connectivity Technology, 2018 to 2033
Figure 66: Latin America Market Volume (Units) Analysis by Connectivity Technology, 2018 to 2033
Figure 67: Latin America Market Value Share (%) and BPS Analysis by Connectivity Technology, 2023 to 2033
Figure 68: Latin America Market Y-o-Y Growth (%) Projections by Connectivity Technology, 2023 to 2033
Figure 69: Latin America Market Attractiveness by Components, 2023 to 2033
Figure 70: Latin America Market Attractiveness by Appliances, 2023 to 2033
Figure 71: Latin America Market Attractiveness by Connectivity Technology, 2023 to 2033
Figure 72: Latin America Market Attractiveness by Country, 2023 to 2033
Figure 73: Western Europe Market Value (US$ Million) by Components, 2023 to 2033
Figure 74: Western Europe Market Value (US$ Million) by Appliances, 2023 to 2033
Figure 75: Western Europe Market Value (US$ Million) by Connectivity Technology, 2023 to 2033
Figure 76: Western Europe Market Value (US$ Million) by Country, 2023 to 2033
Figure 77: Western Europe Market Value (US$ Million) Analysis by Country, 2018 to 2033
Figure 78: Western Europe Market Volume (Units) Analysis by Country, 2018 to 2033
Figure 79: Western Europe Market Value Share (%) and BPS Analysis by Country, 2023 to 2033
Figure 80: Western Europe Market Y-o-Y Growth (%) Projections by Country, 2023 to 2033
Figure 81: Western Europe Market Value (US$ Million) Analysis by Components, 2018 to 2033
Figure 82: Western Europe Market Volume (Units) Analysis by Components, 2018 to 2033
Figure 83: Western Europe Market Value Share (%) and BPS Analysis by Components, 2023 to 2033
Figure 84: Western Europe Market Y-o-Y Growth (%) Projections by Components, 2023 to 2033
Figure 85: Western Europe Market Value (US$ Million) Analysis by Appliances, 2018 to 2033
Figure 86: Western Europe Market Volume (Units) Analysis by Appliances, 2018 to 2033
Figure 87: Western Europe Market Value Share (%) and BPS Analysis by Appliances, 2023 to 2033
Figure 88: Western Europe Market Y-o-Y Growth (%) Projections by Appliances, 2023 to 2033
Figure 89: Western Europe Market Value (US$ Million) Analysis by Connectivity Technology, 2018 to 2033
Figure 90: Western Europe Market Volume (Units) Analysis by Connectivity Technology, 2018 to 2033
Figure 91: Western Europe Market Value Share (%) and BPS Analysis by Connectivity Technology, 2023 to 2033
Figure 92: Western Europe Market Y-o-Y Growth (%) Projections by Connectivity Technology, 2023 to 2033
Figure 93: Western Europe Market Attractiveness by Components, 2023 to 2033
Figure 94: Western Europe Market Attractiveness by Appliances, 2023 to 2033
Figure 95: Western Europe Market Attractiveness by Connectivity Technology, 2023 to 2033
Figure 96: Western Europe Market Attractiveness by Country, 2023 to 2033
Figure 97: Eastern Europe Market Value (US$ Million) by Components, 2023 to 2033
Figure 98: Eastern Europe Market Value (US$ Million) by Appliances, 2023 to 2033
Figure 99: Eastern Europe Market Value (US$ Million) by Connectivity Technology, 2023 to 2033
Figure 100: Eastern Europe Market Value (US$ Million) by Country, 2023 to 2033
Figure 101: Eastern Europe Market Value (US$ Million) Analysis by Country, 2018 to 2033
Figure 102: Eastern Europe Market Volume (Units) Analysis by Country, 2018 to 2033
Figure 103: Eastern Europe Market Value Share (%) and BPS Analysis by Country, 2023 to 2033
Figure 104: Eastern Europe Market Y-o-Y Growth (%) Projections by Country, 2023 to 2033
Figure 105: Eastern Europe Market Value (US$ Million) Analysis by Components, 2018 to 2033
Figure 106: Eastern Europe Market Volume (Units) Analysis by Components, 2018 to 2033
Figure 107: Eastern Europe Market Value Share (%) and BPS Analysis by Components, 2023 to 2033
Figure 108: Eastern Europe Market Y-o-Y Growth (%) Projections by Components, 2023 to 2033
Figure 109: Eastern Europe Market Value (US$ Million) Analysis by Appliances, 2018 to 2033
Figure 110: Eastern Europe Market Volume (Units) Analysis by Appliances, 2018 to 2033
Figure 111: Eastern Europe Market Value Share (%) and BPS Analysis by Appliances, 2023 to 2033
Figure 112: Eastern Europe Market Y-o-Y Growth (%) Projections by Appliances, 2023 to 2033
Figure 113: Eastern Europe Market Value (US$ Million) Analysis by Connectivity Technology, 2018 to 2033
Figure 114: Eastern Europe Market Volume (Units) Analysis by Connectivity Technology, 2018 to 2033
Figure 115: Eastern Europe Market Value Share (%) and BPS Analysis by Connectivity Technology, 2023 to 2033
Figure 116: Eastern Europe Market Y-o-Y Growth (%) Projections by Connectivity Technology, 2023 to 2033
Figure 117: Eastern Europe Market Attractiveness by Components, 2023 to 2033
Figure 118: Eastern Europe Market Attractiveness by Appliances, 2023 to 2033
Figure 119: Eastern Europe Market Attractiveness by Connectivity Technology, 2023 to 2033
Figure 120: Eastern Europe Market Attractiveness by Country, 2023 to 2033
Figure 121: South Asia and Pacific Market Value (US$ Million) by Components, 2023 to 2033
Figure 122: South Asia and Pacific Market Value (US$ Million) by Appliances, 2023 to 2033
Figure 123: South Asia and Pacific Market Value (US$ Million) by Connectivity Technology, 2023 to 2033
Figure 124: South Asia and Pacific Market Value (US$ Million) by Country, 2023 to 2033
Figure 125: South Asia and Pacific Market Value (US$ Million) Analysis by Country, 2018 to 2033
Figure 126: South Asia and Pacific Market Volume (Units) Analysis by Country, 2018 to 2033
Figure 127: South Asia and Pacific Market Value Share (%) and BPS Analysis by Country, 2023 to 2033
Figure 128: South Asia and Pacific Market Y-o-Y Growth (%) Projections by Country, 2023 to 2033
Figure 129: South Asia and Pacific Market Value (US$ Million) Analysis by Components, 2018 to 2033
Figure 130: South Asia and Pacific Market Volume (Units) Analysis by Components, 2018 to 2033
Figure 131: South Asia and Pacific Market Value Share (%) and BPS Analysis by Components, 2023 to 2033
Figure 132: South Asia and Pacific Market Y-o-Y Growth (%) Projections by Components, 2023 to 2033
Figure 133: South Asia and Pacific Market Value (US$ Million) Analysis by Appliances, 2018 to 2033
Figure 134: South Asia and Pacific Market Volume (Units) Analysis by Appliances, 2018 to 2033
Figure 135: South Asia and Pacific Market Value Share (%) and BPS Analysis by Appliances, 2023 to 2033
Figure 136: South Asia and Pacific Market Y-o-Y Growth (%) Projections by Appliances, 2023 to 2033
Figure 137: South Asia and Pacific Market Value (US$ Million) Analysis by Connectivity Technology, 2018 to 2033
Figure 138: South Asia and Pacific Market Volume (Units) Analysis by Connectivity Technology, 2018 to 2033
Figure 139: South Asia and Pacific Market Value Share (%) and BPS Analysis by Connectivity Technology, 2023 to 2033
Figure 140: South Asia and Pacific Market Y-o-Y Growth (%) Projections by Connectivity Technology, 2023 to 2033
Figure 141: South Asia and Pacific Market Attractiveness by Components, 2023 to 2033
Figure 142: South Asia and Pacific Market Attractiveness by Appliances, 2023 to 2033
Figure 143: South Asia and Pacific Market Attractiveness by Connectivity Technology, 2023 to 2033
Figure 144: South Asia and Pacific Market Attractiveness by Country, 2023 to 2033
Figure 145: East Asia Market Value (US$ Million) by Components, 2023 to 2033
Figure 146: East Asia Market Value (US$ Million) by Appliances, 2023 to 2033
Figure 147: East Asia Market Value (US$ Million) by Connectivity Technology, 2023 to 2033
Figure 148: East Asia Market Value (US$ Million) by Country, 2023 to 2033
Figure 149: East Asia Market Value (US$ Million) Analysis by Country, 2018 to 2033
Figure 150: East Asia Market Volume (Units) Analysis by Country, 2018 to 2033
Figure 151: East Asia Market Value Share (%) and BPS Analysis by Country, 2023 to 2033
Figure 152: East Asia Market Y-o-Y Growth (%) Projections by Country, 2023 to 2033
Figure 153: East Asia Market Value (US$ Million) Analysis by Components, 2018 to 2033
Figure 154: East Asia Market Volume (Units) Analysis by Components, 2018 to 2033
Figure 155: East Asia Market Value Share (%) and BPS Analysis by Components, 2023 to 2033
Figure 156: East Asia Market Y-o-Y Growth (%) Projections by Components, 2023 to 2033
Figure 157: East Asia Market Value (US$ Million) Analysis by Appliances, 2018 to 2033
Figure 158: East Asia Market Volume (Units) Analysis by Appliances, 2018 to 2033
Figure 159: East Asia Market Value Share (%) and BPS Analysis by Appliances, 2023 to 2033
Figure 160: East Asia Market Y-o-Y Growth (%) Projections by Appliances, 2023 to 2033
Figure 161: East Asia Market Value (US$ Million) Analysis by Connectivity Technology, 2018 to 2033
Figure 162: East Asia Market Volume (Units) Analysis by Connectivity Technology, 2018 to 2033
Figure 163: East Asia Market Value Share (%) and BPS Analysis by Connectivity Technology, 2023 to 2033
Figure 164: East Asia Market Y-o-Y Growth (%) Projections by Connectivity Technology, 2023 to 2033
Figure 165: East Asia Market Attractiveness by Components, 2023 to 2033
Figure 166: East Asia Market Attractiveness by Appliances, 2023 to 2033
Figure 167: East Asia Market Attractiveness by Connectivity Technology, 2023 to 2033
Figure 168: East Asia Market Attractiveness by Country, 2023 to 2033
Figure 169: Middle East and Africa Market Value (US$ Million) by Components, 2023 to 2033
Figure 170: Middle East and Africa Market Value (US$ Million) by Appliances, 2023 to 2033
Figure 171: Middle East and Africa Market Value (US$ Million) by Connectivity Technology, 2023 to 2033
Figure 172: Middle East and Africa Market Value (US$ Million) by Country, 2023 to 2033
Figure 173: Middle East and Africa Market Value (US$ Million) Analysis by Country, 2018 to 2033
Figure 174: Middle East and Africa Market Volume (Units) Analysis by Country, 2018 to 2033
Figure 175: Middle East and Africa Market Value Share (%) and BPS Analysis by Country, 2023 to 2033
Figure 176: Middle East and Africa Market Y-o-Y Growth (%) Projections by Country, 2023 to 2033
Figure 177: Middle East and Africa Market Value (US$ Million) Analysis by Components, 2018 to 2033
Figure 178: Middle East and Africa Market Volume (Units) Analysis by Components, 2018 to 2033
Figure 179: Middle East and Africa Market Value Share (%) and BPS Analysis by Components, 2023 to 2033
Figure 180: Middle East and Africa Market Y-o-Y Growth (%) Projections by Components, 2023 to 2033
Figure 181: Middle East and Africa Market Value (US$ Million) Analysis by Appliances, 2018 to 2033
Figure 182: Middle East and Africa Market Volume (Units) Analysis by Appliances, 2018 to 2033
Figure 183: Middle East and Africa Market Value Share (%) and BPS Analysis by Appliances, 2023 to 2033
Figure 184: Middle East and Africa Market Y-o-Y Growth (%) Projections by Appliances, 2023 to 2033
Figure 185: Middle East and Africa Market Value (US$ Million) Analysis by Connectivity Technology, 2018 to 2033
Figure 186: Middle East and Africa Market Volume (Units) Analysis by Connectivity Technology, 2018 to 2033
Figure 187: Middle East and Africa Market Value Share (%) and BPS Analysis by Connectivity Technology, 2023 to 2033
Figure 188: Middle East and Africa Market Y-o-Y Growth (%) Projections by Connectivity Technology, 2023 to 2033
Figure 189: Middle East and Africa Market Attractiveness by Components, 2023 to 2033
Figure 190: Middle East and Africa Market Attractiveness by Appliances, 2023 to 2033
Figure 191: Middle East and Africa Market Attractiveness by Connectivity Technology, 2023 to 2033
Figure 192: Middle East and Africa Market Attractiveness by Country, 2023 to 2033
Whirlpool Corporation, LG Electronics, and Samsung Electronics Co. Ltd. are prominent players in the market.
In 2023, the smart kitchen appliances market is estimated to be USD 1,450.8 million.
The industry is projected to reach a valuation of USD 3,280.1 million in 2033.
Smart kitchen appliances with voice assistants and smart homes aiding the market growth.
The smart kitchen appliances market may record a growth of 8.5% through 2033.
Explore Similar Insights
Thank you!
You will receive an email from our Business Development Manager. Please be sure to check your SPAM/JUNK folder too.