Cooker Hood Market Size, Share, and Forecast Outlook 2025 to 2035

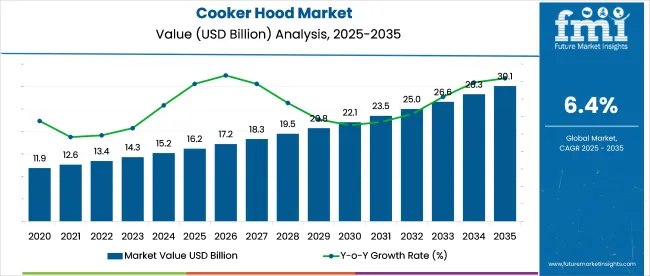
The cooker hood market is forecasted to reach USD 30.1 billion by 2035, up from USD 16.2 billion in 2025, growing at a CAGR of 6.4%. Global kitchen installations are being shaped by consumer preference for concealed and high-efficiency ventilation systems. Demand has been supported by steady real estate development and replacement cycles in high-volume housing sectors.

Quick Stats for Cooker Hood Market

  • Cooker Hood Market Value (2025): USD 16.2 billion
  • Cooker Hood Market Forecast Value (2035): USD 30.1 billion
  • Cooker Hood Market Forecast CAGR (2025 to 2035): 6.4%
  • Leading Segment in 2025: Wall-Mounted Chimney 70% market share
  • Key Growth Region: Europe
  • Key Players: BSH Home Appliances Group, Bosch, Siemens, Luxair Limited, Inflame Appliances Ltd.

Cooker Hood Market Market Value Analysis

Metric Value
Industry Size (2025E) USD 16.2 billion
Industry Value (2035F) USD 30.1 billion
CAGR (2025 to 2035) 6.4%

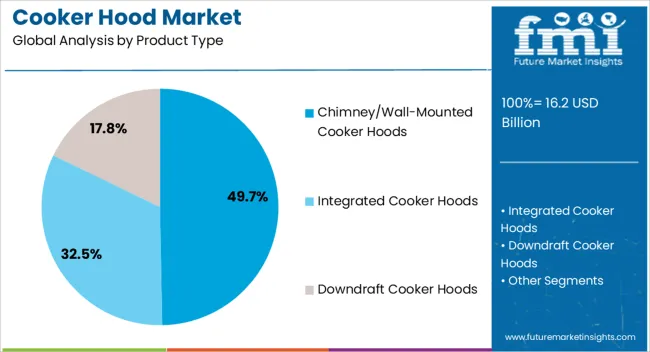
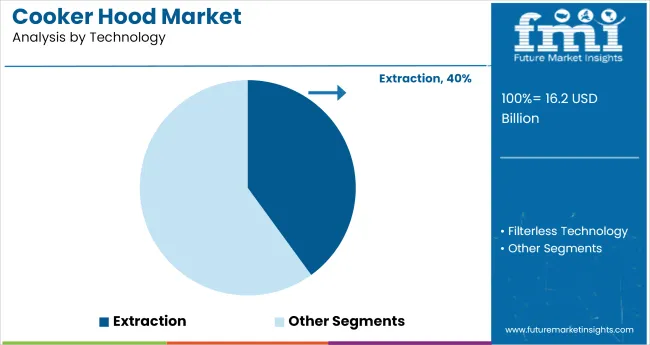
Brands have responded with models focusing on multi-speed control, high air displacement, and low noise output. Chimney or wall-mounted cooker hoods are projected to dominate the product landscape, holding 70% of the market. Ducted extraction systems, preferred for efficient air clearance, comprise 40% of the technological segment.

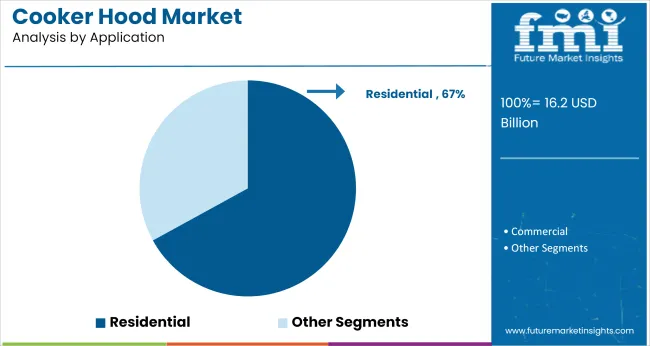
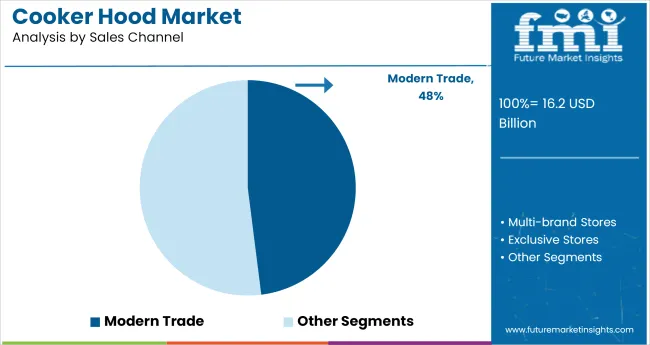
The residential segment remains dominant, with 67% of market demand attributed to home installations. Offline retail including specialty appliance outlets and modern trade is expected to retain its lead, accounting for 48% of all sales.

The cooker hood market is witnessing robust expansion, supported by quantifiable shifts in consumer behavior and regulatory standards. With increasing awareness of indoor air pollutants linked to cooking emissions, especially particulate matter and VOCs, households are opting for high-performance ducted systems.

These models, despite higher installation costs, are gaining preference due to superior odor and grease extraction, particularly in regions with stringent air quality norms like Western Europe and parts of Asia-Pacific.

Cooker hoods account for approximately 15-18% of the global kitchen appliances market and 20-22% within built-in appliances due to their integration in modular kitchen setups. In the ventilation equipment market, they contribute a significant 30-35% share, driven by demand for effective smoke and odor removal.

Within the broader home appliances and residential equipment markets, their share ranges from 5-10%. Smart home appliances see 4-6% cooker hood inclusion, supported by rising IoT adoption. In household electrical appliances and food preparation segments, they represent 7-9% and 12-14%, respectively.

Cooker Hood Market: Analysis by Top Investment Segments

Chimney-style cooker hoods dominate the product landscape, while ducted extraction remains the top-performing technology. Residential applications drive demand, especially in modular kitchens, and offline retail continues to lead sales despite the rise of e-commerce.

Chimney/Wall-Mounted Hoods Dominate with Design and Utility Edge

Chimney or wall-mounted cooker hoods are projected to hold nearly 70% of the global product type market in 2025, growing at a 4.9% YoY rate. Their dominance is rooted in modular kitchen integration, combining aesthetic appeal with efficient smoke extraction.

Preferred in urban homes, these hoods cater to both performance and visual appeal, making them the default option in most mid- to premium-range residential builds. In contrast, under-cabinet and island hoods are niche, with limited growth due to installation constraints. As home renovations accelerate in developing regions, chimney hoods remain the most scalable product category.
  • 4.9% YoY growth seen in chimney-style hoods due to urban modular kitchen adoption.
  • Island and under-cabinet variants hold under 20% share, growing at under 2% YoY.
  • Demand rises for sleek designs with auto-clean, motion sensor, and touch panel features.

Extraction (Ducted) Systems Lead Despite Higher Installation Cost

Cooker Hood Market Analysis By Technology

Ducted extraction systems account for the 40% technology share in the cooker hood market, favored for their 5.2% YoY growth driven by high-performance odor and grease removal. Especially in high-cooking-frequency households, ducted hoods outperform recirculation models in air purification.

Despite higher installation and space requirements, they dominate in Asia-Pacific and Europe due to stringent indoor air quality norms. Recirculation technology, while cost-effective and easier to retrofit, trails with a 2.3% YoY increase, mostly appealing to apartments and rental properties where permanent fixtures are impractical.
  • Ducted systems saw 5.2% YoY growth, supported by awareness of indoor air health.
  • Recirculating hoods remain popular in rental homes but grew only 2.3% YoY.
  • Retrofit installations still favor recirculation, but long-term buyers prefer ducted options.

Residential Use Drives Market with Rising Modular Kitchen Integration

Cooker Hood Market Analysis By Application

The residential segment constitutes around 67% of cooker hood demand in 2025, with a consistent 4.7% YoY growth. Growth is primarily driven by modular kitchen installations, increased awareness of indoor air quality, and aesthetic preferences in modern homes.

Urban apartment dwellers increasingly prioritize compact, low-noise, and energy-efficient hoods, often bundled with kitchen cabinetry. Commercial kitchens, while steady in growth, remain niche due to their specialized ventilation systems. Residential adoption is also stimulated by rising disposable income in Asia and renovation trends in Europe and North America.
  • Residential use grew 4.7% YoY, driven by modular housing and middle-class kitchen upgrades.
  • Commercial installations saw only 2.1% YoY growth, limited to institutional projects.
  • Built-in cooker hoods are gaining share in new residential construction segments.

Modern Trade Retains Lead Amid Digital Acceleration

Cooker Hood Market Analysis By Sales Channel

Modern trade-including specialty appliance stores and exclusive brand outlets-continues to lead sales channels with a 48% market share in 2025, despite e-commerce’s faster 9.1% YoY growth. Consumers still favor in-store purchase of large appliances like cooker hoods due to the need for consultation, live demonstrations, and bundled installation services.

Modern trade dominance persists in Tier 2 and Tier 3 cities, where brand showrooms offer localized service. While online channels attract tech-savvy buyers with discount models and reviews, the tactile and assisted nature of modern trade maintains loyalty in premium categories.

  • Modern trade held 48% share with 3.6% YoY growth, bolstered by bundled service offerings.
  • E-commerce saw 9.1% YoY growth, led by flash sales and filter-based product discovery.
  • Physical showrooms excel in premium product demos and EMI-led conversions.

Cooker Hood Market Dynamics

The cooker hood market is expanding steadily, fueled by rising home renovations, preference for efficient ventilation, and increasing demand for low-noise, design-forward appliances in modular kitchens across urban and suburban households.

Enhanced Indoor Air Quality and Design Integration Driving Purchases

Homeowners are prioritizing cooker hoods that effectively remove smoke, grease, and odors. Premium hoods offering extraction rates over 700 m³/h now make up nearly 40% of sales in remodeled kitchens. Designer finishes-such as stainless steel, matte black, and integrated downdraft systems-are creating style-first appeal.

Kitchen remodel firms report cooker hood inclusion in 85% of upgrade projects. As a result, extractors with low noise levels (<55 dB) and customizable lighting elements are increasingly seen as essential centerpieces in modern kitchen design.

  • High-performance hoods (extraction >700 m³/h) capture growing share in premium renovation projects.
  • Quiet operation (<55 dB) and LED-integrated features are becoming standard consumer expectations.
  • Designer finishes drive aesthetic integration and justify higher pricing in mid- to high-end homes.

Smart Features and Energy Efficiency Shaping Competitive Landscape

Manufacturers are embedding sensors, auto-adjustment modes, and energy-saving motors to stand out. Auto-activating hoods that adjust fan speed based on heat or steam detection are capturing 25% of new product launches. Energy-efficient brushless DC motors now power over 60% of models, reducing power use by 20% compared to induction motors.

Connectivity with kitchen IoT systems for remote control and maintenance alerts is also gaining ground. These features are improving consumer convenience, reducing operating costs, and supporting manufacturers’ efforts to differentiate through performance and smart functionality.
  • Auto-adjusting fan speed models account for a quarter of all new product introductions.
  • Brushless DC motors enhance energy efficiency by 20% compared to legacy induction options.
  • IoT-enabled maintenance alerts and remote controls are boosting service satisfaction in connected homes.

Designing, Distributing, and Marketing Trends in the Cooker Hood Market by Country

Cooker Hood Market Cagr Analysis By Country

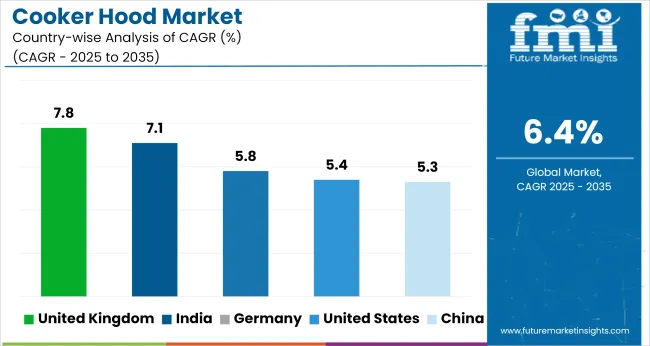
Country CAGR
United States 5.4%
United Kingdom 7.8%
Germany 5.8%
India 7.1%
China 5.3%

The global cooker hood market is projected to grow at a CAGR of 6.4% from 2025 to 2035, driven by rising urbanization, modular kitchen adoption, and demand for energy-efficient ventilation solutions. The United Kingdom leads growth among key markets with a 7.8% CAGR, supported by kitchen remodeling trends and premium appliance upgrades.

India follows at 7.1%, reflecting expanding middle-class housing, real estate development, and demand for ductless and auto-clean models. Among OECD countries, Germany (5.8%) and the United States (5.4%) show stable replacement demand and high penetration of built-in kitchen systems.

China, at 5.3%, reflects maturing demand with a shift toward smart features and IoT-enabled ventilation products.

This report covers detailed analysis of 40+ countries, and the top five countries have been shared as a reference.

United States Cooker Hood Market Upgrades

United States cooker hood sales are forecast to grow at a 5.4% CAGR, supported by residential kitchen remodeling and rising demand for energy-efficient smart appliances. YoY growth in ductless hood installations was 17% in 2024, driven by high-rise apartments and rental units.

Touchless controls and smart connectivity features expanded 2.2× YoY in premium kitchen setups. Builder-grade replacements remain steady, but the shift toward mid-range and customizable stainless steel models is gaining traction in suburban households. Home improvement retailers are reporting double-digit sales increases in combo bundles with cooktops.

  • Smart-enabled hoods grew 2.2× YoY in mid to premium home segments
  • Ductless installations rose 17% YoY in space-constrained apartments
  • Combo appliance bundles drove 14% YoY growth in large-format retail

China Cooker Hood Market Analysis

Growing at a 5.3% CAGR, China’s cooker hood market is adapting to urban housing formats, with compact, high-suction models leading volume gains. Wall-mounted hoods under 800mm rose 28% YoY in 2024, particularly among young couples and renters.

AI-powered odor sensors and app-controlled models saw 32% YoY growth on Tier 1 e-commerce platforms. Local brands dominate with 71% market share, though imported luxury models are gaining visibility via livestream channels. Retrofit demand continues in older apartment blocks, aided by provincial subsidies for clean cooking upgrades.

  • Wall-mounted compact models rose 28% YoY in space-limited households
  • AI and app-connected hoods grew 32% YoY via online-exclusive SKUs
  • Local brands held 71% share, with livestream selling fueling trials

India Cooker Hood Market Adoption

India’s cooker hood market is expanding at a 7.1% CAGR, fueled by rising disposable incomes, real estate growth, and aspirational home improvements. Year-over-year growth of island chimney sales was 45% in metro cities, led by kitchen island adoption in new constructions.

Baffle filter models saw 38% YoY growth due to better suitability for Indian cooking styles. Online marketplaces posted a 2.6× YoY jump in demand from Tier 2 and Tier 3 cities, driven by financing schemes and influencer-led video demos. Builders are increasingly including hoods in premium home packages.

  • Island hoods rose 45% YoY in newly built metro apartments
  • Baffle filter models expanded 38% YoY due to oil-heavy cooking needs
  • E-commerce demand grew 2.6× YoY from Tier 2-3 urban centers

Germany Cooker Hood Market Outlook

Germany is seeing a 5.8% CAGR in cooker hood demand, led by integrated, minimalist designs and regulatory standards for energy efficiency. Downdraft extractor sales grew 22% YoY, especially in open-plan kitchens where seamless aesthetics matter.

Silence-rated hoods with under-50 dB performance saw a 31% YoY increase across mid to premium builds. In-built carbon filter variants gained 27% YoY, meeting EU guidelines for indoor air quality. German consumers continue to prefer high-precision venting aligned with kitchen cabinetry, and domestic manufacturers are strengthening export-focused smart models.

  • Downdraft models rose 22% YoY among open-concept kitchen buyers
  • Ultra-quiet hoods (<50 dB) increased 31% YoY across new home projects
  • Carbon-filtered variants grew 27% YoY due to EU air quality focus

United Kingdom Cooker Hood Market Demand

United Kingdom is registering a strong 7.8% CAGR, driven by design-led renovations, space-saving appliances, and higher aesthetic value in modern kitchens. Slimline and angled hoods saw a 3.2× YoY sales increase in 2024, especially in renovated city flats.

Smart hoods with gesture controls expanded 44% YoY, integrated into IoT-based home ecosystems. Retailers report that recirculating models now comprise 62% of online purchases, highlighting retrofitting as a key market driver. Interior designers are increasingly selecting hood models with color and finish customization, pushing growth in premium design SKUs.
  • Slimline and angled hoods surged 3.2× YoY in small-format kitchens
  • Gesture-controlled hoods rose 44% YoY in connected smart homes
  • Recirculating units made up 62% of online sales, up from 49% YoY

Leading Cooker Hood Market Suppliers

Cooker Hood Market Analysis By Company

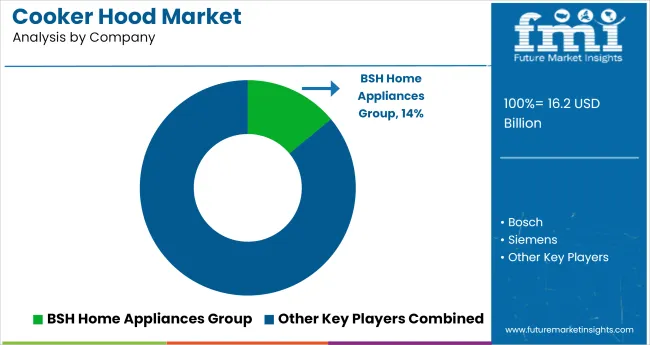
Leading Company - BSH Home Appliances Group

Market Share - 14%

The cooker hood market is defined by a tiered competitive structure based on technological sophistication, design innovation, and regional penetration. Tier 1 players such as BSH Home Appliances Group (Bosch, Siemens) and Elica S.p.A. lead through advanced filtration technologies, energy-efficient systems, and premium aesthetics tailored for modern kitchens.

Tier 2 companies including Falmec, Hafele, and Luxair focus on mid-to-high-end segments with a strong emphasis on silent operation, smart control integration, and modular designs. Tier 3 manufacturers like Inflame Appliances, Westin, and Eico A/S serve localized markets with cost-effective models, balancing performance with affordability. Product differentiation increasingly relies on smart ventilation, noise reduction, and compliance with energy and air quality regulations.

Recent Industry News

  • Elica S.p.A. acquired the remaining 0.56% stake in its Chinese arm, Putian, for €2 million. The move finalizes its ownership, creating a strategic supply hub for expanding operations across EMEA and North America by 2027.

Key Players

  • BSH Home Appliances Group
  • Bosch
  • Siemens
  • Luxair Limited
  • Inflame Appliances Ltd
  • Hafele Appliances
  • Falmec Kitchen Appliance Limited
  • Westin
  • Elica S.p.A.
  • Eico A/S

Report Scope Table Covered in Cooker Hood Market

Report Attributes Details
Current Total Market Size (2025) USD 16.2 billion
Projected Market Size (2035) USD 30.1 billion
CAGR (2025 to 2035) 6.4%
Base Year for Estimation 2024
Historical Period 2020 to 2024
Projection Period 2025 to 2035
Quantitative Units USD billion for value and thousand units for volume
Product Types Analyzed Chimney/Wall-Mounted Cooker Hoods, Integrated Cooker Hoods, Downdraft Cooker Hoods
Technologies Analyzed Extraction Technology, Filterless Technology
Applications Analyzed Residential, Commercial
Sales Channels Analyzed Modern Trade, Multi-Brand Stores, Exclusive Stores, Online Stores, Independent Stores, Others
Regions Covered North America, Europe, Asia Pacific, Middle East & Africa, Latin America
Key Players Influencing the Market BSH Home Appliances Group, Bosch, Siemens, Luxair Limited, Inflame Appliances Ltd, Hafele Appliances, Falmec Kitchen Appliance Limited, Westin, Elica S.p.A., Eico A/S
Additional Attributes Dollar by sales, share by product type and sales channel, growing demand for energy-efficient and smart kitchen appliances, rising residential kitchen renovations, online retail penetration, consumer preference for low-noise and high-suction systems, and strong demand across emerging economies.

Key Segments

By Product Type:

Based on product type, the industry is divided into chimney/wall-mounted cooker hoods, integrated cooker hoods, and downdraft cooker hoods.

By Technology:

By technology, the industry is bifurcated into extraction and filterless technology.

By Application:

Different applications of range hoods include residential and commercial.

By Sales Channel:

Various sales channels of range hoods consist of modern trade, multi-brand stores, exclusive stores, online stores, independent stores, and others.

By Region:

Industry growth is examined in key countries of North America, Europe, Asia Pacific, Middle East and Africa, and Latin America.

Table of Content

  1. Executive Summary
    • Global Market Outlook
    • Demand-side Trends
    • Supply-side Trends
    • Technology Roadmap Analysis
    • Analysis and Recommendations
  2. Market Overview
    • Market Coverage / Taxonomy
    • Market Definition / Scope / Limitations
  3. Market Background
    • Market Dynamics
      • Drivers
      • Restraints
      • Opportunity
      • Trends
    • Scenario Forecast
      • Demand in Optimistic Scenario
      • Demand in Likely Scenario
      • Demand in Conservative Scenario
    • Opportunity Map Analysis
    • Product Life Cycle Analysis
    • Supply Chain Analysis
      • Supply Side Participants and their Roles
        • Producers
        • Mid-Level Participants (Traders/ Agents/ Brokers)
        • Wholesalers and Distributors
      • Value Added and Value Created at Node in the Supply Chain
      • List of Raw Material Suppliers
      • List of Existing and Potential Buyer’s
    • Investment Feasibility Matrix
    • Value Chain Analysis
      • Profit Margin Analysis
      • Wholesalers and Distributors
      • Retailers
    • PESTLE and Porter’s Analysis
    • Regulatory Landscape
      • By Key Regions
      • By Key Countries
    • Regional Parent Market Outlook
    • Production and Consumption Statistics
    • Import and Export Statistics
  4. Global Market Analysis 2020 to 2024 and Forecast, 2025 to 2035
    • Historical Market Size Value (USD Billion) & Volume (thousand units) Analysis, 2020 to 2024
    • Current and Future Market Size Value (USD Billion) & Volume (thousand units) Projections, 2025 to 2035
      • Y-o-Y Growth Trend Analysis
      • Absolute $ Opportunity Analysis
  5. Global Market Pricing Analysis 2020 to 2024 and Forecast 2025 to 2035
  6. Global Market Analysis 2020 to 2024 and Forecast 2025 to 2035, By Product Type
    • Introduction / Key Findings
    • Historical Market Size Value (USD Billion) & Volume (thousand units) Analysis By Product Type, 2020 to 2024
    • Current and Future Market Size Value (USD Billion) & Volume (thousand units) Analysis and Forecast By Product Type, 2025 to 2035
      • Chimney/Wall-Mounted Cooker Hoods
      • Integrated Cooker Hoods
      • Downdraft Cooker Hoods
    • Y-o-Y Growth Trend Analysis By Product Type, 2020 to 2024
    • Absolute $ Opportunity Analysis By Product Type, 2025 to 2035
  7. Global Market Analysis 2020 to 2024 and Forecast 2025 to 2035, By Technology
    • Introduction / Key Findings
    • Historical Market Size Value (USD Billion) & Volume (thousand units) Analysis By Technology, 2020 to 2024
    • Current and Future Market Size Value (USD Billion) & Volume (thousand units) Analysis and Forecast By Technology, 2025 to 2035
      • Extraction
      • Filterless Technology
    • Y-o-Y Growth Trend Analysis By Technology, 2020 to 2024
    • Absolute $ Opportunity Analysis By Technology, 2025 to 2035
  8. Global Market Analysis 2020 to 2024 and Forecast 2025 to 2035, By Application
    • Introduction / Key Findings
    • Historical Market Size Value (USD Billion) & Volume (thousand units) Analysis By Application, 2020 to 2024
    • Current and Future Market Size Value (USD Billion) & Volume (thousand units) Analysis and Forecast By Application, 2025 to 2035
      • Residential
      • Commercial
    • Y-o-Y Growth Trend Analysis By Application, 2020 to 2024
    • Absolute $ Opportunity Analysis By Application, 2025 to 2035
  9. Global Market Analysis 2020 to 2024 and Forecast 2025 to 2035, By Sales Channel
    • Introduction / Key Findings
    • Historical Market Size Value (USD Billion) & Volume (thousand units) Analysis By Sales Channel, 2020 to 2024
    • Current and Future Market Size Value (USD Billion) & Volume (thousand units) Analysis and Forecast By Sales Channel, 2025 to 2035
      • Modern Trade
      • Multi-brand Stores
      • Exclusive Stores
      • Online Stores
      • Independent Stores
      • Others
    • Y-o-Y Growth Trend Analysis By Sales Channel, 2020 to 2024
    • Absolute $ Opportunity Analysis By Sales Channel, 2025 to 2035
  10. Global Market Analysis 2020 to 2024 and Forecast 2025 to 2035, By Region
    • Introduction
    • Historical Market Size Value (USD Billion) & Volume (thousand units) Analysis By Region, 2020 to 2024
    • Current Market Size Value (USD Billion) & Volume (thousand units) Analysis and Forecast By Region, 2025 to 2035
      • North America
      • Latin America
      • Western Europe
      • Eastern Europe
      • East Asia
      • South Asia & Pacific
      • Middle East and Africa
    • Market Attractiveness Analysis By Region
  11. North America Market Analysis 2020 to 2024 and Forecast 2025 to 2035, By Country
    • Historical Market Size Value (USD Billion) & Volume (thousand units) Trend Analysis By Market Taxonomy, 2020 to 2024
    • Market Size Value (USD Billion) & Volume (thousand units) Forecast By Market Taxonomy, 2025 to 2035
      • By Country
        • USA
        • Canada
        • Mexico
      • By Product Type
      • By Technology
      • By Application
      • By Sales Channel
    • Market Attractiveness Analysis
      • By Country
      • By Product Type
      • By Technology
      • By Application
      • By Sales Channel
    • Key Takeaways
  12. Latin America Market Analysis 2020 to 2024 and Forecast 2025 to 2035, By Country
    • Historical Market Size Value (USD Billion) & Volume (thousand units ) Trend Analysis By Market Taxonomy, 2020 to 2024
    • Market Size Value (USD Billion) & Volume (thousand units ) Forecast By Market Taxonomy, 2025 to 2035
      • By Country
        • Brazil
        • Argentina
        • Rest of LATAM
      • By Product Type
      • By Technology
      • By Application
      • By Sales Channel
    • Market Attractiveness Analysis
      • By Country
      • By Product Type
      • By Technology
      • By Application
      • By Sales Channel
    • Key Takeaways
  13. Western Europe Market Analysis 2020 to 2024 and Forecast 2025 to 2035, By Country
    • Historical Market Size Value (USD Billion) & Volume (thousand units ) Trend Analysis By Market Taxonomy, 2020 to 2024
    • Market Size Value (USD Billion) & Volume (thousand units ) Forecast By Market Taxonomy, 2025 to 2035
      • By Country
        • Germany
        • Italy
        • France
        • UK
        • Spain
        • BENELUX
        • Nordic
        • Rest of W.Europe
      • By Product Type
      • By Technology
      • By Application
      • By Sales Channel
    • Market Attractiveness Analysis
      • By Country
      • By Product Type
      • By Technology
      • By Application
      • By Sales Channel
    • Key Takeaways
  14. Eastern Europe Market Analysis 2020 to 2024 and Forecast 2025 to 2035, By Country
    • Historical Market Size Value (USD Billion) & Volume (thousand units ) Trend Analysis By Market Taxonomy, 2020 to 2024
    • Market Size Value (USD Billion) & Volume (thousand units ) Forecast By Market Taxonomy, 2025 to 2035
      • By Country
        • Russia
        • Hungary
        • Poland
        • Balkan & Baltics
        • Rest of E. Europe
      • By Product Type
      • By Technology
      • By Application
      • By Sales Channel
    • Market Attractiveness Analysis
      • By Country
      • By Product Type
      • By Technology
      • By Application
      • By Sales Channel
    • Key Takeaways
  15. East Asia Market Analysis 2020 to 2024 and Forecast 2025 to 2035, By Country
    • Historical Market Size Value (USD Billion) & Volume (thousand units ) Trend Analysis By Market Taxonomy, 2020 to 2024
    • Market Size Value (USD Billion) & Volume (thousand units ) Forecast By Market Taxonomy, 2025 to 2035
      • By Country
        • China
        • Japan
        • South Korea
      • By Product Type
      • By Technology
      • By Application
      • By Sales Channel
    • Market Attractiveness Analysis
      • By Country
      • By Product Type
      • By Technology
      • By Application
      • By Sales Channel
    • Key Takeaways
  16. South Asia & Pacific Market Analysis 2020 to 2024 and Forecast 2025 to 2035, By Country
    • Historical Market Size Value (USD Billion) & Volume (thousand units ) Trend Analysis By Market Taxonomy, 2020 to 2024
    • Market Size Value (USD Billion) & Volume (thousand units ) Forecast By Market Taxonomy, 2025 to 2035
      • By Country
        • India
        • Australia & New Zealand
        • ASEAN
        • Rest of SAP
      • By Product Type
      • By Technology
      • By Application
      • By Sales Channel
    • Market Attractiveness Analysis
      • By Country
      • By Product Type
      • By Technology
      • By Application
      • By Sales Channel
    • Key Takeaways
  17. Middle East and Africa Market Analysis 2020 to 2024 and Forecast 2025 to 2035, By Country
    • Historical Market Size Value (USD Billion) & Volume (thousand units ) Trend Analysis By Market Taxonomy, 2020 to 2024
    • Market Size Value (USD Billion) & Volume (thousand units ) Forecast By Market Taxonomy, 2025 to 2035
      • By Country
        • GCC Countries
        • Northern Africa
        • South Africa
        • Turkiye
        • Rest of MEA
      • By Product Type
      • By Technology
      • By Application
      • By Sales Channel
    • Market Attractiveness Analysis
      • By Country
      • By Product Type
      • By Technology
      • By Application
      • By Sales Channel
    • Key Takeaways
  18. Key Countries Market Analysis
    • USA
      • Pricing Analysis
      • Market Share Analysis, 2024
        • By Product Type
        • By Technology
        • By Application
        • By Sales Channel
    • Canada
      • Pricing Analysis
      • Market Share Analysis, 2024
        • By Product Type
        • By Technology
        • By Application
        • By Sales Channel
    • Brazil
      • Pricing Analysis
      • Market Share Analysis, 2024
        • By Product Type
        • By Technology
        • By Application
        • By Sales Channel
    • Mexico
      • Pricing Analysis
      • Market Share Analysis, 2024
        • By Product Type
        • By Technology
        • By Application
        • By Sales Channel
    • Argentina
      • Pricing Analysis
      • Market Share Analysis, 2024
        • By Product Type
        • By Technology
        • By Application
        • By Sales Channel
  19. Market Structure Analysis
    • Competition Dashboard
    • Competition Benchmarking
    • Market Share Analysis of Top Players
      • By Regional
      • By Product Type
      • By Technology
      • By Application
      • By Sales Channel
  20. Competition Analysis
    • Competition Deep Dive
      • BSH Home Appliances Group
        • Overview
        • Product Portfolio
        • Profitability by Market Segments (Product/Age /Sales Channel/Region)
        • Sales Footprint
        • Strategy Overview
          • Marketing Strategy
          • Product Strategy
          • Channel Strategy
      • Bosch
        • Overview
        • Product Portfolio
        • Profitability by Market Segments (Product/Age /Sales Channel/Region)
        • Sales Footprint
        • Strategy Overview
          • Marketing Strategy
          • Product Strategy
          • Channel Strategy
      • Siemens
        • Overview
        • Product Portfolio
        • Profitability by Market Segments (Product/Age /Sales Channel/Region)
        • Sales Footprint
        • Strategy Overview
          • Marketing Strategy
          • Product Strategy
          • Channel Strategy
      • Luxair Limited
        • Overview
        • Product Portfolio
        • Profitability by Market Segments (Product/Age /Sales Channel/Region)
        • Sales Footprint
        • Strategy Overview
          • Marketing Strategy
          • Product Strategy
          • Channel Strategy
      • Inflame Appliances Ltd
        • Overview
        • Product Portfolio
        • Profitability by Market Segments (Product/Age /Sales Channel/Region)
        • Sales Footprint
        • Strategy Overview
          • Marketing Strategy
          • Product Strategy
          • Channel Strategy
      • Hafele Appliances
        • Overview
        • Product Portfolio
        • Profitability by Market Segments (Product/Age /Sales Channel/Region)
        • Sales Footprint
        • Strategy Overview
          • Marketing Strategy
          • Product Strategy
          • Channel Strategy
      • Falmec Kitchen Appliance Limited
        • Overview
        • Product Portfolio
        • Profitability by Market Segments (Product/Age /Sales Channel/Region)
        • Sales Footprint
        • Strategy Overview
          • Marketing Strategy
          • Product Strategy
          • Channel Strategy
      • Westin
        • Overview
        • Product Portfolio
        • Profitability by Market Segments (Product/Age /Sales Channel/Region)
        • Sales Footprint
        • Strategy Overview
          • Marketing Strategy
          • Product Strategy
          • Channel Strategy
      • Elica S.p.A.
        • Overview
        • Product Portfolio
        • Profitability by Market Segments (Product/Age /Sales Channel/Region)
        • Sales Footprint
        • Strategy Overview
          • Marketing Strategy
          • Product Strategy
          • Channel Strategy
      • Eico A/S
        • Overview
        • Product Portfolio
        • Profitability by Market Segments (Product/Age /Sales Channel/Region)
        • Sales Footprint
        • Strategy Overview
          • Marketing Strategy
          • Product Strategy
          • Channel Strategy
  21. Assumptions & Acronyms Used
  22. Research Methodology

List of Tables

  • Table 1: Global Market Value (USD Billion) Forecast by Region, 2020-2035
  • Table 2: Global Market Volume (thousand units ) Forecast by Region, 2020-2035
  • Table 3: Global Market Value (USD Billion) Forecast by Product Type, 2020-2035
  • Table 4: Global Market Volume (thousand units ) Forecast by Product Type, 2020-2035
  • Table 5: Global Market Value (USD Billion) Forecast by Technology, 2020-2035
  • Table 6: Global Market Volume (thousand units ) Forecast by Technology, 2020-2035
  • Table 7: Global Market Value (USD Billion) Forecast by Application, 2020-2035
  • Table 8: Global Market Volume (thousand units ) Forecast by Application, 2020-2035
  • Table 9: Global Market Value (USD Billion) Forecast by Sales Channel, 2020-2035
  • Table 10: Global Market Volume (thousand units ) Forecast by Sales Channel, 2020-2035
  • Table 11: North America Market Value (USD Billion) Forecast by Country, 2020-2035
  • Table 12: North America Market Volume (thousand units ) Forecast by Country, 2020-2035
  • Table 13: North America Market Value (USD Billion) Forecast by Product Type, 2020-2035
  • Table 14: North America Market Volume (thousand units ) Forecast by Product Type, 2020-2035
  • Table 15: North America Market Value (USD Billion) Forecast by Technology, 2020-2035
  • Table 16: North America Market Volume (thousand units ) Forecast by Technology, 2020-2035
  • Table 17: North America Market Value (USD Billion) Forecast by Application, 2020-2035
  • Table 18: North America Market Volume (thousand units ) Forecast by Application, 2020-2035
  • Table 19: North America Market Value (USD Billion) Forecast by Sales Channel, 2020-2035
  • Table 20: North America Market Volume (thousand units ) Forecast by Sales Channel, 2020-2035
  • Table 21: Latin America Market Value (USD Billion) Forecast by Country, 2020-2035
  • Table 22: Latin America Market Volume (thousand units ) Forecast by Country, 2020-2035
  • Table 23: Latin America Market Value (USD Billion) Forecast by Product Type, 2020-2035
  • Table 24: Latin America Market Volume (thousand units ) Forecast by Product Type, 2020-2035
  • Table 25: Latin America Market Value (USD Billion) Forecast by Technology, 2020-2035
  • Table 26: Latin America Market Volume (thousand units ) Forecast by Technology, 2020-2035
  • Table 27: Latin America Market Value (USD Billion) Forecast by Application, 2020-2035
  • Table 28: Latin America Market Volume (thousand units ) Forecast by Application, 2020-2035
  • Table 29: Latin America Market Value (USD Billion) Forecast by Sales Channel, 2020-2035
  • Table 30: Latin America Market Volume (thousand units ) Forecast by Sales Channel, 2020-2035
  • Table 31: Western Europe Market Value (USD Billion) Forecast by Country, 2020-2035
  • Table 32: Western Europe Market Volume (thousand units ) Forecast by Country, 2020-2035
  • Table 33: Western Europe Market Value (USD Billion) Forecast by Product Type, 2020-2035
  • Table 34: Western Europe Market Volume (thousand units ) Forecast by Product Type, 2020-2035
  • Table 35: Western Europe Market Value (USD Billion) Forecast by Technology, 2020-2035
  • Table 36: Western Europe Market Volume (thousand units ) Forecast by Technology, 2020-2035
  • Table 37: Western Europe Market Value (USD Billion) Forecast by Application, 2020-2035
  • Table 38: Western Europe Market Volume (thousand units ) Forecast by Application, 2020-2035
  • Table 39: Western Europe Market Value (USD Billion) Forecast by Sales Channel, 2020-2035
  • Table 40: Western Europe Market Volume (thousand units ) Forecast by Sales Channel, 2020-2035
  • Table 41: Eastern Europe Market Value (USD Billion) Forecast by Country, 2020-2035
  • Table 42: Eastern Europe Market Volume (thousand units ) Forecast by Country, 2020-2035
  • Table 43: Eastern Europe Market Value (USD Billion) Forecast by Product Type, 2020-2035
  • Table 44: Eastern Europe Market Volume (thousand units ) Forecast by Product Type, 2020-2035
  • Table 45: Eastern Europe Market Value (USD Billion) Forecast by Technology, 2020-2035
  • Table 46: Eastern Europe Market Volume (thousand units ) Forecast by Technology, 2020-2035
  • Table 47: Eastern Europe Market Value (USD Billion) Forecast by Application, 2020-2035
  • Table 48: Eastern Europe Market Volume (thousand units ) Forecast by Application, 2020-2035
  • Table 49: Eastern Europe Market Value (USD Billion) Forecast by Sales Channel, 2020-2035
  • Table 50: Eastern Europe Market Volume (thousand units ) Forecast by Sales Channel, 2020-2035
  • Table 51: East Asia Market Value (USD Billion) Forecast by Country, 2020-2035
  • Table 52: East Asia Market Volume (thousand units ) Forecast by Country, 2020-2035
  • Table 53: East Asia Market Value (USD Billion) Forecast by Product Type, 2020-2035
  • Table 54: East Asia Market Volume (thousand units ) Forecast by Product Type, 2020-2035
  • Table 55: East Asia Market Value (USD Billion) Forecast by Technology, 2020-2035
  • Table 56: East Asia Market Volume (thousand units ) Forecast by Technology, 2020-2035
  • Table 57: East Asia Market Value (USD Billion) Forecast by Application, 2020-2035
  • Table 58: East Asia Market Volume (thousand units ) Forecast by Application, 2020-2035
  • Table 59: East Asia Market Value (USD Billion) Forecast by Sales Channel, 2020-2035
  • Table 60: East Asia Market Volume (thousand units ) Forecast by Sales Channel, 2020-2035
  • Table 61: South Asia & Pacific Market Value (USD Billion) Forecast by Country, 2020-2035
  • Table 62: South Asia & Pacific Market Volume (thousand units ) Forecast by Country, 2020-2035
  • Table 63: South Asia & Pacific Market Value (USD Billion) Forecast by Product Type, 2020-2035
  • Table 64: South Asia & Pacific Market Volume (thousand units ) Forecast by Product Type, 2020-2035
  • Table 65: South Asia & Pacific Market Value (USD Billion) Forecast by Technology, 2020-2035
  • Table 66: South Asia & Pacific Market Volume (thousand units ) Forecast by Technology, 2020-2035
  • Table 67: South Asia & Pacific Market Value (USD Billion) Forecast by Application, 2020-2035
  • Table 68: South Asia & Pacific Market Volume (thousand units ) Forecast by Application, 2020-2035
  • Table 69: South Asia & Pacific Market Value (USD Billion) Forecast by Sales Channel, 2020-2035
  • Table 70: South Asia & Pacific Market Volume (thousand units ) Forecast by Sales Channel, 2020-2035
  • Table 71: Middle East and Africa Market Value (USD Billion) Forecast by Country, 2020-2035
  • Table 72: Middle East and Africa Market Volume (thousand units ) Forecast by Country, 2020-2035
  • Table 73: Middle East and Africa Market Value (USD Billion) Forecast by Product Type, 2020-2035
  • Table 74: Middle East and Africa Market Volume (thousand units ) Forecast by Product Type, 2020-2035
  • Table 75: Middle East and Africa Market Value (USD Billion) Forecast by Technology, 2020-2035
  • Table 76: Middle East and Africa Market Volume (thousand units ) Forecast by Technology, 2020-2035
  • Table 77: Middle East and Africa Market Value (USD Billion) Forecast by Application, 2020-2035
  • Table 78: Middle East and Africa Market Volume (thousand units ) Forecast by Application, 2020-2035
  • Table 79: Middle East and Africa Market Value (USD Billion) Forecast by Sales Channel, 2020-2035
  • Table 80: Middle East and Africa Market Volume (thousand units ) Forecast by Sales Channel, 2020-2035

List of Figures

  • Figure 1: Global Market Volume (thousand units ) Forecast 2020-2035
  • Figure 2: Global Market Pricing Analysis
  • Figure 3: Global Market Value (USD Billion) Forecast 2020-2035
  • Figure 4: Global Market Value Share and BPS Analysis by Product Type, 2025 and 2035
  • Figure 5: Global Market Y-o-Y Growth Comparison by Product Type, 2025-2035
  • Figure 6: Global Market Attractiveness Analysis by Product Type
  • Figure 7: Global Market Value Share and BPS Analysis by Technology, 2025 and 2035
  • Figure 8: Global Market Y-o-Y Growth Comparison by Technology, 2025-2035
  • Figure 9: Global Market Attractiveness Analysis by Technology
  • Figure 10: Global Market Value Share and BPS Analysis by Application, 2025 and 2035
  • Figure 11: Global Market Y-o-Y Growth Comparison by Application, 2025-2035
  • Figure 12: Global Market Attractiveness Analysis by Application
  • Figure 13: Global Market Value Share and BPS Analysis by Sales Channel, 2025 and 2035
  • Figure 14: Global Market Y-o-Y Growth Comparison by Sales Channel, 2025-2035
  • Figure 15: Global Market Attractiveness Analysis by Sales Channel
  • Figure 16: Global Market Value (USD Billion) Share and BPS Analysis by Region, 2025 and 2035
  • Figure 17: Global Market Y-o-Y Growth Comparison by Region, 2025-2035
  • Figure 18: Global Market Attractiveness Analysis by Region
  • Figure 19: North America Market Incremental $ Opportunity, 2025-2035
  • Figure 20: Latin America Market Incremental $ Opportunity, 2025-2035
  • Figure 21: Western Europe Market Incremental $ Opportunity, 2025-2035
  • Figure 22: Eastern Europe Market Incremental $ Opportunity, 2025-2035
  • Figure 23: East Asia Market Incremental $ Opportunity, 2025-2035
  • Figure 24: South Asia & Pacific Market Incremental $ Opportunity, 2025-2035
  • Figure 25: Middle East and Africa Market Incremental $ Opportunity, 2025-2035
  • Figure 26: North America Market Value Share and BPS Analysis by Country, 2025 and 2035
  • Figure 27: North America Market Value Share and BPS Analysis by Product Type, 2025 and 2035
  • Figure 28: North America Market Y-o-Y Growth Comparison by Product Type, 2025-2035
  • Figure 29: North America Market Attractiveness Analysis by Product Type
  • Figure 30: North America Market Value Share and BPS Analysis by Technology, 2025 and 2035
  • Figure 31: North America Market Y-o-Y Growth Comparison by Technology, 2025-2035
  • Figure 32: North America Market Attractiveness Analysis by Technology
  • Figure 33: North America Market Value Share and BPS Analysis by Application, 2025 and 2035
  • Figure 34: North America Market Y-o-Y Growth Comparison by Application, 2025-2035
  • Figure 35: North America Market Attractiveness Analysis by Application
  • Figure 36: North America Market Value Share and BPS Analysis by Sales Channel, 2025 and 2035
  • Figure 37: North America Market Y-o-Y Growth Comparison by Sales Channel, 2025-2035
  • Figure 38: North America Market Attractiveness Analysis by Sales Channel
  • Figure 39: Latin America Market Value Share and BPS Analysis by Country, 2025 and 2035
  • Figure 40: Latin America Market Value Share and BPS Analysis by Product Type, 2025 and 2035
  • Figure 41: Latin America Market Y-o-Y Growth Comparison by Product Type, 2025-2035
  • Figure 42: Latin America Market Attractiveness Analysis by Product Type
  • Figure 43: Latin America Market Value Share and BPS Analysis by Technology, 2025 and 2035
  • Figure 44: Latin America Market Y-o-Y Growth Comparison by Technology, 2025-2035
  • Figure 45: Latin America Market Attractiveness Analysis by Technology
  • Figure 46: Latin America Market Value Share and BPS Analysis by Application, 2025 and 2035
  • Figure 47: Latin America Market Y-o-Y Growth Comparison by Application, 2025-2035
  • Figure 48: Latin America Market Attractiveness Analysis by Application
  • Figure 49: Latin America Market Value Share and BPS Analysis by Sales Channel, 2025 and 2035
  • Figure 50: Latin America Market Y-o-Y Growth Comparison by Sales Channel, 2025-2035
  • Figure 51: Latin America Market Attractiveness Analysis by Sales Channel
  • Figure 52: Western Europe Market Value Share and BPS Analysis by Country, 2025 and 2035
  • Figure 53: Western Europe Market Value Share and BPS Analysis by Product Type, 2025 and 2035
  • Figure 54: Western Europe Market Y-o-Y Growth Comparison by Product Type, 2025-2035
  • Figure 55: Western Europe Market Attractiveness Analysis by Product Type
  • Figure 56: Western Europe Market Value Share and BPS Analysis by Technology, 2025 and 2035
  • Figure 57: Western Europe Market Y-o-Y Growth Comparison by Technology, 2025-2035
  • Figure 58: Western Europe Market Attractiveness Analysis by Technology
  • Figure 59: Western Europe Market Value Share and BPS Analysis by Application, 2025 and 2035
  • Figure 60: Western Europe Market Y-o-Y Growth Comparison by Application, 2025-2035
  • Figure 61: Western Europe Market Attractiveness Analysis by Application
  • Figure 62: Western Europe Market Value Share and BPS Analysis by Sales Channel, 2025 and 2035
  • Figure 63: Western Europe Market Y-o-Y Growth Comparison by Sales Channel, 2025-2035
  • Figure 64: Western Europe Market Attractiveness Analysis by Sales Channel
  • Figure 65: Eastern Europe Market Value Share and BPS Analysis by Country, 2025 and 2035
  • Figure 66: Eastern Europe Market Value Share and BPS Analysis by Product Type, 2025 and 2035
  • Figure 67: Eastern Europe Market Y-o-Y Growth Comparison by Product Type, 2025-2035
  • Figure 68: Eastern Europe Market Attractiveness Analysis by Product Type
  • Figure 69: Eastern Europe Market Value Share and BPS Analysis by Technology, 2025 and 2035
  • Figure 70: Eastern Europe Market Y-o-Y Growth Comparison by Technology, 2025-2035
  • Figure 71: Eastern Europe Market Attractiveness Analysis by Technology
  • Figure 72: Eastern Europe Market Value Share and BPS Analysis by Application, 2025 and 2035
  • Figure 73: Eastern Europe Market Y-o-Y Growth Comparison by Application, 2025-2035
  • Figure 74: Eastern Europe Market Attractiveness Analysis by Application
  • Figure 75: Eastern Europe Market Value Share and BPS Analysis by Sales Channel, 2025 and 2035
  • Figure 76: Eastern Europe Market Y-o-Y Growth Comparison by Sales Channel, 2025-2035
  • Figure 77: Eastern Europe Market Attractiveness Analysis by Sales Channel
  • Figure 78: East Asia Market Value Share and BPS Analysis by Country, 2025 and 2035
  • Figure 79: East Asia Market Value Share and BPS Analysis by Product Type, 2025 and 2035
  • Figure 80: East Asia Market Y-o-Y Growth Comparison by Product Type, 2025-2035
  • Figure 81: East Asia Market Attractiveness Analysis by Product Type
  • Figure 82: East Asia Market Value Share and BPS Analysis by Technology, 2025 and 2035
  • Figure 83: East Asia Market Y-o-Y Growth Comparison by Technology, 2025-2035
  • Figure 84: East Asia Market Attractiveness Analysis by Technology
  • Figure 85: East Asia Market Value Share and BPS Analysis by Application, 2025 and 2035
  • Figure 86: East Asia Market Y-o-Y Growth Comparison by Application, 2025-2035
  • Figure 87: East Asia Market Attractiveness Analysis by Application
  • Figure 88: East Asia Market Value Share and BPS Analysis by Sales Channel, 2025 and 2035
  • Figure 89: East Asia Market Y-o-Y Growth Comparison by Sales Channel, 2025-2035
  • Figure 90: East Asia Market Attractiveness Analysis by Sales Channel
  • Figure 91: South Asia & Pacific Market Value Share and BPS Analysis by Country, 2025 and 2035
  • Figure 92: South Asia & Pacific Market Value Share and BPS Analysis by Product Type, 2025 and 2035
  • Figure 93: South Asia & Pacific Market Y-o-Y Growth Comparison by Product Type, 2025-2035
  • Figure 94: South Asia & Pacific Market Attractiveness Analysis by Product Type
  • Figure 95: South Asia & Pacific Market Value Share and BPS Analysis by Technology, 2025 and 2035
  • Figure 96: South Asia & Pacific Market Y-o-Y Growth Comparison by Technology, 2025-2035
  • Figure 97: South Asia & Pacific Market Attractiveness Analysis by Technology
  • Figure 98: South Asia & Pacific Market Value Share and BPS Analysis by Application, 2025 and 2035
  • Figure 99: South Asia & Pacific Market Y-o-Y Growth Comparison by Application, 2025-2035
  • Figure 100: South Asia & Pacific Market Attractiveness Analysis by Application
  • Figure 101: South Asia & Pacific Market Value Share and BPS Analysis by Sales Channel, 2025 and 2035
  • Figure 102: South Asia & Pacific Market Y-o-Y Growth Comparison by Sales Channel, 2025-2035
  • Figure 103: South Asia & Pacific Market Attractiveness Analysis by Sales Channel
  • Figure 104: Middle East and Africa Market Value Share and BPS Analysis by Country, 2025 and 2035
  • Figure 105: Middle East and Africa Market Value Share and BPS Analysis by Product Type, 2025 and 2035
  • Figure 106: Middle East and Africa Market Y-o-Y Growth Comparison by Product Type, 2025-2035
  • Figure 107: Middle East and Africa Market Attractiveness Analysis by Product Type
  • Figure 108: Middle East and Africa Market Value Share and BPS Analysis by Technology, 2025 and 2035
  • Figure 109: Middle East and Africa Market Y-o-Y Growth Comparison by Technology, 2025-2035
  • Figure 110: Middle East and Africa Market Attractiveness Analysis by Technology
  • Figure 111: Middle East and Africa Market Value Share and BPS Analysis by Application, 2025 and 2035
  • Figure 112: Middle East and Africa Market Y-o-Y Growth Comparison by Application, 2025-2035
  • Figure 113: Middle East and Africa Market Attractiveness Analysis by Application
  • Figure 114: Middle East and Africa Market Value Share and BPS Analysis by Sales Channel, 2025 and 2035
  • Figure 115: Middle East and Africa Market Y-o-Y Growth Comparison by Sales Channel, 2025-2035
  • Figure 116: Middle East and Africa Market Attractiveness Analysis by Sales Channel
  • Figure 117: Global Market - Tier Structure Analysis
  • Figure 118: Global Market - Company Share Analysis

Frequently Asked Questions

What is the estimated market size of the Cooker Hood Market in 2025?

Market is expected to be valued at USD 16.2 billion in 2025.

What is the projected value of the Cooker Hood Market by 2035?

Market is forecast to reach USD 30.1 billion by 2035.

What is the anticipated CAGR for the Cooker Hood Market during 2025 to 2035?

Market is projected to grow at a CAGR of 6.4% over the forecast period.

Which product type segment dominates the Cooker Hood Market in 2025?

Chimney or wall-mounted cooker hoods lead the Market with a 70% share in 2025.

Who is the leading company in the Cooker Hood Market and what is its market share?

BSH Home Appliances Group is the leading company in the Cooker Hood Market, holding a 14% market share.

Explore Similar Insights

Future Market Insights

Cooker Hood Market