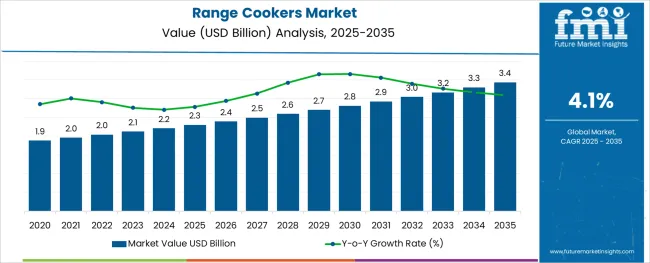
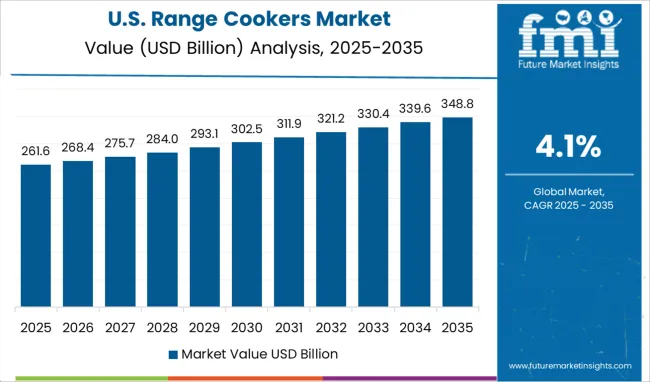
The global range cookers market is estimated at USD 1.3 billion in 2022 and is projected to reach USD 2.1 billion by 2032. Furthermore, with rising applications in residential and commercial sectors, the total sales of range cookers are poised to grow at a CAGR of 4.1% from 2022 to 2032. The share of the range cooker market in its parent market (kitchen appliance market) is approximate ~1% - 2%.
People who love cooking and their kitchen often look for the best kitchen appliances that can help them to cook food more quickly and efficiently. One such unique kitchen equipment is range cookers.
Range cookers are freestanding cookers that come with two or more good-sized ovens, a selection of hob burners, and a grill. These cookers are more suited to modern cooking and are a great choice for consumers who want the very best.
Range cookers have become ideal alternatives to standard ovens due to their various features including high efficiency and convenient nature. These cookers have different cooking settings giving users greater ease and control when cooking different varieties of food. They are designed to have a large and flexible cooking capacity and provide a steady, even cooking heat.
The rising adoption of range cookers across households and hotel chains and restaurants is expected to boost the global market during the forecast period.
Similarly, the growing popularity of modular kitchens and increasing consumer awareness about the benefits of using high-tech cooking solutions will boost sales of range cookers over the next decade.
Leading manufacturers of range cookers are constantly innovating to develop advanced cooking solutions integrated with cutting-edge technologies to improve customer satisfaction. This will help them to increase their sales and will eventually foster the development of the range cookers industry.
Attribute | Key Insights |
---|---|
Range Cookers Market Estimated Value (2022) | USD 1.3 billion |
Projected Market Value (2032) | USD 2.1 billion |
Value-based CAGR (2022 to 2032) | 4.1% |
Top Players Market Share | ~5%-10% |
According to Future Market Insights, the global demand for range cookers is forecast to surge at a steady 4.1% CAGR between 2022 and 2032, in comparison with the 3.8% CAGR registered during the historical period from 2017 to 2021.
Range cookers are unitary kitchen appliances that combine an oven and a cooktop. These cookers are available in numerous sizes and types for both commercial and residential use. They help end users to cook easily and generally take up very less space as compared to conventional cooking appliances.
Many newer models of range cookers include built-in storage for pots and pans. Modern range cookers come in an array of monochromatic and pastel colors, making them ideal for modern kitchens.
Easy availability of a wide variety of kitchen appliances like range cookers at affordable prices is playing a key role in boosting sales globally. With the economic boom and increasing disposable income, the buying power of many consumers is rising substantially.
Today, consumers are spending large amounts on purchasing advanced kitchen equipment for their modular kitchens. This will continue to boost the global range cookers industry during the forecast period.
As technology advances, individuals are more interested in cooking appliances that can be turned to multi-task, easing their busy lives. Millennials are increasingly interested in range cookers, as they can prepare their hearty dishes over a range of temperatures using just a single appliance.
Range cookers are primarily being used in commercial settings, such as food delivery stations and restaurants that serve multiple cuisines. Hence, a growing number of these commercial settings due to increasing demand for ready-to-eat food products and rising consumer spending is likely to fuel sales of range cookers over the next ten years.
Growing Consumer Demand for Technologically Advanced and Sophisticated Kitchen Appliances boosting Market
In recent years, there has been a sharp rise in the sales of electric range cookers and dual fuel range cookers due to rising consumer inclination towards technologically advanced kitchen appliances, and the trend is expected to continue during the forecast period.
With developments like rapid economic boom, changing lifestyles, and busy schedules, consumers are looking for advanced kitchen equipment to save cooking time and stay relevant to changing trends. This will continue to create growth prospects for the range cookers industry.
Similarly, in order to meet changing consumer demand, manufacturers such as Kyocera, Panasonic, and others are introducing new cooking solutions integrated with novel technologies. Their goal is to enable consumers to continue their love of cooking for the remainder of their lives.
However, exorbitant pricing for high-end freestanding range cookers and intense price competition between vendors will have a negative impact on the overall market development.
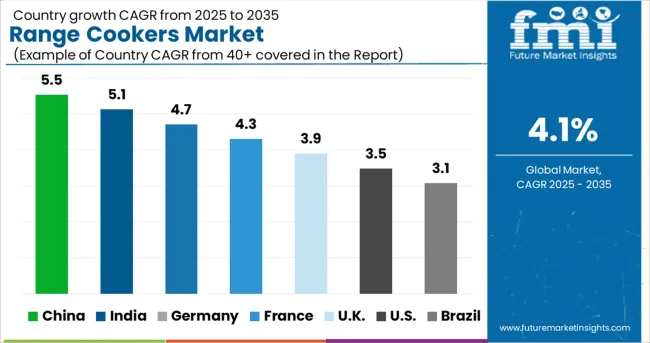
Rising Trend of Home Cooking to Boosting the USA Market
The USA has emerged as a promising market for range cookers and it is expected to reach a market valuation of USD 304.5 million by 2032. The growing trend of home cooking, the availability of advanced products, and the rising popularity of affordable mobile kitchen rentals are some of the key factors driving the USA range cookers industry.
Similarly, due to the subsequent modification trend of domestic dwellings, sales of related products are also rising in the United States. A rise in home improvement or remodeling spending is also being reflected in increased demand for home improvement or remodeling products.
The growing popularity of food-at-home cooking and the influence of social media, publications, and TV shows on cooking ideas and recipes, are increasing public knowledge of various cooking techniques. As a result, demand for range cookers is expected to surge over the projection period.
Rising Export of Kitchen Equipment Generating High Demand for Range Cookers in China
As per FMI China will continue to remain one of the lucrative markets for range cookers owing to the rising export of kitchen equipment, the strong presence of leading range cooker manufacturers, and the growing adoption of range cookers in the residential sector. FMI has predicted the China market to reach a total valuation of USD 443.0 million, by the end of 2032.
Revaluation of urbanization, vigorous promotion of merchandise by companies, and rising disposable income of customers are also major factors contributing to increased sales of range cookers in the country.
Surging Population and Rapid Urbanization Fuelling Sales in India
According to Future Market Insights, the overall market for range cookers in India is expected to reach a valuation of USD 254.9 million during the forecast period, making it one of the most lucrative markets across South Asia.
Rising sales of cooking appliances like range cookers are due to rapid urbanization, easy availability of products through online shopping platforms, and a rise in the proportion of people who cook at home due to the increasing purchasing power.
Attractive Benefits of Dual Fuel Range Cookers Making Them Extremely Popular
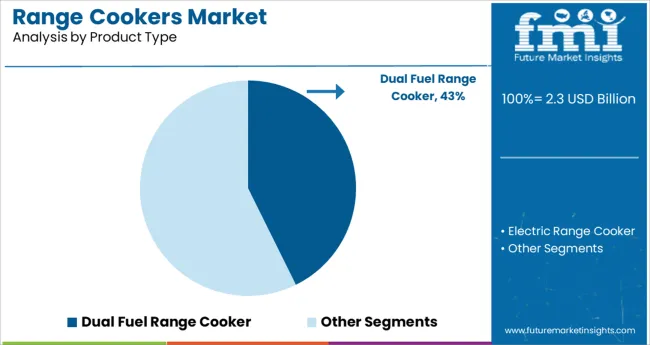
Based on product type, the dual-fuel range cooker segment is expected to reach a market valuation of USD 346.4 million during the forecast period owing to a rising end-user preference for dual-fuel range cookers due to their various advantages.
Dual fuel range cookers provide higher temperature and heat control than electric ones. They have become convenient heating and cooking solutions for consumers as they save space in the kitchen and give the kitchen a modular and new look.
Dual fuel range cookers feature both a gas cooktop (or hob) and electric ovens. By combining both fuel types into an all-in-one freestanding appliance, dual fuel range cookers allow users to take advantage of both fuel sources for optimal cooking, improving the meals that their kitchen produces.
Growing Popularity of Modular Kitchens Encouraging Adoption in the Residential Sector
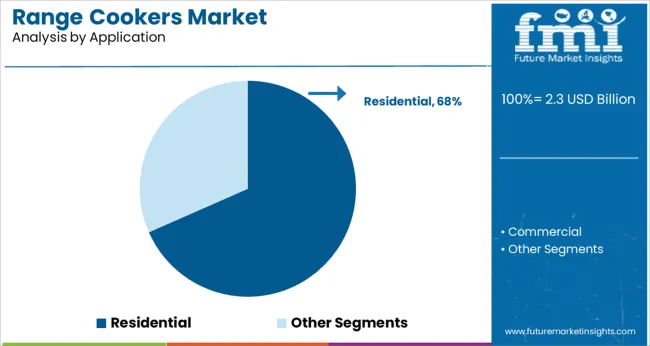
As per FMI, the overall sales of range cookers in the residential/household category are expected to reach a market valuation of USD 643.5 million during the targeted period. The reason for the adoption of range cookers in residential/households is that consumer perception is changing toward modular kitchens.
Similarly, as more and more customers are getting influenced by western culture, they are looking to make their kitchen look smart by installing novel kitchen equipment like range cookers. This will further boost sales in the residential sector.
Product innovation and Research and Development (R&D) are top priorities for major industry players as they work to provide products with a variety of oven and hob combinations. In addition, leading manufacturers are expanding their presence and strengthening their distribution network through acquisitions, mergers, alliances, and partnerships.
For instance:
Attribute | Details |
---|---|
Estimated Market Size (2022) | USD 1.3 billion |
Projected Market Size (2032) | USD 2.1 billion |
Anticipated Growth Rate (2022 to 2032) | 4.1% CAGR |
Forecast Period | 2022 to 2032 |
Historical Data Available for | 2017 to 2021 |
Market Analysis | USD Billion for Value |
Key Regions Covered | North America; Latin America; Europe; South Asia; East Asia; Oceania; and the Middle East & Africa |
Key Countries Covered | USA, Canada, Germany, United Kingdom, France, Italy, Spain, Russia, China, Japan, South Korea, India, Thailand, Malaysia, Indonesia, Australia, New Zealand, GCC Countries, Turkey, Northern Africa, and South Africa |
Key Segments Covered | Product Type, Application, Burner Type, Sales Channel, Region |
Key Companies Profiled | GE Appliances; SAMSUNG; Premier; Monogram; LG Electronics; Frigidaire; THERMADOR; Dacor, Inc.; Whirlpool Electric; LG Electronics; Panasonic; Miele & Cie KG; Hisense, INC.; Gree Electric Appliances Inc.; Sony Corporation; Skyworth; Others (on request) |
Report Coverage | Market Forecast, Company Share Analysis, Competition Intelligence, DROT Analysis, Market Dynamics and Challenges, and Strategic Growth Initiatives |
Table 1: Global Market Value (US$ million) Forecast by Product Type, 2017 to 2032
Table 2: Global Market Volume (‘000 Units) Forecast by Product Type, 2017 to 2032
Table 3: Global Market Value (US$ million) Forecast, By Application, 2017 to 2032
Table 4: Global Market Volume (‘000 Units) Forecast, By Application, 2017 to 2032
Table 5: Global Market Value (US$ million) Forecast, By Burner Type, 2017 to 2032
Table 6: Global Market Volume (‘000 Units) Forecast, By Burner Type, 2017 to 2032
Table 7: Global Market Value (US$ million) Forecast, By Sales Channel, 2017 to 2032
Table 8: Global Market Volume (‘000 Units) Forecast, By Sales Channel, 2017 to 2032
Table 9: Global Market Value (US$ million) Forecast by Region, 2017 to 2032
Table 10: Global Market Volume (‘000 Units) Forecast by Region, 2017 to 2032
Table 11: North America Market Value (US$ million) Forecast by Country, 2017 to 2032
Table 12: North America Market Volume (‘000 Units) Forecast by Country, 2017 to 2032
Table 13: North America Market Value (US$ million) Forecast by Product Type, 2017 to 2032
Table 14: North America Market Volume (‘000 Units) Forecast by Product Type, 2017 to 2032
Table 15: North America Market Value (US$ million) Forecast, By Application, 2017 to 2032
Table 16: North America Market Volume (‘000 Units) Forecast, By Application, 2017 to 2032
Table 17: North America Market Value (US$ million) Forecast, By Burner Type, 2017 to 2032
Table 18: North America Market Volume (‘000 Units) Forecast, By Burner Type, 2017 to 2032
Table 19: North America Market Value (US$ million) Forecast, By Sales Channel, 2017 to 2032
Table 20: North America Market Volume (‘000 Units) Forecast, By Sales Channel, 2017 to 2032
Table 21: Latin America Market Value (US$ million) Forecast by Country, 2017 to 2032
Table 22: Latin America Market Volume (‘000 Units) Forecast by Country, 2017 to 2032
Table 23: Latin America Market Value (US$ million) Forecast by Product Type, 2017 to 2032
Table 24: Latin America Market Volume (‘000 Units) Forecast by Product Type, 2017 to 2032
Table 25: Latin America Market Value (US$ million) Forecast, By Application, 2017 to 2032
Table 26: Latin America Market Volume (‘000 Units) Forecast, By Application, 2017 to 2032
Table 27: Latin America Market Value (US$ million) Forecast, By Burner Type, 2017 to 2032
Table 28: Latin America Market Volume (‘000 Units) Forecast, By Burner Type, 2017 to 2032
Table 29: Latin America Market Value (US$ million) Forecast, By Sales Channel, 2017 to 2032
Table 30: Latin America Market Volume (‘000 Units) Forecast, By Sales Channel, 2017 to 2032
Table 31: Europe Market Value (US$ million) Forecast by Country, 2017 to 2032
Table 32: Europe Market Volume (‘000 Units) Forecast by Country, 2017 to 2032
Table 33: Europe Market Value (US$ million) Forecast by Product Type, 2017 to 2032
Table 34: Europe Market Volume (‘000 Units) Forecast by Product Type, 2017 to 2032
Table 35: Europe Market Value (US$ million) Forecast, By Application, 2017 to 2032
Table 36: Europe Market Volume (‘000 Units) Forecast, By Application, 2017 to 2032
Table 37: Europe Market Value (US$ million) Forecast, By Burner Type, 2017 to 2032
Table 38: Europe Market Volume (‘000 Units) Forecast, By Burner Type, 2017 to 2032
Table 39: Europe Market Value (US$ million) Forecast, By Sales Channel, 2017 to 2032
Table 40: Europe Market Volume (‘000 Units) Forecast, By Sales Channel, 2017 to 2032
Table 41: East Asia Market Value (US$ million) Forecast by Country, 2017 to 2032
Table 42: East Asia Market Volume (‘000 Units) Forecast by Country, 2017 to 2032
Table 43: East Asia Market Value (US$ million) Forecast by Product Type, 2017 to 2032
Table 44: East Asia Market Volume (‘000 Units) Forecast by Product Type, 2017 to 2032
Table 45: East Asia Market Value (US$ million) Forecast, By Application, 2017 to 2032
Table 46: East Asia Market Volume (‘000 Units) Forecast, By Application, 2017 to 2032
Table 47: East Asia Market Value (US$ million) Forecast, By Burner Type, 2017 to 2032
Table 48: East Asia Market Volume (‘000 Units) Forecast, By Burner Type, 2017 to 2032
Table 49: East Asia Market Value (US$ million) Forecast, By Sales Channel, 2017 to 2032
Table 50: East Asia Market Volume (‘000 Units) Forecast, By Sales Channel, 2017 to 2032
Table 51: South Asia Market Value (US$ million) Forecast by Country, 2017 to 2032
Table 52: South Asia Market Volume (‘000 Units) Forecast by Country, 2017 to 2032
Table 53: South Asia Market Value (US$ million) Forecast by Product Type, 2017 to 2032
Table 54: South Asia Market Volume (‘000 Units) Forecast by Product Type, 2017 to 2032
Table 55: South Asia Market Value (US$ million) Forecast, By Application, 2017 to 2032
Table 56: South Asia Market Volume (‘000 Units) Forecast, By Application, 2017 to 2032
Table 57: South Asia Market Value (US$ million) Forecast, By Burner Type, 2017 to 2032
Table 58: South Asia Market Volume (‘000 Units) Forecast, By Burner Type, 2017 to 2032
Table 59: South Asia Market Value (US$ million) Forecast, By Sales Channel, 2017 to 2032
Table 60: South Asia Market Volume (‘000 Units) Forecast, By Sales Channel, 2017 to 2032
Table 61: Oceania Market Value (US$ million) Forecast by Country, 2017 to 2032
Table 62: Oceania Market Volume (‘000 Units) Forecast by Country, 2017 to 2032
Table 63: Oceania Market Value (US$ million) Forecast by Product Type, 2017 to 2032
Table 64: Oceania Market Volume (‘000 Units) Forecast by Product Type, 2017 to 2032
Table 65: Oceania Market Value (US$ million) Forecast, By Application, 2017 to 2032
Table 66: Oceania Market Volume (‘000 Units) Forecast, By Application, 2017 to 2032
Table 67: Oceania Market Value (US$ million) Forecast, By Burner Type, 2017 to 2032
Table 68: Oceania Market Volume (‘000 Units) Forecast, By Burner Type, 2017 to 2032
Table 69: Oceania Market Value (US$ million) Forecast, By Sales Channel, 2017 to 2032
Table 70: Oceania Market Volume (‘000 Units) Forecast, By Sales Channel, 2017 to 2032
Table 71: MEA Market Value (US$ million) Forecast by Country, 2017 to 2032
Table 72: MEA Market Volume (‘000 Units) Forecast by Country, 2017 to 2032
Table 73: MEA Market Value (US$ million) Forecast by Product Type, 2017 to 2032
Table 74: MEA Market Volume (‘000 Units) Forecast by Product Type, 2017 to 2032
Table 75: MEA Market Value (US$ million) Forecast, By Application, 2017 to 2032
Table 76: MEA Market Volume (‘000 Units) Forecast, By Application, 2017 to 2032
Table 77: MEA Market Value (US$ million) Forecast, By Burner Type, 2017 to 2032
Table 78: MEA Market Volume (‘000 Units) Forecast, By Burner Type, 2017 to 2032
Table 79: MEA Market Value (US$ million) Forecast, By Sales Channel, 2017 to 2032
Table 80: MEA Market Volume (‘000 Units) Forecast, By Sales Channel, 2017 to 2032
Figure 01: Global Market Value (US$ million) and Volume (‘000 Units) Analysis, 2017 to 2021
Figure 02: Global Market Value (US$ million) and Volume (‘000 Units) Forecast, 2022 to 2032
Figure 03: Global Market Value (US$ million) Analysis, 2017 to 2021
Figure 04: Global Market Value (US$ million) Forecast, 2022 to 2032
Figure 05: Global Market Absolute $ Opportunity Value (US$ million), 2022 to 2032
Figure 06: Global Market Value (US$ million) Analysis by Product Type, 2017 to 2032
Figure 07: Global Market Volume (‘000 Units) Analysis by Product Type, 2017 to 2032
Figure 08: Global Market Y-o-Y Growth (%) Projections, By Product Type, 2022 to 2032
Figure 09: Global Market Attractiveness by Product Type, 2022 to 2032
Figure 10: Global Market Value (US$ million) Analysis by Application, 2017 to 2032
Figure 11: Global Market Volume (‘000 Units) Analysis by Application, 2017 to 2032
Figure 12: Global Market Y-o-Y Growth (%) Projections, By Application, 2022 to 2032
Figure 13: Global Market Attractiveness by Application, 2022 to 2032
Figure 14: Global Market Value (US$ million) Analysis by Burner Type, 2017 to 2032
Figure 15: Global Market Volume (‘000 Units) Analysis by Burner Type, 2017 to 2032
Figure 16: Global Market Y-o-Y Growth (%) Projections, By Burner Type, 2022 to 2032
Figure 17: Global Market Attractiveness by Burner Type, 2022 to 2032
Figure 18: Global Market Value (US$ million) Analysis by Sales Channel, 2017 to 2032
Figure 19: Global Market Volume (‘000 Units) Analysis by Sales Channel, 2017 to 2032
Figure 20: Global Market Y-o-Y Growth (%) Projections, By Sales Channel, 2022 to 2032
Figure 21: Global Market Attractiveness by Sales Channel, 2022 to 2032
Figure 22: Global Market Value (US$ million) Analysis by Region, 2017 to 2032
Figure 23: Global Market Volume (‘000 Units) Analysis by Region, 2017 to 2032
Figure 24: Global Market Y-o-Y Growth (%) Projections, By Region, 2022 to 2032
Figure 25: Global Market Attractiveness by Region, 2022 to 2032
Figure 26: North America Market Value (US$ million) Analysis by Country, 2017 to 2032
Figure 27: North America Market Volume (‘000 Units) Analysis by Country, 2017 to 2032
Figure 28: North America Market Y-o-Y Growth (%) Projections, By Country, 2022 to 2032
Figure 29: North America Market Attractiveness by Country, 2022 to 2032
Figure 30: North America Market Value (US$ million) Analysis by Product Type, 2017 to 2032
Figure 31: North America Market Volume (‘000 Units) Analysis by Product Type, 2017 to 2032
Figure 32: North America Market Y-o-Y Growth (%) Projections, By Product Type, 2022 to 2032
Figure 33: North America Market Attractiveness by Product Type, 2022 to 2032
Figure 34: North America Market Value (US$ million) Analysis by Application, 2017 to 2032
Figure 35: North America Market Volume (‘000 Units) Analysis by Application, 2017 to 2032
Figure 36: North America Market Y-o-Y Growth (%) Projections, By Application, 2022 to 2032
Figure 37: North America Market Attractiveness by Application, 2022 to 2032
Figure 38: North America Market Value (US$ million) Analysis by Burner Type, 2017 to 2032
Figure 39: North America Market Volume (‘000 Units) Analysis by Burner Type, 2017 to 2032
Figure 40: North America Market Y-o-Y Growth (%) Projections, By Burner Type, 2022 to 2032
Figure 41: North America Market Attractiveness by Burner Type, 2022 to 2032
Figure 42: North America Market Value (US$ million) Analysis by Sales Channel, 2017 to 2032
Figure 43: North America Market Volume (‘000 Units) Analysis by Sales Channel, 2017 to 2032
Figure 44: North America Market Y-o-Y Growth (%) Projections, By Sales Channel, 2022 to 2032
Figure 45: North America Market Attractiveness by Sales Channel, 2022 to 2032
Figure 46: Latin America Market Value (US$ million) Analysis by Country, 2017 to 2032
Figure 47: Latin America Market Volume (‘000 Units) Analysis by Country, 2017 to 2032
Figure 48: Latin America Market Y-o-Y Growth (%) Projections, By Country, 2022 to 2032
Figure 49: Latin America Market Attractiveness by Country, 2022 to 2032
Figure 50: Latin America Market Value (US$ million) Analysis by Product Type, 2017 to 2032
Figure 51: Latin America Market Volume (‘000 Units) Analysis by Product Type, 2017 to 2032
Figure 52: Latin America Market Y-o-Y Growth (%) Projections, By Product Type, 2022 to 2032
Figure 53: Latin America Market Attractiveness by Product Type, 2022 to 2032
Figure 54: Latin America Market Value (US$ million) Analysis by Application, 2017 to 2032
Figure 55: Latin America Market Volume (‘000 Units) Analysis by Application, 2017 to 2032
Figure 56: Latin America Market Y-o-Y Growth (%) Projections, By Application, 2022 to 2032
Figure 57: Latin America Market Attractiveness by Application, 2022 to 2032
Figure 58: Latin America Market Value (US$ million) Analysis by Burner Type, 2017 to 2032
Figure 59: Latin America Market Volume (‘000 Units) Analysis by Burner Type, 2017 to 2032
Figure 60: Latin America Market Y-o-Y Growth (%) Projections, By Burner Type, 2022 to 2032
Figure 61: Latin America Market Attractiveness by Burner Type, 2022 to 2032
Figure 62: Latin America Market Value (US$ million) Analysis by Sales Channel, 2017 to 2032
Figure 63: Latin America Market Volume (‘000 Units) Analysis by Sales Channel, 2017 to 2032
Figure 64: Latin America Market Y-o-Y Growth (%) Projections, By Sales Channel, 2022 to 2032
Figure 65: Latin America Market Attractiveness by Sales Channel, 2022 to 2032
Figure 66: Europe Market Value (US$ million) Analysis by Country, 2017 to 2032
Figure 67: Europe Market Volume (‘000 Units) Analysis by Country, 2017 to 2032
Figure 68: Europe Market Y-o-Y Growth (%) Projections, By Country, 2022 to 2032
Figure 69: Europe Market Attractiveness by Country, 2022 to 2032
Figure 70: Europe Market Value (US$ million) Analysis by Product Type, 2017 to 2032
Figure 71: Europe Market Volume (‘000 Units) Analysis by Product Type, 2017 to 2032
Figure 72: Europe Market Y-o-Y Growth (%) Projections, By Product Type, 2022 to 2032
Figure 73: Europe Market Attractiveness by Product Type, 2022 to 2032
Figure 74: Europe Market Value (US$ million) Analysis by Application, 2017 to 2032
Figure 75: Europe Market Volume (‘000 Units) Analysis by Application, 2017 to 2032
Figure 76: Europe Market Y-o-Y Growth (%) Projections, By Application, 2022 to 2032
Figure 77: Europe Market Attractiveness by Application, 2022 to 2032
Figure 78: Europe Market Value (US$ million) Analysis by Burner Type, 2017 to 2032
Figure 79: Europe Market Volume (‘000 Units) Analysis by Burner Type, 2017 to 2032
Figure 80: Europe Market Y-o-Y Growth (%) Projections, By Burner Type, 2022 to 2032
Figure 81: Europe Market Attractiveness by Burner Type, 2022 to 2032
Figure 82: Europe Market Value (US$ million) Analysis by Sales Channel, 2017 to 2032
Figure 83: Europe Market Volume (‘000 Units) Analysis by Sales Channel, 2017 to 2032
Figure 84: Europe Market Y-o-Y Growth (%) Projections, By Sales Channel, 2022 to 2032
Figure 85: Europe Market Attractiveness by Sales Channel, 2022 to 2032
Figure 86: East Asia Market Value (US$ million) Analysis by Country, 2017 to 2032
Figure 87: East Asia Market Volume (‘000 Units) Analysis by Country, 2017 to 2032
Figure 88: East Asia Market Y-o-Y Growth (%) Projections, By Country, 2022 to 2032
Figure 89: East Asia Market Attractiveness by Country, 2022 to 2032
Figure 90: East Asia Market Value (US$ million) Analysis by Product Type, 2017 to 2032
Figure 91: East Asia Market Volume (‘000 Units) Analysis by Product Type, 2017 to 2032
Figure 92: East Asia Market Y-o-Y Growth (%) Projections, By Product Type, 2022 to 2032
Figure 93: East Asia Market Attractiveness by Product Type, 2022 to 2032
Figure 94: East Asia Market Value (US$ million) Analysis by Application, 2017 to 2032
Figure 95: East Asia Market Volume (‘000 Units) Analysis by Application, 2017 to 2032
Figure 96: East Asia Market Y-o-Y Growth (%) Projections, By Application, 2022 to 2032
Figure 97: East Asia Market Attractiveness by Application, 2022 to 2032
Figure 98: East Asia Market Value (US$ million) Analysis by Burner Type, 2017 to 2032
Figure 99: East Asia Market Volume (‘000 Units) Analysis by Burner Type, 2017 to 2032
Figure 100: East Asia Market Y-o-Y Growth (%) Projections, By Burner Type, 2022 to 2032
Figure 101: East Asia Market Attractiveness by Burner Type, 2022 to 2032
Figure 102: East Asia Market Value (US$ million) Analysis by Sales Channel, 2017 to 2032
Figure 103: East Asia Market Volume (‘000 Units) Analysis by Sales Channel, 2017 to 2032
Figure 104: East Asia Market Y-o-Y Growth (%) Projections, By Sales Channel, 2022 to 2032
Figure 105: East Asia Market Attractiveness by Sales Channel, 2022 to 2032
Figure 106: South Asia Market Value (US$ million) Analysis by Country, 2017 to 2032
Figure 107: South Asia Market Volume (‘000 Units) Analysis by Country, 2017 to 2032
Figure 108: South Asia Market Y-o-Y Growth (%) Projections, By Country, 2022 to 2032
Figure 109: South Asia Market Attractiveness by Country, 2022 to 2032
Figure 110: South Asia Market Value (US$ million) Analysis by Product Type, 2017 to 2032
Figure 111: South Asia Market Volume (‘000 Units) Analysis by Product Type, 2017 to 2032
Figure 112: South Asia Market Y-o-Y Growth (%) Projections, By Product Type, 2022 to 2032
Figure 113: South Asia Market Attractiveness by Product Type, 2022 to 2032
Figure 114: South Asia Market Value (US$ million) Analysis by Application, 2017 to 2032
Figure 115: South Asia Market Volume (‘000 Units) Analysis by Application, 2017 to 2032
Figure 116: South Asia Market Y-o-Y Growth (%) Projections, By Application, 2022 to 2032
Figure 117: South Asia Market Attractiveness by Application, 2022 to 2032
Figure 118: South Asia Market Value (US$ million) Analysis by Burner Type, 2017 to 2032
Figure 119: South Asia Market Volume (‘000 Units) Analysis by Burner Type, 2017 to 2032
Figure 120: South Asia Market Y-o-Y Growth (%) Projections, By Burner Type, 2022 to 2032
Figure 121: South Asia Market Attractiveness by Burner Type, 2022 to 2032
Figure 122: South Asia Market Value (US$ million) Analysis by Sales Channel, 2017 to 2032
Figure 123: South Asia Market Volume (‘000 Units) Analysis by Sales Channel, 2017 to 2032
Figure 124: South Asia Market Y-o-Y Growth (%) Projections, By Sales Channel, 2022 to 2032
Figure 125: South Asia Market Attractiveness by Sales Channel, 2022 to 2032
Figure 126: Oceania Market Value (US$ million) Analysis by Country, 2017 to 2032
Figure 127: Oceania Market Volume (‘000 Units) Analysis by Country, 2017 to 2032
Figure 128: Oceania Market Y-o-Y Growth (%) Projections, By Country, 2022 to 2032
Figure 129: Oceania Market Attractiveness by Country, 2022 to 2032
Figure 130: Oceania Market Value (US$ million) Analysis by Product Type, 2017 to 2032
Figure 131: Oceania Market Volume (‘000 Units) Analysis by Product Type, 2017 to 2032
Figure 132: Oceania Market Y-o-Y Growth (%) Projections, By Product Type, 2022 to 2032
Figure 133: Oceania Market Attractiveness by Product Type, 2022 to 2032
Figure 134: Oceania Market Value (US$ million) Analysis by Application, 2017 to 2032
Figure 135: Oceania Market Volume (‘000 Units) Analysis by Application, 2017 to 2032
Figure 136: Oceania Market Y-o-Y Growth (%) Projections, By Application, 2022 to 2032
Figure 137: Oceania Market Attractiveness by Application, 2022 to 2032
Figure 138: Oceania Market Value (US$ million) Analysis by Burner Type, 2017 to 2032
Figure 139: Oceania Market Volume (‘000 Units) Analysis by Burner Type, 2017 to 2032
Figure 140: Oceania Market Y-o-Y Growth (%) Projections, By Burner Type, 2022 to 2032
Figure 141: Oceania Market Attractiveness by Burner Type, 2022 to 2032
Figure 142: Oceania Market Value (US$ million) Analysis by Sales Channel, 2017 to 2032
Figure 143: Oceania Market Volume (‘000 Units) Analysis by Sales Channel, 2017 to 2032
Figure 144: Oceania Market Y-o-Y Growth (%) Projections, By Sales Channel, 2022 to 2032
Figure 145: Oceania Market Attractiveness by Sales Channel, 2022 to 2032
Figure 146: MEA Market Value (US$ million) Analysis by Country, 2017 to 2032
Figure 147: MEA Market Volume (‘000 Units) Analysis by Country, 2017 to 2032
Figure 148: MEA Market Y-o-Y Growth (%) Projections, By Country, 2022 to 2032
Figure 149: MEA Market Attractiveness by Country, 2022 to 2032
Figure 150: MEA Market Value (US$ million) Analysis by Product Type, 2017 to 2032
Figure 151: MEA Market Volume (‘000 Units) Analysis by Product Type, 2017 to 2032
Figure 152: MEA Market Y-o-Y Growth (%) Projections, By Product Type, 2022 to 2032
Figure 153: MEA Market Attractiveness by Product Type, 2022 to 2032
Figure 154: MEA Market Value (US$ million) Analysis by Application, 2017 to 2032
Figure 155: MEA Market Volume (‘000 Units) Analysis by Application, 2017 to 2032
Figure 156: MEA Market Y-o-Y Growth (%) Projections, By Application, 2022 to 2032
Figure 157: MEA Market Attractiveness by Application, 2022 to 2032
Figure 158: MEA Market Value (US$ million) Analysis by Burner Type, 2017 to 2032
Figure 159: MEA Market Volume (‘000 Units) Analysis by Burner Type, 2017 to 2032
Figure 160: MEA Market Y-o-Y Growth (%) Projections, By Burner Type, 2022 to 2032
Figure 161: MEA Market Attractiveness by Burner Type, 2022 to 2032
Figure 162: MEA Market Value (US$ million) Analysis by Sales Channel, 2017 to 2032
Figure 163: MEA Market Volume (‘000 Units) Analysis by Sales Channel, 2017 to 2032
Figure 164: MEA Market Y-o-Y Growth (%) Projections, By Sales Channel, 2022 to 2032
Figure 165: MEA Market Attractiveness by Sales Channel, 2022 to 2032
The global range cookers market size is estimated to reach USD 1.3 billion in 2022.
The global market for range cookers grew at a CAGR of 3.8% between 2017 and 2021.
Demand for range cookers is expected to rise at 4.1% CAGR between 2022 and 2032.
As per FMI, the global range cookers industry is projected to top a valuation of USD 2.1 billion by 2032.
The United Kingdom range cookers market is projected to grow at a CAGR of 4.3% over the forecast period.
The overall market for range cookers in China is anticipated to expand at 5.6% CAGR during the assessment period.
Explore Similar Insights
Thank you!
You will receive an email from our Business Development Manager. Please be sure to check your SPAM/JUNK folder too.