Reports

- Global Locations -

Headquarters

Future Market Insights, Inc.

Christiana Corporate, 200
Continental Drive, Suite 401,
Newark, Delaware - 19713,
United States

T: +1-845-579-5705

Americas

Future Market Insights, Inc.

616 Corporate Way, Suite 2-9018,
Valley Cottage, NY 10989, United States

T: +1-347-918-3531

MEA

Future Market Insights

1602-6 Jumeirah Bay X2 Tower, Plot No: JLT-PH2-X2A,
Jumeirah Lakes Towers, Dubai,
United Arab Emirates

Europe

Future Market Insights

3rd Floor, 207 Regent Street,
W1B 3HH London
United Kingdom

T: + 44 (0) 20 8123 9659
D: +44 (0) 20 3287 4268

Asia Pacific

Future Market Insights

IndiaLand Global Tech Park, Unit UG-1, Behind Grand HighStreet, Phase 1, Hinjawadi, MH, Pune – 411057, India

Long-range Camera Market Outlook from 2024 to 2034

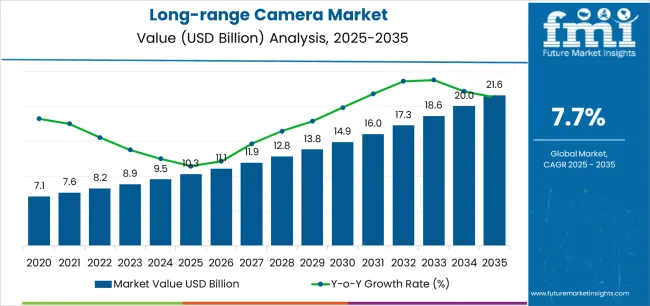
The long-range camera market is set to capture US$ 9.5 billion in 2024. In the limelight of scientific breakthroughs, surveillance and security have taken a new form. This has pushed the demand for long-range cameras in the general populace. Destined for growth, the market is en route to garner a valuation of US$ 20.7 billion by 2034, covering a CAGR of 8.1% through 2034.

Attributes Key Statistics
Expected Long-range Camera Market Value (2024) US$ 9.5 billion
Forecast Value (2034) US$ 20.7 billion
Estimated Growth (2024 to 2034) 8.1% CAGR

Don't pay for what you don't need

Customize your report by selecting specific countries or regions and save 30%!

Factors Enlightening the Market Value of Long-range Cameras

Digitalization and the adoption of artificial intelligence have revolutionized traditional business models. This has fostered innovation and the need to have a vigilant eye on things to monitor tasks, making it more effective across sectors. Some factors propelling the growth of the market are

  • Continuous technological advancements have enhanced the efficiency and effectiveness of long-range cameras
  • Digitalization and the development of smart cities have spurred the demand for long-range cameras for traffic management and crime prevention
  • Urbanization, population growth, and consumer concern for home security and safety are serving as catalysts for market growth
  • The healthcare sector adopting long-range cameras for monitoring patients and ensuring their safety through cameras installed in patients' wards
  • Increasing incidents of terrorism and crimes are necessitating border security and general crime surveillance through CCTVs
  • Growing adoption of IoT and connected devices for real-time monitoring and alerts
  • Affordability and accessibility of long-range cameras propelled by economies of scale and technological advancements

Causes Depreciating the Market Growth

Even though long-range cameras have a multitude of applications, various factors are slowing down the market. Some of them are

  • Despite being 'long-range' cameras, they still have limitations in terms of how far they can see
  • Weather conditions and other environmental challenges can affect picture quality and, thus its performance
  • Technical expertise is required for proper installation and maintenance of long-range cameras
  • Integration of these cameras with IoT and connected devices can cause a risk of cybersecurity attacks.
  • The market is relatively small compared to other types of cameras, which can limit the number of potential buyers
  • The market faces high competition, causing challenges to new entrants
Sudip Saha
Sudip Saha

Principal Consultant

Talk to Analyst

Find your sweet spots for generating winning opportunities in this market.

Strategies Companies must go through for Unprecedented Growth

  • Manufacturers should invest in research and development to improve camera quality, increase range, and add new features.
  • Companies should focus on improving their supply chain management to ensure timely delivery of products.
  • Manufacturers should develop strong marketing strategies to promote their products and build their brand. They should leverage digital marketing tools and social media platforms to reach their target audience and build a strong online presence.
  • Manufacturers should focus on offering competitive pricing to make their products more accessible to customers and increase market penetration.
  • Leading companies should offer excellent customer service to retain customers and build brand loyalty. They should provide technical support, warranty, and repair services to ensure customer satisfaction.

Comparative View of Adjacent Industries

Across the breadth of all surveys, consonant with research conducted by Future Market Insights, have analyzed data to harness the competition with the long-range camera market, the multispectral camera market and 3D camera market.

Long-range Camera Market:

Attributes Long-range Camera Market
CAGR (2024 to 2034) 8.1%
Market Value (2034) US$ 20.7 billion
Growth Factor Adoption of long-range cameras in smart city projects and infrastructure development
Key Challenges Privacy concerns and regulatory issues related to surveillance and data privacy

3D Camera Market:

Attributes 3D Camera Market
CAGR (2024 to 2034) 31.9%
Market Value (2034) US$ 375.5 billion
Growth Factor Adoption of 3D cameras for facial recognition, gesture recognition, and immersive gaming experiences
Key Challenges High costs associated with 3D camera systems, including hardware, software, and development tools

Multispectral Camera Market:

Attributes Multispectral Camera Market
CAGR (2024 to 2034) 9.5%
Market Value (2034) US$ 3.9 billion
Growth Factor Integration of multispectral cameras in drones, satellites, and autonomous vehicles for remote sensing
Key Challenges Limited availability of specialized expertise and skills for operating multispectral camera systems

Get the data you need at a Fraction of the cost

Personalize your report by choosing insights you need
and save 40%!

Category-wise Insights

Land Platform Acquiring the Long Range Camera Market

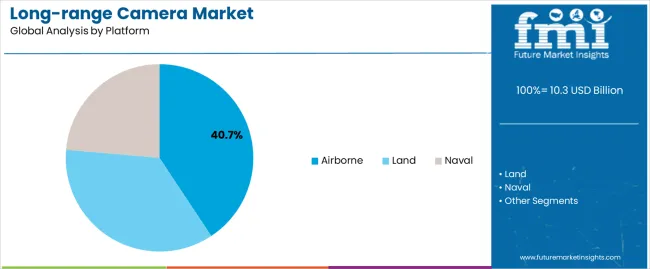
Advanced technology and superior performance requirements for operational purposes in the land segment have held the highest share in the ongoing surge for long-range cameras. The land segment to secure its market with a CAGR of 7.9% through 2034.

Attributes Details
Platform Land
CAGR (2024 to 2034) 7.9%

In land applications, long-range cameras play a critical role in serving and paying attention to warfare personnel. They are strategically deployed in training centers, vehicles, surveillance posts, and other sensitive areas. Thus, the market is acquiring traction globally for strategies, security, and surveillance for optimized tracking through terrain bases.

Long Wave Infrared Sensors and Imaging Systems Seizing Applications in Various Sectors

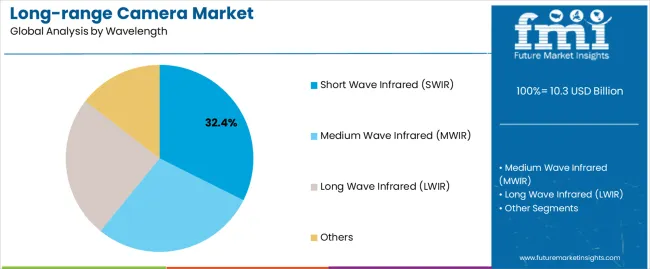
By wavelength, the long wave infrared (LWIR) segment showcases reasonable upscale in the market with a CAGR of 7.7% from 2024 to 2034.

Attributes Details
Wavelength Long Wave Infrared (LWIR)
CAGR (2024 to 2034) 7.7%

The growth of the long-wave infrared wavelength is attributed to its increasing utility in homeland security, surveillance, object detection, and other scientific and industrial applications. As this wavelength can be used in complete darkness, it can be used for animal mappings and surveys. This increases its demand in the forest and wildlife welfare sectors.

LWIR sensors and imaging systems are generally more affordable compared to MWIR systems. This makes them more accessible for various applications, including consumer products like thermal cameras.

Country-wise Insights

Countries like Australia and New Zealand, China, the United States, Germany, and Japan are expanding broadly in the long-range camera industry.

Countries CAGR from 2024 to 2034
South Korea 10.0%
Japan 9.7%
United Kingdom 9.2%
China 8.8%
United States 8.4%

Advancement for Military Surveillance Sparks Demand in South Korea

Long-range cameras in South Korea are used for various applications, from military surveillance to traffic management. With a CAGR of 10.0%, the South Korea long-range camera market is projected through 2034.

Law enforcement agencies use these cameras to monitor high-crime areas and deter criminal activities. This leads to significant market growth as identifying suspects and investigating crimes becomes easier. Disruption from neighboring countries necessitates the adoption of high-tech equipment like long-range cameras for border security purposes.

Manufacturers View Bright Future through the Industrial Lens in Japan

Japan, with a CAGR of 9.7%, pushes growth in the long-range camera market. These cameras monitor traffic flow and detect accidents or incidents on highways and major roads.

Rapid infrastructure development and industrialization in Japan have been significantly influenced by the increased demand for infrared cameras in the manufacturing and construction sectors. Demand in Japan is also boosted by increasing expenditure on defense and security.

Technological Integration Benefits the United Kingdom’s Long-range Camera market

The market in the United States is expected to reach a CAGR of 9.2% from 2024 to 2034. With ongoing developments in infrastructure, the market is going to reach the skies.

Rising urbanization in the United Kingdom has led to the development of modern commercial spaces, both in the public and private domains. This has automatically generated substantial demand for these cameras in the United Kingdom for surveillance and safety.

Government in China is Investing in Lump sum for Advanced Security, Fueling Market Growth

Traffic management has become a major concern in China. With a CAGR of 8.8%, the China long-range camera market is in a steady growth phase.

Growing integration of IoT and AI in long-range cameras has made them more efficient and effective. This has attracted many renowned companies in China to invest in this market and introduce new advances. Due to high-security concerns in China, the government has been investing heavily in security and surveillance infrastructure in the country. This has created a huge demand for these cameras in China.

Rapid Industrialization in the United States Helps Market Expansion

The United States monitors high-risk areas such as airports, government buildings, and critical infrastructure and detects potential threats from a distance through the use of these cameras. Thus, the United States market is experiencing continuous growth with a CAGR of 8.4% through 2034.

Industries such as oil and gas use long-range cameras to monitor operations, ensure worker safety, and detect potential hazards from a distance. These cameras are also used to monitor traffic flow on highways and major roads in the United States.
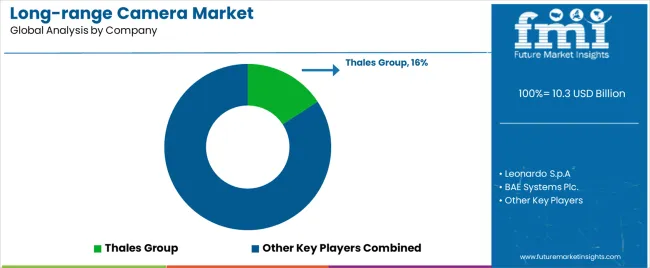
Competitive Landscape

Top companies are investing heavily in research and development to improve camera quality, increase range, and add new features to meet the growing demand for long-range cameras. Sony has been actively developing its Alpha series of mirrorless cameras with high-quality zoom lenses and advanced autofocus systems.

Canon has recently launched its EOS R5 and R6 mirrorless cameras with impressive image quality and long-range capabilities. Nikon is also focusing on expanding its Z series mirrorless camera lineup with high-performance lenses and innovative features. Panasonic is developing its Lumix S series of full-frame mirrorless cameras with advanced autofocus and image stabilization systems.

Recent Advancements

  • In January 2024, Orbbec unveiled Gemini 2 XL, a long-range 3D camera designed for AI-based vision systems in robotics.
  • In February 2024, Motorola Solutions acquired United Kingdom-based Silent Sentinel, specializing in long-range cameras, expanding its video security portfolio for a global clientele.
  • In October 2023, FUJIFILM unveiled the FUJINON SX1600 long-range camera system for surveillance at Milipol Paris. Equipped with a 40x zoom lens and advanced image stabilization, it clearly captured distant subjects, including registration plates at 1.6 km and individuals at 3.5 km.
  • In January 2024, Abode Systems unveiled the Abode Edge Camera at CES. The innovative security camera boasted AI capabilities, a wireless range exceeding 1.5 miles, and top-tier battery life, revolutionizing home security.

Key Companies in the Market

  • i3 System, Inc.
  • BAE Systems Plc.
  • Leonardo S.p.A
  • Thales Group
  • L3 Harris Technologies, Inc.
  • Fluke Corporation (USA)
  • Axis Communications AB (Sweden)
  • Senspex Inc. (New Mexico)
  • Excelitas Technologies Corporation (USA)
  • Teledyne FLIR LLC. (USA)

Key Coverage in the Long-range Camera Market Report

  • Best CCTV Camera for Long Distance Vision
  • An In-depth Analysis of PTZ Camera
  • Detailed Study on Military Grade Long Range PTZ Camera
  • Market Analysis of Wireless Long Range Camera
  • Long Range Security Wall Camera Market Coverage
  • Impact of Super Long Range Security Camera with Night Vision

Market Segmentation

By Wavelength:

  • Short Wave Infrared (SWIR)
  • Medium Wave Infrared (MWIR)
  • Long Wave Infrared (LWIR)
  • Others

By Platform:

  • Airborne
  • Land
  • Naval

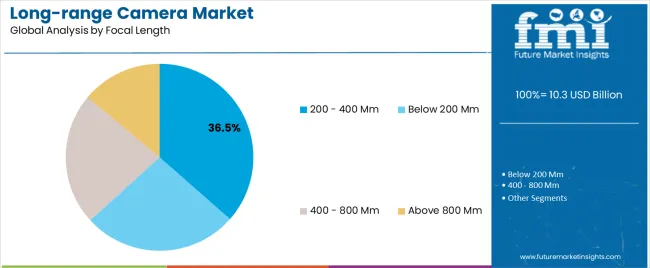
By Focal Length:

  • Below 200 mm
  • 200 - 400 mm
  • 400 - 800 mm
  • Above 800 mm

By Camera Installations:

  • Fixed Installation
  • Portable
  • Platform-Mounted

By Application:

  • Designated Marksman Target Spotting & Range Detection
  • Intelligence, Surveillance, Target Acquisition, and Reconnaissance (ISTAR)
  • Command and Control
  • Long Range Shooting Sports Spotting & Range Detection
  • Counter-Unmanned Aerial Systems Operations
  • Forest & Wildlife Protection
  • Inspection, Surveying & Mapping
  • Disaster Monitoring
  • Aerial Photography & Cinematography
  • Others

By End User:

  • Defense
  • Homeland Security
  • Shooting Sports
  • Forestry & Wildlife Conservation
  • Disaster Management Services
  • Media & Entertainment
  • Geospatial Research Institutes
  • Others

By Region:

  • North America
  • Latin America
  • Asia Pacific
  • Middle East and Africa (MEA)
  • Europe

Frequently Asked Questions

What is the Long-range Camera Market Currently Worth?

The market is set to reach US$ 9.5 billion in 2024.

What is the Sales Forecast for Long-range Cameras through 2034?

The long-range camera market is expected to reach US$ 20.7 billion by 2034.

At What Rate is the Long-range Camera Market Growing Globally?

The market is developing at a CAGR of 8.1% from 2024 to 2034.

What is the Top Wavelength of the Long-range Camera Market?

Long wave infrared (LWIR) is the top segment, set to record a CAGR OF 7.7% through 2034.

How will the Long-range Camera Market Progress in the South Korea?

The market in South Korea is expected to progress at a CAGR of 10.0% through 2034.

Table of Content

1. Executive Summary

    1.1. Global Market Outlook

    1.2. Demand-side Trends

    1.3. Supply-side Trends

    1.4. Technology Roadmap Analysis

    1.5. Analysis and Recommendations

2. Market Overview

    2.1. Market Coverage / Taxonomy

    2.2. Market Definition / Scope / Limitations

3. Market Background

    3.1. Market Dynamics

        3.1.1. Drivers

        3.1.2. Restraints

        3.1.3. Opportunity 

        3.1.4. Trends

    3.2. Scenario Forecast

        3.2.1. Demand in Optimistic Scenario

        3.2.2. Demand in Likely Scenario

        3.2.3. Demand in Conservative Scenario

    3.3. Opportunity Map Analysis

    3.4. Product Life Cycle Analysis

    3.5. Supply Chain Analysis

        3.5.1. Supply Side Participants and their Roles

            3.5.1.1. Manufacturer

            3.5.1.2. Mid-Level Participants (Traders)

            3.5.1.3. Wholesalers and Distributors

        3.5.2. Value Added and Value Created at Node in the Supply Chain

        3.5.3. List of Raw Material Suppliers

        3.5.4. List of Existing and Potential Buyer’s

    3.6. Investment Feasibility Matrix

    3.7. Value Chain Analysis

        3.7.1. Profit Margin Analysis

        3.7.2. Wholesalers and Distributors

        3.7.3. Retailers

    3.8. PESTLE and Porter’s Analysis

    3.9. Regulatory Landscape

        3.9.1. By Key Regions

        3.9.2. By Key Countries

    3.10. Regional Parent Market Outlook

    3.11. Production and Consumption Statistics

    3.12. Import and Export Statistics

4. Global Market Analysis 2019 to 2023 and Forecast, 2024 to 2034

    4.1. Historical Market Size Value (US$ Million) & Volume (Units) Analysis, 2019 to 2023

    4.2. Current and Future Market Size Value (US$ Million) & Volume (Units) Projections, 2024 to 2034

        4.2.1. Y-o-Y Growth Trend Analysis

        4.2.2. Absolute $ Opportunity Analysis

5. Global Market Analysis 2019 to 2023 and Forecast 2024 to 2034, By Focal Length

    5.1. Introduction / Key Findings

    5.2. Historical Market Size Value (US$ Million) & Volume (Units) Analysis By Focal Length, 2019 to 2023

    5.3. Current and Future Market Size Value (US$ Million) & Volume (Units) Analysis and Forecast By Focal Length, 2024 to 2034

        5.3.1. Below 200 mm

        5.3.2. 200 - 400 mm

        5.3.3. 400 -800 mm

        5.3.4. Above 800 mm

    5.4. Y-o-Y Growth Trend Analysis By Focal Length, 2019 to 2023

    5.5. Absolute $ Opportunity Analysis By Focal Length, 2024 to 2034

6. Global Market Analysis 2019 to 2023 and Forecast 2024 to 2034, By Wavelength

    6.1. Introduction / Key Findings

    6.2. Historical Market Size Value (US$ Million) & Volume (Units) Analysis By Wavelength, 2019 to 2023

    6.3. Current and Future Market Size Value (US$ Million) & Volume (Units) Analysis and Forecast By Wavelength, 2024 to 2034

        6.3.1. Short Wave Infrared (SWIR)

        6.3.2. Medium Wave Infrared (MWIR)

        6.3.3. Long Wave Infrared (LWIR)

        6.3.4. Others

    6.4. Y-o-Y Growth Trend Analysis By Wavelength, 2019 to 2023

    6.5. Absolute $ Opportunity Analysis By Wavelength, 2024 to 2034

7. Global Market Analysis 2019 to 2023 and Forecast 2024 to 2034, By Platform

    7.1. Introduction / Key Findings

    7.2. Historical Market Size Value (US$ Million) & Volume (Units) Analysis By Platform, 2019 to 2023

    7.3. Current and Future Market Size Value (US$ Million) & Volume (Units) Analysis and Forecast By Platform, 2024 to 2034

        7.3.1. Airborne

        7.3.2. Land

        7.3.3. Naval

    7.4. Y-o-Y Growth Trend Analysis By Platform, 2019 to 2023

    7.5. Absolute $ Opportunity Analysis By Platform, 2024 to 2034

8. Global Market Analysis 2019 to 2023 and Forecast 2024 to 2034, By End User

    8.1. Introduction / Key Findings

    8.2. Historical Market Size Value (US$ Million) & Volume (Units) Analysis By End User, 2019 to 2023

    8.3. Current and Future Market Size Value (US$ Million) & Volume (Units) Analysis and Forecast By End User, 2024 to 2034

        8.3.1. Defense

        8.3.2. Homeland Security

        8.3.3. Shooting Sports

        8.3.4. Forestry & Wildlife Conservation

        8.3.5. Disaster Management Services

        8.3.6. Media & Entertainment

        8.3.7. Geospatial Research Institutes

        8.3.8. Others

    8.4. Y-o-Y Growth Trend Analysis By End User, 2019 to 2023

    8.5. Absolute $ Opportunity Analysis By End User, 2024 to 2034

9. Global Market Analysis 2019 to 2023 and Forecast 2024 to 2034, By Camera Installations

    9.1. Introduction / Key Findings

    9.2. Historical Market Size Value (US$ Million) & Volume (Units) Analysis By Camera Installations, 2019 to 2023

    9.3. Current and Future Market Size Value (US$ Million) & Volume (Units) Analysis and Forecast By Camera Installations, 2024 to 2034

        9.3.1. Fixed Installation

        9.3.2. Portable

        9.3.3. Platform-Mounted

    9.4. Y-o-Y Growth Trend Analysis By Camera Installations, 2019 to 2023

    9.5. Absolute $ Opportunity Analysis By Camera Installations, 2024 to 2034

10. Global Market Analysis 2019 to 2023 and Forecast 2024 to 2034, By Application

    10.1. Introduction / Key Findings

    10.2. Historical Market Size Value (US$ Million) & Volume (Units) Analysis By Application, 2019 to 2023

    10.3. Current and Future Market Size Value (US$ Million) & Volume (Units) Analysis and Forecast By Application, 2024 to 2034

        10.3.1. Designated Marksman Target Spotting & Range Detection

        10.3.2. Intelligence, Surveillance, Target Acquisition, and Reconnaissance (ISTAR)

        10.3.3. Command and Control

        10.3.4. Long Range Shooting Sports Spotting & Range Detection

        10.3.5. Counter-Unmanned Aerial Systems Operations

        10.3.6. Forest & Wildlife Protection

        10.3.7. Inspection, Surveying & Mapping

        10.3.8. Disaster Monitoring

        10.3.9. Aerial Photography & Cinematography

        10.3.10. Others

    10.4. Y-o-Y Growth Trend Analysis By Application, 2019 to 2023

    10.5. Absolute $ Opportunity Analysis By Application, 2024 to 2034

11. Global Market Analysis 2019 to 2023 and Forecast 2024 to 2034, By Region

    11.1. Introduction

    11.2. Historical Market Size Value (US$ Million) & Volume (Units) Analysis By Region, 2019 to 2023

    11.3. Current Market Size Value (US$ Million) & Volume (Units) Analysis and Forecast By Region, 2024 to 2034

        11.3.1. North America

        11.3.2. Latin America

        11.3.3. Western Europe

        11.3.4. Eastern Europe

        11.3.5. South Asia and Pacific

        11.3.6. East Asia

        11.3.7. Middle East and Africa

    11.4. Market Attractiveness Analysis By Region

12. North America Market Analysis 2019 to 2023 and Forecast 2024 to 2034, By Country

    12.1. Historical Market Size Value (US$ Million) & Volume (Units) Trend Analysis By Market Taxonomy, 2019 to 2023

    12.2. Market Size Value (US$ Million) & Volume (Units) Forecast By Market Taxonomy, 2024 to 2034

        12.2.1. By Country

            12.2.1.1. USA

            12.2.1.2. Canada

        12.2.2. By Focal Length

        12.2.3. By Wavelength

        12.2.4. By Platform

        12.2.5. By End User

        12.2.6. By Camera Installations

        12.2.7. By Application

    12.3. Market Attractiveness Analysis

        12.3.1. By Country

        12.3.2. By Focal Length

        12.3.3. By Wavelength

        12.3.4. By Platform

        12.3.5. By End User

        12.3.6. By Camera Installations

        12.3.7. By Application

    12.4. Key Takeaways

13. Latin America Market Analysis 2019 to 2023 and Forecast 2024 to 2034, By Country

    13.1. Historical Market Size Value (US$ Million) & Volume (Units) Trend Analysis By Market Taxonomy, 2019 to 2023

    13.2. Market Size Value (US$ Million) & Volume (Units) Forecast By Market Taxonomy, 2024 to 2034

        13.2.1. By Country

            13.2.1.1. Brazil

            13.2.1.2. Mexico

            13.2.1.3. Rest of Latin America

        13.2.2. By Focal Length

        13.2.3. By Wavelength

        13.2.4. By Platform

        13.2.5. By End User

        13.2.6. By Camera Installations

        13.2.7. By Application

    13.3. Market Attractiveness Analysis

        13.3.1. By Country

        13.3.2. By Focal Length

        13.3.3. By Wavelength

        13.3.4. By Platform

        13.3.5. By End User

        13.3.6. By Camera Installations

        13.3.7. By Application

    13.4. Key Takeaways

14. Western Europe Market Analysis 2019 to 2023 and Forecast 2024 to 2034, By Country

    14.1. Historical Market Size Value (US$ Million) & Volume (Units) Trend Analysis By Market Taxonomy, 2019 to 2023

    14.2. Market Size Value (US$ Million) & Volume (Units) Forecast By Market Taxonomy, 2024 to 2034

        14.2.1. By Country

            14.2.1.1. Germany

            14.2.1.2. UK

            14.2.1.3. France

            14.2.1.4. Spain

            14.2.1.5. Italy

            14.2.1.6. Rest of Western Europe

        14.2.2. By Focal Length

        14.2.3. By Wavelength

        14.2.4. By Platform

        14.2.5. By End User

        14.2.6. By Camera Installations

        14.2.7. By Application

    14.3. Market Attractiveness Analysis

        14.3.1. By Country

        14.3.2. By Focal Length

        14.3.3. By Wavelength

        14.3.4. By Platform

        14.3.5. By End User

        14.3.6. By Camera Installations

        14.3.7. By Application

    14.4. Key Takeaways

15. Eastern Europe Market Analysis 2019 to 2023 and Forecast 2024 to 2034, By Country

    15.1. Historical Market Size Value (US$ Million) & Volume (Units) Trend Analysis By Market Taxonomy, 2019 to 2023

    15.2. Market Size Value (US$ Million) & Volume (Units) Forecast By Market Taxonomy, 2024 to 2034

        15.2.1. By Country

            15.2.1.1. Poland

            15.2.1.2. Russia

            15.2.1.3. Czech Republic

            15.2.1.4. Romania

            15.2.1.5. Rest of Eastern Europe

        15.2.2. By Focal Length

        15.2.3. By Wavelength

        15.2.4. By Platform

        15.2.5. By End User

        15.2.6. By Camera Installations

        15.2.7. By Application

    15.3. Market Attractiveness Analysis

        15.3.1. By Country

        15.3.2. By Focal Length

        15.3.3. By Wavelength

        15.3.4. By Platform

        15.3.5. By End User

        15.3.6. By Camera Installations

        15.3.7. By Application

    15.4. Key Takeaways

16. South Asia and Pacific Market Analysis 2019 to 2023 and Forecast 2024 to 2034, By Country

    16.1. Historical Market Size Value (US$ Million) & Volume (Units) Trend Analysis By Market Taxonomy, 2019 to 2023

    16.2. Market Size Value (US$ Million) & Volume (Units) Forecast By Market Taxonomy, 2024 to 2034

        16.2.1. By Country

            16.2.1.1. India

            16.2.1.2. Bangladesh

            16.2.1.3. Australia

            16.2.1.4. New Zealand

            16.2.1.5. Rest of South Asia and Pacific

        16.2.2. By Focal Length

        16.2.3. By Wavelength

        16.2.4. By Platform

        16.2.5. By End User

        16.2.6. By Camera Installations

        16.2.7. By Application

    16.3. Market Attractiveness Analysis

        16.3.1. By Country

        16.3.2. By Focal Length

        16.3.3. By Wavelength

        16.3.4. By Platform

        16.3.5. By End User

        16.3.6. By Camera Installations

        16.3.7. By Application

    16.4. Key Takeaways

17. East Asia Market Analysis 2019 to 2023 and Forecast 2024 to 2034, By Country

    17.1. Historical Market Size Value (US$ Million) & Volume (Units) Trend Analysis By Market Taxonomy, 2019 to 2023

    17.2. Market Size Value (US$ Million) & Volume (Units) Forecast By Market Taxonomy, 2024 to 2034

        17.2.1. By Country

            17.2.1.1. China

            17.2.1.2. Japan

            17.2.1.3. South Korea

        17.2.2. By Focal Length

        17.2.3. By Wavelength

        17.2.4. By Platform

        17.2.5. By End User

        17.2.6. By Camera Installations

        17.2.7. By Application

    17.3. Market Attractiveness Analysis

        17.3.1. By Country

        17.3.2. By Focal Length

        17.3.3. By Wavelength

        17.3.4. By Platform

        17.3.5. By End User

        17.3.6. By Camera Installations

        17.3.7. By Application

    17.4. Key Takeaways

18. Middle East and Africa Market Analysis 2019 to 2023 and Forecast 2024 to 2034, By Country

    18.1. Historical Market Size Value (US$ Million) & Volume (Units) Trend Analysis By Market Taxonomy, 2019 to 2023

    18.2. Market Size Value (US$ Million) & Volume (Units) Forecast By Market Taxonomy, 2024 to 2034

        18.2.1. By Country

            18.2.1.1. GCC Countries

            18.2.1.2. South Africa

            18.2.1.3. Israel

            18.2.1.4. Rest of MEA

        18.2.2. By Focal Length

        18.2.3. By Wavelength

        18.2.4. By Platform

        18.2.5. By End User

        18.2.6. By Camera Installations

        18.2.7. By Application

    18.3. Market Attractiveness Analysis

        18.3.1. By Country

        18.3.2. By Focal Length

        18.3.3. By Wavelength

        18.3.4. By Platform

        18.3.5. By End User

        18.3.6. By Camera Installations

        18.3.7. By Application

    18.4. Key Takeaways

19. Key Countries Market Analysis

    19.1. USA

        19.1.1. Pricing Analysis

        19.1.2. Market Share Analysis, 2023

            19.1.2.1. By Focal Length

            19.1.2.2. By Wavelength

            19.1.2.3. By Platform

            19.1.2.4. By End User

            19.1.2.5. By Camera Installations

            19.1.2.6. By Application

    19.2. Canada

        19.2.1. Pricing Analysis

        19.2.2. Market Share Analysis, 2023

            19.2.2.1. By Focal Length

            19.2.2.2. By Wavelength

            19.2.2.3. By Platform

            19.2.2.4. By End User

            19.2.2.5. By Camera Installations

            19.2.2.6. By Application

    19.3. Brazil

        19.3.1. Pricing Analysis

        19.3.2. Market Share Analysis, 2023

            19.3.2.1. By Focal Length

            19.3.2.2. By Wavelength

            19.3.2.3. By Platform

            19.3.2.4. By End User

            19.3.2.5. By Camera Installations

            19.3.2.6. By Application

    19.4. Mexico

        19.4.1. Pricing Analysis

        19.4.2. Market Share Analysis, 2023

            19.4.2.1. By Focal Length

            19.4.2.2. By Wavelength

            19.4.2.3. By Platform

            19.4.2.4. By End User

            19.4.2.5. By Camera Installations

            19.4.2.6. By Application

    19.5. Germany

        19.5.1. Pricing Analysis

        19.5.2. Market Share Analysis, 2023

            19.5.2.1. By Focal Length

            19.5.2.2. By Wavelength

            19.5.2.3. By Platform

            19.5.2.4. By End User

            19.5.2.5. By Camera Installations

            19.5.2.6. By Application

    19.6. UK

        19.6.1. Pricing Analysis

        19.6.2. Market Share Analysis, 2023

            19.6.2.1. By Focal Length

            19.6.2.2. By Wavelength

            19.6.2.3. By Platform

            19.6.2.4. By End User

            19.6.2.5. By Camera Installations

            19.6.2.6. By Application

    19.7. France

        19.7.1. Pricing Analysis

        19.7.2. Market Share Analysis, 2023

            19.7.2.1. By Focal Length

            19.7.2.2. By Wavelength

            19.7.2.3. By Platform

            19.7.2.4. By End User

            19.7.2.5. By Camera Installations

            19.7.2.6. By Application

    19.8. Spain

        19.8.1. Pricing Analysis

        19.8.2. Market Share Analysis, 2023

            19.8.2.1. By Focal Length

            19.8.2.2. By Wavelength

            19.8.2.3. By Platform

            19.8.2.4. By End User

            19.8.2.5. By Camera Installations

            19.8.2.6. By Application

    19.9. Italy

        19.9.1. Pricing Analysis

        19.9.2. Market Share Analysis, 2023

            19.9.2.1. By Focal Length

            19.9.2.2. By Wavelength

            19.9.2.3. By Platform

            19.9.2.4. By End User

            19.9.2.5. By Camera Installations

            19.9.2.6. By Application

    19.10. Poland

        19.10.1. Pricing Analysis

        19.10.2. Market Share Analysis, 2023

            19.10.2.1. By Focal Length

            19.10.2.2. By Wavelength

            19.10.2.3. By Platform

            19.10.2.4. By End User

            19.10.2.5. By Camera Installations

            19.10.2.6. By Application

    19.11. Russia

        19.11.1. Pricing Analysis

        19.11.2. Market Share Analysis, 2023

            19.11.2.1. By Focal Length

            19.11.2.2. By Wavelength

            19.11.2.3. By Platform

            19.11.2.4. By End User

            19.11.2.5. By Camera Installations

            19.11.2.6. By Application

    19.12. Czech Republic

        19.12.1. Pricing Analysis

        19.12.2. Market Share Analysis, 2023

            19.12.2.1. By Focal Length

            19.12.2.2. By Wavelength

            19.12.2.3. By Platform

            19.12.2.4. By End User

            19.12.2.5. By Camera Installations

            19.12.2.6. By Application

    19.13. Romania

        19.13.1. Pricing Analysis

        19.13.2. Market Share Analysis, 2023

            19.13.2.1. By Focal Length

            19.13.2.2. By Wavelength

            19.13.2.3. By Platform

            19.13.2.4. By End User

            19.13.2.5. By Camera Installations

            19.13.2.6. By Application

    19.14. India

        19.14.1. Pricing Analysis

        19.14.2. Market Share Analysis, 2023

            19.14.2.1. By Focal Length

            19.14.2.2. By Wavelength

            19.14.2.3. By Platform

            19.14.2.4. By End User

            19.14.2.5. By Camera Installations

            19.14.2.6. By Application

    19.15. Bangladesh

        19.15.1. Pricing Analysis

        19.15.2. Market Share Analysis, 2023

            19.15.2.1. By Focal Length

            19.15.2.2. By Wavelength

            19.15.2.3. By Platform

            19.15.2.4. By End User

            19.15.2.5. By Camera Installations

            19.15.2.6. By Application

    19.16. Australia

        19.16.1. Pricing Analysis

        19.16.2. Market Share Analysis, 2023

            19.16.2.1. By Focal Length

            19.16.2.2. By Wavelength

            19.16.2.3. By Platform

            19.16.2.4. By End User

            19.16.2.5. By Camera Installations

            19.16.2.6. By Application

    19.17. New Zealand

        19.17.1. Pricing Analysis

        19.17.2. Market Share Analysis, 2023

            19.17.2.1. By Focal Length

            19.17.2.2. By Wavelength

            19.17.2.3. By Platform

            19.17.2.4. By End User

            19.17.2.5. By Camera Installations

            19.17.2.6. By Application

    19.18. China

        19.18.1. Pricing Analysis

        19.18.2. Market Share Analysis, 2023

            19.18.2.1. By Focal Length

            19.18.2.2. By Wavelength

            19.18.2.3. By Platform

            19.18.2.4. By End User

            19.18.2.5. By Camera Installations

            19.18.2.6. By Application

    19.19. Japan

        19.19.1. Pricing Analysis

        19.19.2. Market Share Analysis, 2023

            19.19.2.1. By Focal Length

            19.19.2.2. By Wavelength

            19.19.2.3. By Platform

            19.19.2.4. By End User

            19.19.2.5. By Camera Installations

            19.19.2.6. By Application

    19.20. South Korea

        19.20.1. Pricing Analysis

        19.20.2. Market Share Analysis, 2023

            19.20.2.1. By Focal Length

            19.20.2.2. By Wavelength

            19.20.2.3. By Platform

            19.20.2.4. By End User

            19.20.2.5. By Camera Installations

            19.20.2.6. By Application

    19.21. GCC Countries

        19.21.1. Pricing Analysis

        19.21.2. Market Share Analysis, 2023

            19.21.2.1. By Focal Length

            19.21.2.2. By Wavelength

            19.21.2.3. By Platform

            19.21.2.4. By End User

            19.21.2.5. By Camera Installations

            19.21.2.6. By Application

    19.22. South Africa

        19.22.1. Pricing Analysis

        19.22.2. Market Share Analysis, 2023

            19.22.2.1. By Focal Length

            19.22.2.2. By Wavelength

            19.22.2.3. By Platform

            19.22.2.4. By End User

            19.22.2.5. By Camera Installations

            19.22.2.6. By Application

    19.23. Israel

        19.23.1. Pricing Analysis

        19.23.2. Market Share Analysis, 2023

            19.23.2.1. By Focal Length

            19.23.2.2. By Wavelength

            19.23.2.3. By Platform

            19.23.2.4. By End User

            19.23.2.5. By Camera Installations

            19.23.2.6. By Application

20. Market Structure Analysis

    20.1. Competition Dashboard

    20.2. Competition Benchmarking

    20.3. Market Share Analysis of Top Players

        20.3.1. By Regional

        20.3.2. By Focal Length

        20.3.3. By Wavelength

        20.3.4. By Platform

        20.3.5. By End User

        20.3.6. By Camera Installations

        20.3.7. By Application

21. Competition Analysis

    21.1. Competition Deep Dive

        21.1.1. i3 System, Inc

            21.1.1.1. Overview

            21.1.1.2. Product Portfolio

            21.1.1.3. Profitability by Market Segments

            21.1.1.4. Sales Footprint

            21.1.1.5. Strategy Overview

                21.1.1.5.1. Marketing Strategy

                21.1.1.5.2. Product Strategy

                21.1.1.5.3. Channel Strategy

        21.1.2. BAE Systems Plc

            21.1.2.1. Overview

            21.1.2.2. Product Portfolio

            21.1.2.3. Profitability by Market Segments

            21.1.2.4. Sales Footprint

            21.1.2.5. Strategy Overview

                21.1.2.5.1. Marketing Strategy

                21.1.2.5.2. Product Strategy

                21.1.2.5.3. Channel Strategy

        21.1.3. Leonardo S.p.A.

            21.1.3.1. Overview

            21.1.3.2. Product Portfolio

            21.1.3.3. Profitability by Market Segments

            21.1.3.4. Sales Footprint

            21.1.3.5. Strategy Overview

                21.1.3.5.1. Marketing Strategy

                21.1.3.5.2. Product Strategy

                21.1.3.5.3. Channel Strategy

        21.1.4. Thales Group

            21.1.4.1. Overview

            21.1.4.2. Product Portfolio

            21.1.4.3. Profitability by Market Segments

            21.1.4.4. Sales Footprint

            21.1.4.5. Strategy Overview

                21.1.4.5.1. Marketing Strategy

                21.1.4.5.2. Product Strategy

                21.1.4.5.3. Channel Strategy

        21.1.5. L3 Harris Technologies, Inc

            21.1.5.1. Overview

            21.1.5.2. Product Portfolio

            21.1.5.3. Profitability by Market Segments

            21.1.5.4. Sales Footprint

            21.1.5.5. Strategy Overview

                21.1.5.5.1. Marketing Strategy

                21.1.5.5.2. Product Strategy

                21.1.5.5.3. Channel Strategy

        21.1.6. Fluke Corporation

            21.1.6.1. Overview

            21.1.6.2. Product Portfolio

            21.1.6.3. Profitability by Market Segments

            21.1.6.4. Sales Footprint

            21.1.6.5. Strategy Overview

                21.1.6.5.1. Marketing Strategy

                21.1.6.5.2. Product Strategy

                21.1.6.5.3. Channel Strategy

        21.1.7. Axis Communications AB

            21.1.7.1. Overview

            21.1.7.2. Product Portfolio

            21.1.7.3. Profitability by Market Segments

            21.1.7.4. Sales Footprint

            21.1.7.5. Strategy Overview

                21.1.7.5.1. Marketing Strategy

                21.1.7.5.2. Product Strategy

                21.1.7.5.3. Channel Strategy

        21.1.8. Senspex Inc.

            21.1.8.1. Overview

            21.1.8.2. Product Portfolio

            21.1.8.3. Profitability by Market Segments

            21.1.8.4. Sales Footprint

            21.1.8.5. Strategy Overview

                21.1.8.5.1. Marketing Strategy

                21.1.8.5.2. Product Strategy

                21.1.8.5.3. Channel Strategy

        21.1.9. Excelitas Technologies Corporation

            21.1.9.1. Overview

            21.1.9.2. Product Portfolio

            21.1.9.3. Profitability by Market Segments

            21.1.9.4. Sales Footprint

            21.1.9.5. Strategy Overview

                21.1.9.5.1. Marketing Strategy

                21.1.9.5.2. Product Strategy

                21.1.9.5.3. Channel Strategy

        21.1.10. Teledyne FLIR LLC

            21.1.10.1. Overview

            21.1.10.2. Product Portfolio

            21.1.10.3. Profitability by Market Segments

            21.1.10.4. Sales Footprint

            21.1.10.5. Strategy Overview

                21.1.10.5.1. Marketing Strategy

                21.1.10.5.2. Product Strategy

                21.1.10.5.3. Channel Strategy

22. Assumptions & Acronyms Used

23. Research Methodology

List of Tables

Table 1: Global Market Value (US$ Million) Forecast by Region, 2019 to 2034

Table 2: Global Market Volume (Units) Forecast by Region, 2019 to 2034

Table 3: Global Market Value (US$ Million) Forecast by Focal Length, 2019 to 2034

Table 4: Global Market Volume (Units) Forecast by Focal Length, 2019 to 2034

Table 5: Global Market Value (US$ Million) Forecast by Wavelength, 2019 to 2034

Table 6: Global Market Volume (Units) Forecast by Wavelength, 2019 to 2034

Table 7: Global Market Value (US$ Million) Forecast by Platform, 2019 to 2034

Table 8: Global Market Volume (Units) Forecast by Platform, 2019 to 2034

Table 9: Global Market Value (US$ Million) Forecast by End User, 2019 to 2034

Table 10: Global Market Volume (Units) Forecast by End User, 2019 to 2034

Table 11: Global Market Value (US$ Million) Forecast by Camera Installations, 2019 to 2034

Table 12: Global Market Volume (Units) Forecast by Camera Installations, 2019 to 2034

Table 13: Global Market Value (US$ Million) Forecast by Application, 2019 to 2034

Table 14: Global Market Volume (Units) Forecast by Application, 2019 to 2034

Table 15: North America Market Value (US$ Million) Forecast by Country, 2019 to 2034

Table 16: North America Market Volume (Units) Forecast by Country, 2019 to 2034

Table 17: North America Market Value (US$ Million) Forecast by Focal Length, 2019 to 2034

Table 18: North America Market Volume (Units) Forecast by Focal Length, 2019 to 2034

Table 19: North America Market Value (US$ Million) Forecast by Wavelength, 2019 to 2034

Table 20: North America Market Volume (Units) Forecast by Wavelength, 2019 to 2034

Table 21: North America Market Value (US$ Million) Forecast by Platform, 2019 to 2034

Table 22: North America Market Volume (Units) Forecast by Platform, 2019 to 2034

Table 23: North America Market Value (US$ Million) Forecast by End User, 2019 to 2034

Table 24: North America Market Volume (Units) Forecast by End User, 2019 to 2034

Table 25: North America Market Value (US$ Million) Forecast by Camera Installations, 2019 to 2034

Table 26: North America Market Volume (Units) Forecast by Camera Installations, 2019 to 2034

Table 27: North America Market Value (US$ Million) Forecast by Application, 2019 to 2034

Table 28: North America Market Volume (Units) Forecast by Application, 2019 to 2034

Table 29: Latin America Market Value (US$ Million) Forecast by Country, 2019 to 2034

Table 30: Latin America Market Volume (Units) Forecast by Country, 2019 to 2034

Table 31: Latin America Market Value (US$ Million) Forecast by Focal Length, 2019 to 2034

Table 32: Latin America Market Volume (Units) Forecast by Focal Length, 2019 to 2034

Table 33: Latin America Market Value (US$ Million) Forecast by Wavelength, 2019 to 2034

Table 34: Latin America Market Volume (Units) Forecast by Wavelength, 2019 to 2034

Table 35: Latin America Market Value (US$ Million) Forecast by Platform, 2019 to 2034

Table 36: Latin America Market Volume (Units) Forecast by Platform, 2019 to 2034

Table 37: Latin America Market Value (US$ Million) Forecast by End User, 2019 to 2034

Table 38: Latin America Market Volume (Units) Forecast by End User, 2019 to 2034

Table 39: Latin America Market Value (US$ Million) Forecast by Camera Installations, 2019 to 2034

Table 40: Latin America Market Volume (Units) Forecast by Camera Installations, 2019 to 2034

Table 41: Latin America Market Value (US$ Million) Forecast by Application, 2019 to 2034

Table 42: Latin America Market Volume (Units) Forecast by Application, 2019 to 2034

Table 43: Western Europe Market Value (US$ Million) Forecast by Country, 2019 to 2034

Table 44: Western Europe Market Volume (Units) Forecast by Country, 2019 to 2034

Table 45: Western Europe Market Value (US$ Million) Forecast by Focal Length, 2019 to 2034

Table 46: Western Europe Market Volume (Units) Forecast by Focal Length, 2019 to 2034

Table 47: Western Europe Market Value (US$ Million) Forecast by Wavelength, 2019 to 2034

Table 48: Western Europe Market Volume (Units) Forecast by Wavelength, 2019 to 2034

Table 49: Western Europe Market Value (US$ Million) Forecast by Platform, 2019 to 2034

Table 50: Western Europe Market Volume (Units) Forecast by Platform, 2019 to 2034

Table 51: Western Europe Market Value (US$ Million) Forecast by End User, 2019 to 2034

Table 52: Western Europe Market Volume (Units) Forecast by End User, 2019 to 2034

Table 53: Western Europe Market Value (US$ Million) Forecast by Camera Installations, 2019 to 2034

Table 54: Western Europe Market Volume (Units) Forecast by Camera Installations, 2019 to 2034

Table 55: Western Europe Market Value (US$ Million) Forecast by Application, 2019 to 2034

Table 56: Western Europe Market Volume (Units) Forecast by Application, 2019 to 2034

Table 57: Eastern Europe Market Value (US$ Million) Forecast by Country, 2019 to 2034

Table 58: Eastern Europe Market Volume (Units) Forecast by Country, 2019 to 2034

Table 59: Eastern Europe Market Value (US$ Million) Forecast by Focal Length, 2019 to 2034

Table 60: Eastern Europe Market Volume (Units) Forecast by Focal Length, 2019 to 2034

Table 61: Eastern Europe Market Value (US$ Million) Forecast by Wavelength, 2019 to 2034

Table 62: Eastern Europe Market Volume (Units) Forecast by Wavelength, 2019 to 2034

Table 63: Eastern Europe Market Value (US$ Million) Forecast by Platform, 2019 to 2034

Table 64: Eastern Europe Market Volume (Units) Forecast by Platform, 2019 to 2034

Table 65: Eastern Europe Market Value (US$ Million) Forecast by End User, 2019 to 2034

Table 66: Eastern Europe Market Volume (Units) Forecast by End User, 2019 to 2034

Table 67: Eastern Europe Market Value (US$ Million) Forecast by Camera Installations, 2019 to 2034

Table 68: Eastern Europe Market Volume (Units) Forecast by Camera Installations, 2019 to 2034

Table 69: Eastern Europe Market Value (US$ Million) Forecast by Application, 2019 to 2034

Table 70: Eastern Europe Market Volume (Units) Forecast by Application, 2019 to 2034

Table 71: South Asia and Pacific Market Value (US$ Million) Forecast by Country, 2019 to 2034

Table 72: South Asia and Pacific Market Volume (Units) Forecast by Country, 2019 to 2034

Table 73: South Asia and Pacific Market Value (US$ Million) Forecast by Focal Length, 2019 to 2034

Table 74: South Asia and Pacific Market Volume (Units) Forecast by Focal Length, 2019 to 2034

Table 75: South Asia and Pacific Market Value (US$ Million) Forecast by Wavelength, 2019 to 2034

Table 76: South Asia and Pacific Market Volume (Units) Forecast by Wavelength, 2019 to 2034

Table 77: South Asia and Pacific Market Value (US$ Million) Forecast by Platform, 2019 to 2034

Table 78: South Asia and Pacific Market Volume (Units) Forecast by Platform, 2019 to 2034

Table 79: South Asia and Pacific Market Value (US$ Million) Forecast by End User, 2019 to 2034

Table 80: South Asia and Pacific Market Volume (Units) Forecast by End User, 2019 to 2034

Table 81: South Asia and Pacific Market Value (US$ Million) Forecast by Camera Installations, 2019 to 2034

Table 82: South Asia and Pacific Market Volume (Units) Forecast by Camera Installations, 2019 to 2034

Table 83: South Asia and Pacific Market Value (US$ Million) Forecast by Application, 2019 to 2034

Table 84: South Asia and Pacific Market Volume (Units) Forecast by Application, 2019 to 2034

Table 85: East Asia Market Value (US$ Million) Forecast by Country, 2019 to 2034

Table 86: East Asia Market Volume (Units) Forecast by Country, 2019 to 2034

Table 87: East Asia Market Value (US$ Million) Forecast by Focal Length, 2019 to 2034

Table 88: East Asia Market Volume (Units) Forecast by Focal Length, 2019 to 2034

Table 89: East Asia Market Value (US$ Million) Forecast by Wavelength, 2019 to 2034

Table 90: East Asia Market Volume (Units) Forecast by Wavelength, 2019 to 2034

Table 91: East Asia Market Value (US$ Million) Forecast by Platform, 2019 to 2034

Table 92: East Asia Market Volume (Units) Forecast by Platform, 2019 to 2034

Table 93: East Asia Market Value (US$ Million) Forecast by End User, 2019 to 2034

Table 94: East Asia Market Volume (Units) Forecast by End User, 2019 to 2034

Table 95: East Asia Market Value (US$ Million) Forecast by Camera Installations, 2019 to 2034

Table 96: East Asia Market Volume (Units) Forecast by Camera Installations, 2019 to 2034

Table 97: East Asia Market Value (US$ Million) Forecast by Application, 2019 to 2034

Table 98: East Asia Market Volume (Units) Forecast by Application, 2019 to 2034

Table 99: Middle East and Africa Market Value (US$ Million) Forecast by Country, 2019 to 2034

Table 100: Middle East and Africa Market Volume (Units) Forecast by Country, 2019 to 2034

Table 101: Middle East and Africa Market Value (US$ Million) Forecast by Focal Length, 2019 to 2034

Table 102: Middle East and Africa Market Volume (Units) Forecast by Focal Length, 2019 to 2034

Table 103: Middle East and Africa Market Value (US$ Million) Forecast by Wavelength, 2019 to 2034

Table 104: Middle East and Africa Market Volume (Units) Forecast by Wavelength, 2019 to 2034

Table 105: Middle East and Africa Market Value (US$ Million) Forecast by Platform, 2019 to 2034

Table 106: Middle East and Africa Market Volume (Units) Forecast by Platform, 2019 to 2034

Table 107: Middle East and Africa Market Value (US$ Million) Forecast by End User, 2019 to 2034

Table 108: Middle East and Africa Market Volume (Units) Forecast by End User, 2019 to 2034

Table 109: Middle East and Africa Market Value (US$ Million) Forecast by Camera Installations, 2019 to 2034

Table 110: Middle East and Africa Market Volume (Units) Forecast by Camera Installations, 2019 to 2034

Table 111: Middle East and Africa Market Value (US$ Million) Forecast by Application, 2019 to 2034

Table 112: Middle East and Africa Market Volume (Units) Forecast by Application, 2019 to 2034

List of Charts

Figure 1: Global Market Value (US$ Million) by Focal Length, 2024 to 2034

Figure 2: Global Market Value (US$ Million) by Wavelength, 2024 to 2034

Figure 3: Global Market Value (US$ Million) by Platform, 2024 to 2034

Figure 4: Global Market Value (US$ Million) by End User, 2024 to 2034

Figure 5: Global Market Value (US$ Million) by Camera Installations, 2024 to 2034

Figure 6: Global Market Value (US$ Million) by Application, 2024 to 2034

Figure 7: Global Market Value (US$ Million) by Region, 2024 to 2034

Figure 8: Global Market Value (US$ Million) Analysis by Region, 2019 to 2034

Figure 9: Global Market Volume (Units) Analysis by Region, 2019 to 2034

Figure 10: Global Market Value Share (%) and BPS Analysis by Region, 2024 to 2034

Figure 11: Global Market Y-o-Y Growth (%) Projections by Region, 2024 to 2034

Figure 12: Global Market Value (US$ Million) Analysis by Focal Length, 2019 to 2034

Figure 13: Global Market Volume (Units) Analysis by Focal Length, 2019 to 2034

Figure 14: Global Market Value Share (%) and BPS Analysis by Focal Length, 2024 to 2034

Figure 15: Global Market Y-o-Y Growth (%) Projections by Focal Length, 2024 to 2034

Figure 16: Global Market Value (US$ Million) Analysis by Wavelength, 2019 to 2034

Figure 17: Global Market Volume (Units) Analysis by Wavelength, 2019 to 2034

Figure 18: Global Market Value Share (%) and BPS Analysis by Wavelength, 2024 to 2034

Figure 19: Global Market Y-o-Y Growth (%) Projections by Wavelength, 2024 to 2034

Figure 20: Global Market Value (US$ Million) Analysis by Platform, 2019 to 2034

Figure 21: Global Market Volume (Units) Analysis by Platform, 2019 to 2034

Figure 22: Global Market Value Share (%) and BPS Analysis by Platform, 2024 to 2034

Figure 23: Global Market Y-o-Y Growth (%) Projections by Platform, 2024 to 2034

Figure 24: Global Market Value (US$ Million) Analysis by End User, 2019 to 2034

Figure 25: Global Market Volume (Units) Analysis by End User, 2019 to 2034

Figure 26: Global Market Value Share (%) and BPS Analysis by End User, 2024 to 2034

Figure 27: Global Market Y-o-Y Growth (%) Projections by End User, 2024 to 2034

Figure 28: Global Market Value (US$ Million) Analysis by Camera Installations, 2019 to 2034

Figure 29: Global Market Volume (Units) Analysis by Camera Installations, 2019 to 2034

Figure 30: Global Market Value Share (%) and BPS Analysis by Camera Installations, 2024 to 2034

Figure 31: Global Market Y-o-Y Growth (%) Projections by Camera Installations, 2024 to 2034

Figure 32: Global Market Value (US$ Million) Analysis by Application, 2019 to 2034

Figure 33: Global Market Volume (Units) Analysis by Application, 2019 to 2034

Figure 34: Global Market Value Share (%) and BPS Analysis by Application, 2024 to 2034

Figure 35: Global Market Y-o-Y Growth (%) Projections by Application, 2024 to 2034

Figure 36: Global Market Attractiveness by Focal Length, 2024 to 2034

Figure 37: Global Market Attractiveness by Wavelength, 2024 to 2034

Figure 38: Global Market Attractiveness by Platform, 2024 to 2034

Figure 39: Global Market Attractiveness by End User, 2024 to 2034

Figure 40: Global Market Attractiveness by Camera Installations, 2024 to 2034

Figure 41: Global Market Attractiveness by Application, 2024 to 2034

Figure 42: Global Market Attractiveness by Region, 2024 to 2034

Figure 43: North America Market Value (US$ Million) by Focal Length, 2024 to 2034

Figure 44: North America Market Value (US$ Million) by Wavelength, 2024 to 2034

Figure 45: North America Market Value (US$ Million) by Platform, 2024 to 2034

Figure 46: North America Market Value (US$ Million) by End User, 2024 to 2034

Figure 47: North America Market Value (US$ Million) by Camera Installations, 2024 to 2034

Figure 48: North America Market Value (US$ Million) by Application, 2024 to 2034

Figure 49: North America Market Value (US$ Million) by Country, 2024 to 2034

Figure 50: North America Market Value (US$ Million) Analysis by Country, 2019 to 2034

Figure 51: North America Market Volume (Units) Analysis by Country, 2019 to 2034

Figure 52: North America Market Value Share (%) and BPS Analysis by Country, 2024 to 2034

Figure 53: North America Market Y-o-Y Growth (%) Projections by Country, 2024 to 2034

Figure 54: North America Market Value (US$ Million) Analysis by Focal Length, 2019 to 2034

Figure 55: North America Market Volume (Units) Analysis by Focal Length, 2019 to 2034

Figure 56: North America Market Value Share (%) and BPS Analysis by Focal Length, 2024 to 2034

Figure 57: North America Market Y-o-Y Growth (%) Projections by Focal Length, 2024 to 2034

Figure 58: North America Market Value (US$ Million) Analysis by Wavelength, 2019 to 2034

Figure 59: North America Market Volume (Units) Analysis by Wavelength, 2019 to 2034

Figure 60: North America Market Value Share (%) and BPS Analysis by Wavelength, 2024 to 2034

Figure 61: North America Market Y-o-Y Growth (%) Projections by Wavelength, 2024 to 2034

Figure 62: North America Market Value (US$ Million) Analysis by Platform, 2019 to 2034

Figure 63: North America Market Volume (Units) Analysis by Platform, 2019 to 2034

Figure 64: North America Market Value Share (%) and BPS Analysis by Platform, 2024 to 2034

Figure 65: North America Market Y-o-Y Growth (%) Projections by Platform, 2024 to 2034

Figure 66: North America Market Value (US$ Million) Analysis by End User, 2019 to 2034

Figure 67: North America Market Volume (Units) Analysis by End User, 2019 to 2034

Figure 68: North America Market Value Share (%) and BPS Analysis by End User, 2024 to 2034

Figure 69: North America Market Y-o-Y Growth (%) Projections by End User, 2024 to 2034

Figure 70: North America Market Value (US$ Million) Analysis by Camera Installations, 2019 to 2034

Figure 71: North America Market Volume (Units) Analysis by Camera Installations, 2019 to 2034

Figure 72: North America Market Value Share (%) and BPS Analysis by Camera Installations, 2024 to 2034

Figure 73: North America Market Y-o-Y Growth (%) Projections by Camera Installations, 2024 to 2034

Figure 74: North America Market Value (US$ Million) Analysis by Application, 2019 to 2034

Figure 75: North America Market Volume (Units) Analysis by Application, 2019 to 2034

Figure 76: North America Market Value Share (%) and BPS Analysis by Application, 2024 to 2034

Figure 77: North America Market Y-o-Y Growth (%) Projections by Application, 2024 to 2034

Figure 78: North America Market Attractiveness by Focal Length, 2024 to 2034

Figure 79: North America Market Attractiveness by Wavelength, 2024 to 2034

Figure 80: North America Market Attractiveness by Platform, 2024 to 2034

Figure 81: North America Market Attractiveness by End User, 2024 to 2034

Figure 82: North America Market Attractiveness by Camera Installations, 2024 to 2034

Figure 83: North America Market Attractiveness by Application, 2024 to 2034

Figure 84: North America Market Attractiveness by Country, 2024 to 2034

Figure 85: Latin America Market Value (US$ Million) by Focal Length, 2024 to 2034

Figure 86: Latin America Market Value (US$ Million) by Wavelength, 2024 to 2034

Figure 87: Latin America Market Value (US$ Million) by Platform, 2024 to 2034

Figure 88: Latin America Market Value (US$ Million) by End User, 2024 to 2034

Figure 89: Latin America Market Value (US$ Million) by Camera Installations, 2024 to 2034

Figure 90: Latin America Market Value (US$ Million) by Application, 2024 to 2034

Figure 91: Latin America Market Value (US$ Million) by Country, 2024 to 2034

Figure 92: Latin America Market Value (US$ Million) Analysis by Country, 2019 to 2034

Figure 93: Latin America Market Volume (Units) Analysis by Country, 2019 to 2034

Figure 94: Latin America Market Value Share (%) and BPS Analysis by Country, 2024 to 2034

Figure 95: Latin America Market Y-o-Y Growth (%) Projections by Country, 2024 to 2034

Figure 96: Latin America Market Value (US$ Million) Analysis by Focal Length, 2019 to 2034

Figure 97: Latin America Market Volume (Units) Analysis by Focal Length, 2019 to 2034

Figure 98: Latin America Market Value Share (%) and BPS Analysis by Focal Length, 2024 to 2034

Figure 99: Latin America Market Y-o-Y Growth (%) Projections by Focal Length, 2024 to 2034

Figure 100: Latin America Market Value (US$ Million) Analysis by Wavelength, 2019 to 2034

Figure 101: Latin America Market Volume (Units) Analysis by Wavelength, 2019 to 2034

Figure 102: Latin America Market Value Share (%) and BPS Analysis by Wavelength, 2024 to 2034

Figure 103: Latin America Market Y-o-Y Growth (%) Projections by Wavelength, 2024 to 2034

Figure 104: Latin America Market Value (US$ Million) Analysis by Platform, 2019 to 2034

Figure 105: Latin America Market Volume (Units) Analysis by Platform, 2019 to 2034

Figure 106: Latin America Market Value Share (%) and BPS Analysis by Platform, 2024 to 2034

Figure 107: Latin America Market Y-o-Y Growth (%) Projections by Platform, 2024 to 2034

Figure 108: Latin America Market Value (US$ Million) Analysis by End User, 2019 to 2034

Figure 109: Latin America Market Volume (Units) Analysis by End User, 2019 to 2034

Figure 110: Latin America Market Value Share (%) and BPS Analysis by End User, 2024 to 2034

Figure 111: Latin America Market Y-o-Y Growth (%) Projections by End User, 2024 to 2034

Figure 112: Latin America Market Value (US$ Million) Analysis by Camera Installations, 2019 to 2034

Figure 113: Latin America Market Volume (Units) Analysis by Camera Installations, 2019 to 2034

Figure 114: Latin America Market Value Share (%) and BPS Analysis by Camera Installations, 2024 to 2034

Figure 115: Latin America Market Y-o-Y Growth (%) Projections by Camera Installations, 2024 to 2034

Figure 116: Latin America Market Value (US$ Million) Analysis by Application, 2019 to 2034

Figure 117: Latin America Market Volume (Units) Analysis by Application, 2019 to 2034

Figure 118: Latin America Market Value Share (%) and BPS Analysis by Application, 2024 to 2034

Figure 119: Latin America Market Y-o-Y Growth (%) Projections by Application, 2024 to 2034

Figure 120: Latin America Market Attractiveness by Focal Length, 2024 to 2034

Figure 121: Latin America Market Attractiveness by Wavelength, 2024 to 2034

Figure 122: Latin America Market Attractiveness by Platform, 2024 to 2034

Figure 123: Latin America Market Attractiveness by End User, 2024 to 2034

Figure 124: Latin America Market Attractiveness by Camera Installations, 2024 to 2034

Figure 125: Latin America Market Attractiveness by Application, 2024 to 2034

Figure 126: Latin America Market Attractiveness by Country, 2024 to 2034

Figure 127: Western Europe Market Value (US$ Million) by Focal Length, 2024 to 2034

Figure 128: Western Europe Market Value (US$ Million) by Wavelength, 2024 to 2034

Figure 129: Western Europe Market Value (US$ Million) by Platform, 2024 to 2034

Figure 130: Western Europe Market Value (US$ Million) by End User, 2024 to 2034

Figure 131: Western Europe Market Value (US$ Million) by Camera Installations, 2024 to 2034

Figure 132: Western Europe Market Value (US$ Million) by Application, 2024 to 2034

Figure 133: Western Europe Market Value (US$ Million) by Country, 2024 to 2034

Figure 134: Western Europe Market Value (US$ Million) Analysis by Country, 2019 to 2034

Figure 135: Western Europe Market Volume (Units) Analysis by Country, 2019 to 2034

Figure 136: Western Europe Market Value Share (%) and BPS Analysis by Country, 2024 to 2034

Figure 137: Western Europe Market Y-o-Y Growth (%) Projections by Country, 2024 to 2034

Figure 138: Western Europe Market Value (US$ Million) Analysis by Focal Length, 2019 to 2034

Figure 139: Western Europe Market Volume (Units) Analysis by Focal Length, 2019 to 2034

Figure 140: Western Europe Market Value Share (%) and BPS Analysis by Focal Length, 2024 to 2034

Figure 141: Western Europe Market Y-o-Y Growth (%) Projections by Focal Length, 2024 to 2034

Figure 142: Western Europe Market Value (US$ Million) Analysis by Wavelength, 2019 to 2034

Figure 143: Western Europe Market Volume (Units) Analysis by Wavelength, 2019 to 2034

Figure 144: Western Europe Market Value Share (%) and BPS Analysis by Wavelength, 2024 to 2034

Figure 145: Western Europe Market Y-o-Y Growth (%) Projections by Wavelength, 2024 to 2034

Figure 146: Western Europe Market Value (US$ Million) Analysis by Platform, 2019 to 2034

Figure 147: Western Europe Market Volume (Units) Analysis by Platform, 2019 to 2034

Figure 148: Western Europe Market Value Share (%) and BPS Analysis by Platform, 2024 to 2034

Figure 149: Western Europe Market Y-o-Y Growth (%) Projections by Platform, 2024 to 2034

Figure 150: Western Europe Market Value (US$ Million) Analysis by End User, 2019 to 2034

Figure 151: Western Europe Market Volume (Units) Analysis by End User, 2019 to 2034

Figure 152: Western Europe Market Value Share (%) and BPS Analysis by End User, 2024 to 2034

Figure 153: Western Europe Market Y-o-Y Growth (%) Projections by End User, 2024 to 2034

Figure 154: Western Europe Market Value (US$ Million) Analysis by Camera Installations, 2019 to 2034

Figure 155: Western Europe Market Volume (Units) Analysis by Camera Installations, 2019 to 2034

Figure 156: Western Europe Market Value Share (%) and BPS Analysis by Camera Installations, 2024 to 2034

Figure 157: Western Europe Market Y-o-Y Growth (%) Projections by Camera Installations, 2024 to 2034

Figure 158: Western Europe Market Value (US$ Million) Analysis by Application, 2019 to 2034

Figure 159: Western Europe Market Volume (Units) Analysis by Application, 2019 to 2034

Figure 160: Western Europe Market Value Share (%) and BPS Analysis by Application, 2024 to 2034

Figure 161: Western Europe Market Y-o-Y Growth (%) Projections by Application, 2024 to 2034

Figure 162: Western Europe Market Attractiveness by Focal Length, 2024 to 2034

Figure 163: Western Europe Market Attractiveness by Wavelength, 2024 to 2034

Figure 164: Western Europe Market Attractiveness by Platform, 2024 to 2034

Figure 165: Western Europe Market Attractiveness by End User, 2024 to 2034

Figure 166: Western Europe Market Attractiveness by Camera Installations, 2024 to 2034

Figure 167: Western Europe Market Attractiveness by Application, 2024 to 2034

Figure 168: Western Europe Market Attractiveness by Country, 2024 to 2034

Figure 169: Eastern Europe Market Value (US$ Million) by Focal Length, 2024 to 2034

Figure 170: Eastern Europe Market Value (US$ Million) by Wavelength, 2024 to 2034

Figure 171: Eastern Europe Market Value (US$ Million) by Platform, 2024 to 2034

Figure 172: Eastern Europe Market Value (US$ Million) by End User, 2024 to 2034

Figure 173: Eastern Europe Market Value (US$ Million) by Camera Installations, 2024 to 2034

Figure 174: Eastern Europe Market Value (US$ Million) by Application, 2024 to 2034

Figure 175: Eastern Europe Market Value (US$ Million) by Country, 2024 to 2034

Figure 176: Eastern Europe Market Value (US$ Million) Analysis by Country, 2019 to 2034

Figure 177: Eastern Europe Market Volume (Units) Analysis by Country, 2019 to 2034

Figure 178: Eastern Europe Market Value Share (%) and BPS Analysis by Country, 2024 to 2034

Figure 179: Eastern Europe Market Y-o-Y Growth (%) Projections by Country, 2024 to 2034

Figure 180: Eastern Europe Market Value (US$ Million) Analysis by Focal Length, 2019 to 2034

Figure 181: Eastern Europe Market Volume (Units) Analysis by Focal Length, 2019 to 2034

Figure 182: Eastern Europe Market Value Share (%) and BPS Analysis by Focal Length, 2024 to 2034

Figure 183: Eastern Europe Market Y-o-Y Growth (%) Projections by Focal Length, 2024 to 2034

Figure 184: Eastern Europe Market Value (US$ Million) Analysis by Wavelength, 2019 to 2034

Figure 185: Eastern Europe Market Volume (Units) Analysis by Wavelength, 2019 to 2034

Figure 186: Eastern Europe Market Value Share (%) and BPS Analysis by Wavelength, 2024 to 2034

Figure 187: Eastern Europe Market Y-o-Y Growth (%) Projections by Wavelength, 2024 to 2034

Figure 188: Eastern Europe Market Value (US$ Million) Analysis by Platform, 2019 to 2034

Figure 189: Eastern Europe Market Volume (Units) Analysis by Platform, 2019 to 2034

Figure 190: Eastern Europe Market Value Share (%) and BPS Analysis by Platform, 2024 to 2034

Figure 191: Eastern Europe Market Y-o-Y Growth (%) Projections by Platform, 2024 to 2034

Figure 192: Eastern Europe Market Value (US$ Million) Analysis by End User, 2019 to 2034

Figure 193: Eastern Europe Market Volume (Units) Analysis by End User, 2019 to 2034

Figure 194: Eastern Europe Market Value Share (%) and BPS Analysis by End User, 2024 to 2034

Figure 195: Eastern Europe Market Y-o-Y Growth (%) Projections by End User, 2024 to 2034

Figure 196: Eastern Europe Market Value (US$ Million) Analysis by Camera Installations, 2019 to 2034

Figure 197: Eastern Europe Market Volume (Units) Analysis by Camera Installations, 2019 to 2034

Figure 198: Eastern Europe Market Value Share (%) and BPS Analysis by Camera Installations, 2024 to 2034

Figure 199: Eastern Europe Market Y-o-Y Growth (%) Projections by Camera Installations, 2024 to 2034

Figure 200: Eastern Europe Market Value (US$ Million) Analysis by Application, 2019 to 2034

Figure 201: Eastern Europe Market Volume (Units) Analysis by Application, 2019 to 2034

Figure 202: Eastern Europe Market Value Share (%) and BPS Analysis by Application, 2024 to 2034

Figure 203: Eastern Europe Market Y-o-Y Growth (%) Projections by Application, 2024 to 2034

Figure 204: Eastern Europe Market Attractiveness by Focal Length, 2024 to 2034

Figure 205: Eastern Europe Market Attractiveness by Wavelength, 2024 to 2034

Figure 206: Eastern Europe Market Attractiveness by Platform, 2024 to 2034

Figure 207: Eastern Europe Market Attractiveness by End User, 2024 to 2034

Figure 208: Eastern Europe Market Attractiveness by Camera Installations, 2024 to 2034

Figure 209: Eastern Europe Market Attractiveness by Application, 2024 to 2034

Figure 210: Eastern Europe Market Attractiveness by Country, 2024 to 2034

Figure 211: South Asia and Pacific Market Value (US$ Million) by Focal Length, 2024 to 2034

Figure 212: South Asia and Pacific Market Value (US$ Million) by Wavelength, 2024 to 2034

Figure 213: South Asia and Pacific Market Value (US$ Million) by Platform, 2024 to 2034

Figure 214: South Asia and Pacific Market Value (US$ Million) by End User, 2024 to 2034

Figure 215: South Asia and Pacific Market Value (US$ Million) by Camera Installations, 2024 to 2034

Figure 216: South Asia and Pacific Market Value (US$ Million) by Application, 2024 to 2034

Figure 217: South Asia and Pacific Market Value (US$ Million) by Country, 2024 to 2034

Figure 218: South Asia and Pacific Market Value (US$ Million) Analysis by Country, 2019 to 2034

Figure 219: South Asia and Pacific Market Volume (Units) Analysis by Country, 2019 to 2034

Figure 220: South Asia and Pacific Market Value Share (%) and BPS Analysis by Country, 2024 to 2034

Figure 221: South Asia and Pacific Market Y-o-Y Growth (%) Projections by Country, 2024 to 2034

Figure 222: South Asia and Pacific Market Value (US$ Million) Analysis by Focal Length, 2019 to 2034

Figure 223: South Asia and Pacific Market Volume (Units) Analysis by Focal Length, 2019 to 2034

Figure 224: South Asia and Pacific Market Value Share (%) and BPS Analysis by Focal Length, 2024 to 2034

Figure 225: South Asia and Pacific Market Y-o-Y Growth (%) Projections by Focal Length, 2024 to 2034

Figure 226: South Asia and Pacific Market Value (US$ Million) Analysis by Wavelength, 2019 to 2034

Figure 227: South Asia and Pacific Market Volume (Units) Analysis by Wavelength, 2019 to 2034

Figure 228: South Asia and Pacific Market Value Share (%) and BPS Analysis by Wavelength, 2024 to 2034

Figure 229: South Asia and Pacific Market Y-o-Y Growth (%) Projections by Wavelength, 2024 to 2034

Figure 230: South Asia and Pacific Market Value (US$ Million) Analysis by Platform, 2019 to 2034

Figure 231: South Asia and Pacific Market Volume (Units) Analysis by Platform, 2019 to 2034

Figure 232: South Asia and Pacific Market Value Share (%) and BPS Analysis by Platform, 2024 to 2034

Figure 233: South Asia and Pacific Market Y-o-Y Growth (%) Projections by Platform, 2024 to 2034

Figure 234: South Asia and Pacific Market Value (US$ Million) Analysis by End User, 2019 to 2034

Figure 235: South Asia and Pacific Market Volume (Units) Analysis by End User, 2019 to 2034

Figure 236: South Asia and Pacific Market Value Share (%) and BPS Analysis by End User, 2024 to 2034

Figure 237: South Asia and Pacific Market Y-o-Y Growth (%) Projections by End User, 2024 to 2034

Figure 238: South Asia and Pacific Market Value (US$ Million) Analysis by Camera Installations, 2019 to 2034

Figure 239: South Asia and Pacific Market Volume (Units) Analysis by Camera Installations, 2019 to 2034

Figure 240: South Asia and Pacific Market Value Share (%) and BPS Analysis by Camera Installations, 2024 to 2034

Figure 241: South Asia and Pacific Market Y-o-Y Growth (%) Projections by Camera Installations, 2024 to 2034

Figure 242: South Asia and Pacific Market Value (US$ Million) Analysis by Application, 2019 to 2034

Figure 243: South Asia and Pacific Market Volume (Units) Analysis by Application, 2019 to 2034

Figure 244: South Asia and Pacific Market Value Share (%) and BPS Analysis by Application, 2024 to 2034

Figure 245: South Asia and Pacific Market Y-o-Y Growth (%) Projections by Application, 2024 to 2034

Figure 246: South Asia and Pacific Market Attractiveness by Focal Length, 2024 to 2034

Figure 247: South Asia and Pacific Market Attractiveness by Wavelength, 2024 to 2034

Figure 248: South Asia and Pacific Market Attractiveness by Platform, 2024 to 2034

Figure 249: South Asia and Pacific Market Attractiveness by End User, 2024 to 2034

Figure 250: South Asia and Pacific Market Attractiveness by Camera Installations, 2024 to 2034

Figure 251: South Asia and Pacific Market Attractiveness by Application, 2024 to 2034

Figure 252: South Asia and Pacific Market Attractiveness by Country, 2024 to 2034

Figure 253: East Asia Market Value (US$ Million) by Focal Length, 2024 to 2034

Figure 254: East Asia Market Value (US$ Million) by Wavelength, 2024 to 2034

Figure 255: East Asia Market Value (US$ Million) by Platform, 2024 to 2034

Figure 256: East Asia Market Value (US$ Million) by End User, 2024 to 2034

Figure 257: East Asia Market Value (US$ Million) by Camera Installations, 2024 to 2034

Figure 258: East Asia Market Value (US$ Million) by Application, 2024 to 2034

Figure 259: East Asia Market Value (US$ Million) by Country, 2024 to 2034

Figure 260: East Asia Market Value (US$ Million) Analysis by Country, 2019 to 2034

Figure 261: East Asia Market Volume (Units) Analysis by Country, 2019 to 2034

Figure 262: East Asia Market Value Share (%) and BPS Analysis by Country, 2024 to 2034

Figure 263: East Asia Market Y-o-Y Growth (%) Projections by Country, 2024 to 2034

Figure 264: East Asia Market Value (US$ Million) Analysis by Focal Length, 2019 to 2034

Figure 265: East Asia Market Volume (Units) Analysis by Focal Length, 2019 to 2034

Figure 266: East Asia Market Value Share (%) and BPS Analysis by Focal Length, 2024 to 2034

Figure 267: East Asia Market Y-o-Y Growth (%) Projections by Focal Length, 2024 to 2034

Figure 268: East Asia Market Value (US$ Million) Analysis by Wavelength, 2019 to 2034

Figure 269: East Asia Market Volume (Units) Analysis by Wavelength, 2019 to 2034

Figure 270: East Asia Market Value Share (%) and BPS Analysis by Wavelength, 2024 to 2034

Figure 271: East Asia Market Y-o-Y Growth (%) Projections by Wavelength, 2024 to 2034

Figure 272: East Asia Market Value (US$ Million) Analysis by Platform, 2019 to 2034

Figure 273: East Asia Market Volume (Units) Analysis by Platform, 2019 to 2034

Figure 274: East Asia Market Value Share (%) and BPS Analysis by Platform, 2024 to 2034

Figure 275: East Asia Market Y-o-Y Growth (%) Projections by Platform, 2024 to 2034

Figure 276: East Asia Market Value (US$ Million) Analysis by End User, 2019 to 2034

Figure 277: East Asia Market Volume (Units) Analysis by End User, 2019 to 2034

Figure 278: East Asia Market Value Share (%) and BPS Analysis by End User, 2024 to 2034

Figure 279: East Asia Market Y-o-Y Growth (%) Projections by End User, 2024 to 2034

Figure 280: East Asia Market Value (US$ Million) Analysis by Camera Installations, 2019 to 2034

Figure 281: East Asia Market Volume (Units) Analysis by Camera Installations, 2019 to 2034

Figure 282: East Asia Market Value Share (%) and BPS Analysis by Camera Installations, 2024 to 2034

Figure 283: East Asia Market Y-o-Y Growth (%) Projections by Camera Installations, 2024 to 2034

Figure 284: East Asia Market Value (US$ Million) Analysis by Application, 2019 to 2034

Figure 285: East Asia Market Volume (Units) Analysis by Application, 2019 to 2034

Figure 286: East Asia Market Value Share (%) and BPS Analysis by Application, 2024 to 2034

Figure 287: East Asia Market Y-o-Y Growth (%) Projections by Application, 2024 to 2034

Figure 288: East Asia Market Attractiveness by Focal Length, 2024 to 2034

Figure 289: East Asia Market Attractiveness by Wavelength, 2024 to 2034

Figure 290: East Asia Market Attractiveness by Platform, 2024 to 2034

Figure 291: East Asia Market Attractiveness by End User, 2024 to 2034

Figure 292: East Asia Market Attractiveness by Camera Installations, 2024 to 2034

Figure 293: East Asia Market Attractiveness by Application, 2024 to 2034

Figure 294: East Asia Market Attractiveness by Country, 2024 to 2034

Figure 295: Middle East and Africa Market Value (US$ Million) by Focal Length, 2024 to 2034

Figure 296: Middle East and Africa Market Value (US$ Million) by Wavelength, 2024 to 2034

Figure 297: Middle East and Africa Market Value (US$ Million) by Platform, 2024 to 2034

Figure 298: Middle East and Africa Market Value (US$ Million) by End User, 2024 to 2034

Figure 299: Middle East and Africa Market Value (US$ Million) by Camera Installations, 2024 to 2034

Figure 300: Middle East and Africa Market Value (US$ Million) by Application, 2024 to 2034

Figure 301: Middle East and Africa Market Value (US$ Million) by Country, 2024 to 2034

Figure 302: Middle East and Africa Market Value (US$ Million) Analysis by Country, 2019 to 2034

Figure 303: Middle East and Africa Market Volume (Units) Analysis by Country, 2019 to 2034

Figure 304: Middle East and Africa Market Value Share (%) and BPS Analysis by Country, 2024 to 2034

Figure 305: Middle East and Africa Market Y-o-Y Growth (%) Projections by Country, 2024 to 2034

Figure 306: Middle East and Africa Market Value (US$ Million) Analysis by Focal Length, 2019 to 2034

Figure 307: Middle East and Africa Market Volume (Units) Analysis by Focal Length, 2019 to 2034

Figure 308: Middle East and Africa Market Value Share (%) and BPS Analysis by Focal Length, 2024 to 2034

Figure 309: Middle East and Africa Market Y-o-Y Growth (%) Projections by Focal Length, 2024 to 2034

Figure 310: Middle East and Africa Market Value (US$ Million) Analysis by Wavelength, 2019 to 2034

Figure 311: Middle East and Africa Market Volume (Units) Analysis by Wavelength, 2019 to 2034

Figure 312: Middle East and Africa Market Value Share (%) and BPS Analysis by Wavelength, 2024 to 2034

Figure 313: Middle East and Africa Market Y-o-Y Growth (%) Projections by Wavelength, 2024 to 2034

Figure 314: Middle East and Africa Market Value (US$ Million) Analysis by Platform, 2019 to 2034

Figure 315: Middle East and Africa Market Volume (Units) Analysis by Platform, 2019 to 2034

Figure 316: Middle East and Africa Market Value Share (%) and BPS Analysis by Platform, 2024 to 2034

Figure 317: Middle East and Africa Market Y-o-Y Growth (%) Projections by Platform, 2024 to 2034

Figure 318: Middle East and Africa Market Value (US$ Million) Analysis by End User, 2019 to 2034

Figure 319: Middle East and Africa Market Volume (Units) Analysis by End User, 2019 to 2034

Figure 320: Middle East and Africa Market Value Share (%) and BPS Analysis by End User, 2024 to 2034

Figure 321: Middle East and Africa Market Y-o-Y Growth (%) Projections by End User, 2024 to 2034

Figure 322: Middle East and Africa Market Value (US$ Million) Analysis by Camera Installations, 2019 to 2034

Figure 323: Middle East and Africa Market Volume (Units) Analysis by Camera Installations, 2019 to 2034

Figure 324: Middle East and Africa Market Value Share (%) and BPS Analysis by Camera Installations, 2024 to 2034

Figure 325: Middle East and Africa Market Y-o-Y Growth (%) Projections by Camera Installations, 2024 to 2034

Figure 326: Middle East and Africa Market Value (US$ Million) Analysis by Application, 2019 to 2034

Figure 327: Middle East and Africa Market Volume (Units) Analysis by Application, 2019 to 2034

Figure 328: Middle East and Africa Market Value Share (%) and BPS Analysis by Application, 2024 to 2034

Figure 329: Middle East and Africa Market Y-o-Y Growth (%) Projections by Application, 2024 to 2034

Figure 330: Middle East and Africa Market Attractiveness by Focal Length, 2024 to 2034

Figure 331: Middle East and Africa Market Attractiveness by Wavelength, 2024 to 2034

Figure 332: Middle East and Africa Market Attractiveness by Platform, 2024 to 2034

Figure 333: Middle East and Africa Market Attractiveness by End User, 2024 to 2034

Figure 334: Middle East and Africa Market Attractiveness by Camera Installations, 2024 to 2034

Figure 335: Middle East and Africa Market Attractiveness by Application, 2024 to 2034

Figure 336: Middle East and Africa Market Attractiveness by Country, 2024 to 2034

Recommendations

Technology

Multispectral Camera Market

Published : March 2024

Technology

3D Camera Market

Published : November 2023

Technology

Smart Camera Market

Published : July 2023

Technology

GigE Camera Market

Published : October 2022

Explore Technology Insights

View Reports