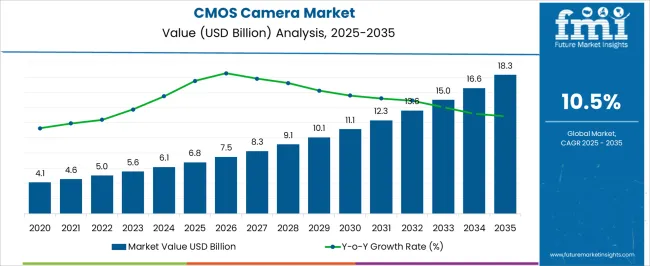
The global CMOS camera market is predicted to rise at a stellar CAGR of 11% over the forecast period from 2023 to 2033. Hence, the sales of CMOS cameras are thereby expected to attain a valuation of USD 15.6 billion by 2033, more than doubling the current market size of USD 5.5 billion.
The consumer electronics business is always changing and expanding. Numerous innovative goods and advancements have emerged in the area, resulting in significant investments and creativity.
Further, CMOS cameras are typically utilized in digital cameras, but they are also found in a wide range of imaging devices, including consumer and manufacturing uses, as well as safety and monitoring.
The CMOS camera industry is experiencing substantial development in consumer electronics owing to the significant expansion of cameras, camcorders, smartphones, and security cameras.
Sales of CMOS cameras account for around 15% of the global digital camera market revenue. Moreover, HD CMOS cameras are expected to have a bright outlook over the coming years as the availability of HD CMOS image sensors increases.
Increasing adoption of smartphones in regions of East Asia, South Asia, and the Asia Pacific is expected to boost sales of CMOS camera modules in these regions. Also, CMOS image sensor providers can focus on developing economies such as India and China which are experiencing rapid industrialization and urbanization at a massive scale.
Attribute | Details |
---|---|
CMOS Camera Market Size (2023) | USD 5.5 billion |
Estimated Valuation (2033) | USD 15.6 billion |
Projected Market Growth Rate (2023 to 2033) | 11% CAGR |
Cameras have found a multitude of applications in various end-use industries such as security and surveillance, military, entertainment, etc.
In recent years digital cameras have gained massive popularity and subsequently, they have driven demand for image sensors as well. Moreover, CMOS camera consumption increased at a high CAGR of 10.5% from 2018 to 2022 as the popularity of digital cameras rose in an increasingly digital world.
Increasing use of smartphones, high demand for digital cameras, increasing use of cameras in multiple end-use industries, rapid technological advancements in camera technology, and wide availability of CMOS image sensors are some a few key factors that are expected to guide sales of CMOS cameras over the forecast.
Wireless CMOS cameras are anticipated to see a high increase in popularity and are anticipated to see high scope of application in the security and surveillance industry.
Further, scientific CMOS cameras are expected to be popular in the healthcare industry as imaging becomes popular and mainstream in diagnostic and treatment procedures. CMOS camera demand is projected to rise at a phenomenal CAGR of 11% from 2023 to 2033.
High Demand from Security & Surveillance Industry to Boost CMOS Security Camera Sales
Focus on security and surveillance has increased more than ever before and this has fostered a new demand for CMOS security cameras. CMOS cameras for security and surveillance are gaining popularity due to their cost-effectiveness, low power consumption features, and compact size with high-quality imaging capabilities. For instance,
Most smartphones in the modern world utilize CMOS image sensors as they are extremely compact and are easy to fit in a small form factor without compromising picture quality.
Also, CMOS camera modules have been immensely popular among smartphone manufacturers and now even camera manufacturers are opting for CMOS image sensors as they develop mirrorless cameras.
Increasing adoption of smartphones on a global scale is expected to prove highly beneficial for CMOS camera manufacturers.
The global CMOS camera industry has detailed insights into North America, Latin America, Europe, East Asia, South Asia & Pacific, and the Middle East & Africa (MEA).
Additionally, CMOS camera consumption in North America is expected to account for a dominant market share in the global landscape. The increasing use of smartphones and rising demand for machine vision technologies are expected to majorly drive sales of CMOS camera sensors in this region.
Increasing research and development activities in Europe are expected to propel the demand for scientific CMOS cameras in the region. Further, healthcare and security end-use industries are anticipated to provide key opportunities for CMOS camera module manufacturers in this region. North America accounted for a market share of 45% in 2022.
Increasing Focus on Security to Boost Demand for CMOS Security Cameras
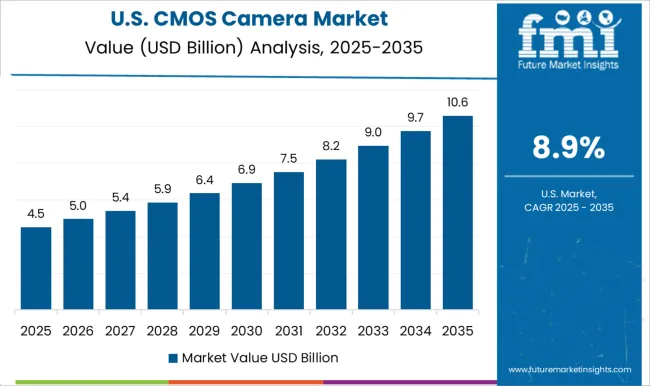
The United States is a highly dominant market for CMOS camera providers as the nation has seen investments to bolster its security and surveillance systems. CMOS image sensors have found application in the security and surveillance industry due to their compact size and high picture quality.
The United States has seen an increase in demand for CMOS security cameras from the military as well as residential sectors as security expenditure of individuals and government has increased. Also, scientific CMOS cameras are also expected to see an increase in demand as research and development activities in the nation increase.
The Presence of Key CMOS Camera Companies to Bolster Market Potential in China
China has been identified as a key manufacturing hub for many technologies and especially for semiconductor components like image sensors.
CMOS camera manufacturers can benefit from the established manufacturing infrastructure in China and can also leverage government initiatives to boost their investments and increase their market presence to establish themselves.
Further, the presence of key CMOS camera vendors in China is expected to boost CMOS camera shipments across the nation. The market in China is anticipated to thrive at a CAGR of 10%.
HD CMOS Cameras are Expected to See Increased Demand
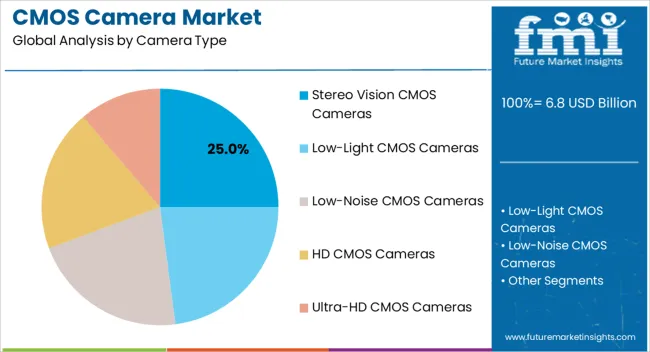
CMOS cameras have gained massive popularity over the past few years and cameras equipped with CMOS sensors have proven to be highly efficient and productive. Low-light and night vision CMOS cameras are expected to have a dominant outlook in the CMOS camera marketplace as they are holding a market share of 38% in 2023.
HD CMOS cameras are also expected to see an increase in sales as demand for high-quality video increases and advancements in video technology pace up. Currently, HD CMOS cameras account for 28% of the global CMOS camera sales revenue.
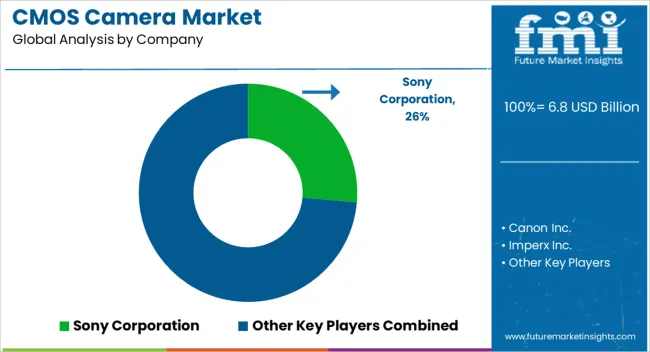
CMOS camera manufacturers are focusing on providing optimal products to multiple end-use industries and are investing in the research and development of advanced image sensor technologies.
CMOS camera vendors are also opting for collaborations and mergers to speed up the research and development of new CMOS camera modules and CMOS image sensors.
Attributes | Details |
---|---|
Forecast Period | 2023 to 2033 |
Historical Data Available for | 2018 to 2022 |
CMOS Camera Market Size (2023) | USD 5.5 billion |
Estimated Valuation (2033) | USD 15.6 billion |
Projected Market Growth Rate (2023 to 2033) | 11% CAGR |
Market Analysis | USD million for Value, Units for Volume |
Key Regions Covered | North America; Latin America; Western Europe; Eastern Europe; South Asia & Pacific; East Asia; The Middle East & Africa (MEA) |
Key Countries Covered | The United States, Canada, Brazil, Mexico, Germany, The United Kingdom, France, Spain, Italy, Poland, Russia, Czech Republic, Romania, India, Bangladesh, Australia, New Zealand, China, Japan, South Korea, GCC Countries, South Africa, Israel |
Key Market Segments Covered | Camera Type, Professional Services, Pixel Density (Megapixels), Application, Region |
Key Companies Profiled | Canon Inc.; Imperx Inc.; Teledyne Technologies; Samsung; Hamamatsu Photonics; Sony Corporation; Toshiba Corporation; Baumer; Basler AG; Fairchild Imaging (BAE Systems); Kappa optronics GmbH; Adimec Advanced Image Systems, LHERITIER (ALCEN Group); Hangzhou Hikvision Digital Technology Co. Ltd.; PCO-TECH Inc. (PCO); IDS Imaging Development Systems GmbH; SVS-Vistek GmbH; Teledyne Lumenera; STEMMER IMAGING AG; JAI A/S |
Pricing | Available upon Request |
Table 1: Global Market Value (US$ Million) Forecast by Region, 2018 to 2033
Table 2: Global Market Volume (Units) Forecast by Region, 2018 to 2033
Table 3: Global Market Value (US$ Million) Forecast by Camera Type, 2018 to 2033
Table 4: Global Market Volume (Units) Forecast by Camera Type, 2018 to 2033
Table 5: Global Market Value (US$ Million) Forecast by Professional Services, 2018 to 2033
Table 6: Global Market Volume (Units) Forecast by Professional Services, 2018 to 2033
Table 7: Global Market Value (US$ Million) Forecast by Pixel Density, 2018 to 2033
Table 8: Global Market Volume (Units) Forecast by Pixel Density, 2018 to 2033
Table 9: Global Market Value (US$ Million) Forecast by Application, 2018 to 2033
Table 10: Global Market Volume (Units) Forecast by Application, 2018 to 2033
Table 11: North America Market Value (US$ Million) Forecast by Country, 2018 to 2033
Table 12: North America Market Volume (Units) Forecast by Country, 2018 to 2033
Table 13: North America Market Value (US$ Million) Forecast by Camera Type, 2018 to 2033
Table 14: North America Market Volume (Units) Forecast by Camera Type, 2018 to 2033
Table 15: North America Market Value (US$ Million) Forecast by Professional Services, 2018 to 2033
Table 16: North America Market Volume (Units) Forecast by Professional Services, 2018 to 2033
Table 17: North America Market Value (US$ Million) Forecast by Pixel Density, 2018 to 2033
Table 18: North America Market Volume (Units) Forecast by Pixel Density, 2018 to 2033
Table 19: North America Market Value (US$ Million) Forecast by Application, 2018 to 2033
Table 20: North America Market Volume (Units) Forecast by Application, 2018 to 2033
Table 21: Latin America Market Value (US$ Million) Forecast by Country, 2018 to 2033
Table 22: Latin America Market Volume (Units) Forecast by Country, 2018 to 2033
Table 23: Latin America Market Value (US$ Million) Forecast by Camera Type, 2018 to 2033
Table 24: Latin America Market Volume (Units) Forecast by Camera Type, 2018 to 2033
Table 25: Latin America Market Value (US$ Million) Forecast by Professional Services, 2018 to 2033
Table 26: Latin America Market Volume (Units) Forecast by Professional Services, 2018 to 2033
Table 27: Latin America Market Value (US$ Million) Forecast by Pixel Density, 2018 to 2033
Table 28: Latin America Market Volume (Units) Forecast by Pixel Density, 2018 to 2033
Table 29: Latin America Market Value (US$ Million) Forecast by Application, 2018 to 2033
Table 30: Latin America Market Volume (Units) Forecast by Application, 2018 to 2033
Table 31: Western Europe Market Value (US$ Million) Forecast by Country, 2018 to 2033
Table 32: Western Europe Market Volume (Units) Forecast by Country, 2018 to 2033
Table 33: Western Europe Market Value (US$ Million) Forecast by Camera Type, 2018 to 2033
Table 34: Western Europe Market Volume (Units) Forecast by Camera Type, 2018 to 2033
Table 35: Western Europe Market Value (US$ Million) Forecast by Professional Services, 2018 to 2033
Table 36: Western Europe Market Volume (Units) Forecast by Professional Services, 2018 to 2033
Table 37: Western Europe Market Value (US$ Million) Forecast by Pixel Density, 2018 to 2033
Table 38: Western Europe Market Volume (Units) Forecast by Pixel Density, 2018 to 2033
Table 39: Western Europe Market Value (US$ Million) Forecast by Application, 2018 to 2033
Table 40: Western Europe Market Volume (Units) Forecast by Application, 2018 to 2033
Table 41: Eastern Europe Market Value (US$ Million) Forecast by Country, 2018 to 2033
Table 42: Eastern Europe Market Volume (Units) Forecast by Country, 2018 to 2033
Table 43: Eastern Europe Market Value (US$ Million) Forecast by Camera Type, 2018 to 2033
Table 44: Eastern Europe Market Volume (Units) Forecast by Camera Type, 2018 to 2033
Table 45: Eastern Europe Market Value (US$ Million) Forecast by Professional Services, 2018 to 2033
Table 46: Eastern Europe Market Volume (Units) Forecast by Professional Services, 2018 to 2033
Table 47: Eastern Europe Market Value (US$ Million) Forecast by Pixel Density, 2018 to 2033
Table 48: Eastern Europe Market Volume (Units) Forecast by Pixel Density, 2018 to 2033
Table 49: Eastern Europe Market Value (US$ Million) Forecast by Application, 2018 to 2033
Table 50: Eastern Europe Market Volume (Units) Forecast by Application, 2018 to 2033
Table 51: South Asia and Pacific Market Value (US$ Million) Forecast by Country, 2018 to 2033
Table 52: South Asia and Pacific Market Volume (Units) Forecast by Country, 2018 to 2033
Table 53: South Asia and Pacific Market Value (US$ Million) Forecast by Camera Type, 2018 to 2033
Table 54: South Asia and Pacific Market Volume (Units) Forecast by Camera Type, 2018 to 2033
Table 55: South Asia and Pacific Market Value (US$ Million) Forecast by Professional Services, 2018 to 2033
Table 56: South Asia and Pacific Market Volume (Units) Forecast by Professional Services, 2018 to 2033
Table 57: South Asia and Pacific Market Value (US$ Million) Forecast by Pixel Density, 2018 to 2033
Table 58: South Asia and Pacific Market Volume (Units) Forecast by Pixel Density, 2018 to 2033
Table 59: South Asia and Pacific Market Value (US$ Million) Forecast by Application, 2018 to 2033
Table 60: South Asia and Pacific Market Volume (Units) Forecast by Application, 2018 to 2033
Table 61: East Asia Market Value (US$ Million) Forecast by Country, 2018 to 2033
Table 62: East Asia Market Volume (Units) Forecast by Country, 2018 to 2033
Table 63: East Asia Market Value (US$ Million) Forecast by Camera Type, 2018 to 2033
Table 64: East Asia Market Volume (Units) Forecast by Camera Type, 2018 to 2033
Table 65: East Asia Market Value (US$ Million) Forecast by Professional Services, 2018 to 2033
Table 66: East Asia Market Volume (Units) Forecast by Professional Services, 2018 to 2033
Table 67: East Asia Market Value (US$ Million) Forecast by Pixel Density, 2018 to 2033
Table 68: East Asia Market Volume (Units) Forecast by Pixel Density, 2018 to 2033
Table 69: East Asia Market Value (US$ Million) Forecast by Application, 2018 to 2033
Table 70: East Asia Market Volume (Units) Forecast by Application, 2018 to 2033
Table 71: Middle East and Africa Market Value (US$ Million) Forecast by Country, 2018 to 2033
Table 72: Middle East and Africa Market Volume (Units) Forecast by Country, 2018 to 2033
Table 73: Middle East and Africa Market Value (US$ Million) Forecast by Camera Type, 2018 to 2033
Table 74: Middle East and Africa Market Volume (Units) Forecast by Camera Type, 2018 to 2033
Table 75: Middle East and Africa Market Value (US$ Million) Forecast by Professional Services, 2018 to 2033
Table 76: Middle East and Africa Market Volume (Units) Forecast by Professional Services, 2018 to 2033
Table 77: Middle East and Africa Market Value (US$ Million) Forecast by Pixel Density, 2018 to 2033
Table 78: Middle East and Africa Market Volume (Units) Forecast by Pixel Density, 2018 to 2033
Table 79: Middle East and Africa Market Value (US$ Million) Forecast by Application, 2018 to 2033
Table 80: Middle East and Africa Market Volume (Units) Forecast by Application, 2018 to 2033
Figure 1: Global Market Value (US$ Million) by Camera Type, 2023 to 2033
Figure 2: Global Market Value (US$ Million) by Professional Services, 2023 to 2033
Figure 3: Global Market Value (US$ Million) by Pixel Density, 2023 to 2033
Figure 4: Global Market Value (US$ Million) by Application, 2023 to 2033
Figure 5: Global Market Value (US$ Million) by Region, 2023 to 2033
Figure 6: Global Market Value (US$ Million) Analysis by Region, 2018 to 2033
Figure 7: Global Market Volume (Units) Analysis by Region, 2018 to 2033
Figure 8: Global Market Value Share (%) and BPS Analysis by Region, 2023 to 2033
Figure 9: Global Market Y-o-Y Growth (%) Projections by Region, 2023 to 2033
Figure 10: Global Market Value (US$ Million) Analysis by Camera Type, 2018 to 2033
Figure 11: Global Market Volume (Units) Analysis by Camera Type, 2018 to 2033
Figure 12: Global Market Value Share (%) and BPS Analysis by Camera Type, 2023 to 2033
Figure 13: Global Market Y-o-Y Growth (%) Projections by Camera Type, 2023 to 2033
Figure 14: Global Market Value (US$ Million) Analysis by Professional Services, 2018 to 2033
Figure 15: Global Market Volume (Units) Analysis by Professional Services, 2018 to 2033
Figure 16: Global Market Value Share (%) and BPS Analysis by Professional Services, 2023 to 2033
Figure 17: Global Market Y-o-Y Growth (%) Projections by Professional Services, 2023 to 2033
Figure 18: Global Market Value (US$ Million) Analysis by Pixel Density, 2018 to 2033
Figure 19: Global Market Volume (Units) Analysis by Pixel Density, 2018 to 2033
Figure 20: Global Market Value Share (%) and BPS Analysis by Pixel Density, 2023 to 2033
Figure 21: Global Market Y-o-Y Growth (%) Projections by Pixel Density, 2023 to 2033
Figure 22: Global Market Value (US$ Million) Analysis by Application, 2018 to 2033
Figure 23: Global Market Volume (Units) Analysis by Application, 2018 to 2033
Figure 24: Global Market Value Share (%) and BPS Analysis by Application, 2023 to 2033
Figure 25: Global Market Y-o-Y Growth (%) Projections by Application, 2023 to 2033
Figure 26: Global Market Attractiveness by Camera Type, 2023 to 2033
Figure 27: Global Market Attractiveness by Professional Services, 2023 to 2033
Figure 28: Global Market Attractiveness by Pixel Density, 2023 to 2033
Figure 29: Global Market Attractiveness by Application, 2023 to 2033
Figure 30: Global Market Attractiveness by Region, 2023 to 2033
Figure 31: North America Market Value (US$ Million) by Camera Type, 2023 to 2033
Figure 32: North America Market Value (US$ Million) by Professional Services, 2023 to 2033
Figure 33: North America Market Value (US$ Million) by Pixel Density, 2023 to 2033
Figure 34: North America Market Value (US$ Million) by Application, 2023 to 2033
Figure 35: North America Market Value (US$ Million) by Country, 2023 to 2033
Figure 36: North America Market Value (US$ Million) Analysis by Country, 2018 to 2033
Figure 37: North America Market Volume (Units) Analysis by Country, 2018 to 2033
Figure 38: North America Market Value Share (%) and BPS Analysis by Country, 2023 to 2033
Figure 39: North America Market Y-o-Y Growth (%) Projections by Country, 2023 to 2033
Figure 40: North America Market Value (US$ Million) Analysis by Camera Type, 2018 to 2033
Figure 41: North America Market Volume (Units) Analysis by Camera Type, 2018 to 2033
Figure 42: North America Market Value Share (%) and BPS Analysis by Camera Type, 2023 to 2033
Figure 43: North America Market Y-o-Y Growth (%) Projections by Camera Type, 2023 to 2033
Figure 44: North America Market Value (US$ Million) Analysis by Professional Services, 2018 to 2033
Figure 45: North America Market Volume (Units) Analysis by Professional Services, 2018 to 2033
Figure 46: North America Market Value Share (%) and BPS Analysis by Professional Services, 2023 to 2033
Figure 47: North America Market Y-o-Y Growth (%) Projections by Professional Services, 2023 to 2033
Figure 48: North America Market Value (US$ Million) Analysis by Pixel Density, 2018 to 2033
Figure 49: North America Market Volume (Units) Analysis by Pixel Density, 2018 to 2033
Figure 50: North America Market Value Share (%) and BPS Analysis by Pixel Density, 2023 to 2033
Figure 51: North America Market Y-o-Y Growth (%) Projections by Pixel Density, 2023 to 2033
Figure 52: North America Market Value (US$ Million) Analysis by Application, 2018 to 2033
Figure 53: North America Market Volume (Units) Analysis by Application, 2018 to 2033
Figure 54: North America Market Value Share (%) and BPS Analysis by Application, 2023 to 2033
Figure 55: North America Market Y-o-Y Growth (%) Projections by Application, 2023 to 2033
Figure 56: North America Market Attractiveness by Camera Type, 2023 to 2033
Figure 57: North America Market Attractiveness by Professional Services, 2023 to 2033
Figure 58: North America Market Attractiveness by Pixel Density, 2023 to 2033
Figure 59: North America Market Attractiveness by Application, 2023 to 2033
Figure 60: North America Market Attractiveness by Country, 2023 to 2033
Figure 61: Latin America Market Value (US$ Million) by Camera Type, 2023 to 2033
Figure 62: Latin America Market Value (US$ Million) by Professional Services, 2023 to 2033
Figure 63: Latin America Market Value (US$ Million) by Pixel Density, 2023 to 2033
Figure 64: Latin America Market Value (US$ Million) by Application, 2023 to 2033
Figure 65: Latin America Market Value (US$ Million) by Country, 2023 to 2033
Figure 66: Latin America Market Value (US$ Million) Analysis by Country, 2018 to 2033
Figure 67: Latin America Market Volume (Units) Analysis by Country, 2018 to 2033
Figure 68: Latin America Market Value Share (%) and BPS Analysis by Country, 2023 to 2033
Figure 69: Latin America Market Y-o-Y Growth (%) Projections by Country, 2023 to 2033
Figure 70: Latin America Market Value (US$ Million) Analysis by Camera Type, 2018 to 2033
Figure 71: Latin America Market Volume (Units) Analysis by Camera Type, 2018 to 2033
Figure 72: Latin America Market Value Share (%) and BPS Analysis by Camera Type, 2023 to 2033
Figure 73: Latin America Market Y-o-Y Growth (%) Projections by Camera Type, 2023 to 2033
Figure 74: Latin America Market Value (US$ Million) Analysis by Professional Services, 2018 to 2033
Figure 75: Latin America Market Volume (Units) Analysis by Professional Services, 2018 to 2033
Figure 76: Latin America Market Value Share (%) and BPS Analysis by Professional Services, 2023 to 2033
Figure 77: Latin America Market Y-o-Y Growth (%) Projections by Professional Services, 2023 to 2033
Figure 78: Latin America Market Value (US$ Million) Analysis by Pixel Density, 2018 to 2033
Figure 79: Latin America Market Volume (Units) Analysis by Pixel Density, 2018 to 2033
Figure 80: Latin America Market Value Share (%) and BPS Analysis by Pixel Density, 2023 to 2033
Figure 81: Latin America Market Y-o-Y Growth (%) Projections by Pixel Density, 2023 to 2033
Figure 82: Latin America Market Value (US$ Million) Analysis by Application, 2018 to 2033
Figure 83: Latin America Market Volume (Units) Analysis by Application, 2018 to 2033
Figure 84: Latin America Market Value Share (%) and BPS Analysis by Application, 2023 to 2033
Figure 85: Latin America Market Y-o-Y Growth (%) Projections by Application, 2023 to 2033
Figure 86: Latin America Market Attractiveness by Camera Type, 2023 to 2033
Figure 87: Latin America Market Attractiveness by Professional Services, 2023 to 2033
Figure 88: Latin America Market Attractiveness by Pixel Density, 2023 to 2033
Figure 89: Latin America Market Attractiveness by Application, 2023 to 2033
Figure 90: Latin America Market Attractiveness by Country, 2023 to 2033
Figure 91: Western Europe Market Value (US$ Million) by Camera Type, 2023 to 2033
Figure 92: Western Europe Market Value (US$ Million) by Professional Services, 2023 to 2033
Figure 93: Western Europe Market Value (US$ Million) by Pixel Density, 2023 to 2033
Figure 94: Western Europe Market Value (US$ Million) by Application, 2023 to 2033
Figure 95: Western Europe Market Value (US$ Million) by Country, 2023 to 2033
Figure 96: Western Europe Market Value (US$ Million) Analysis by Country, 2018 to 2033
Figure 97: Western Europe Market Volume (Units) Analysis by Country, 2018 to 2033
Figure 98: Western Europe Market Value Share (%) and BPS Analysis by Country, 2023 to 2033
Figure 99: Western Europe Market Y-o-Y Growth (%) Projections by Country, 2023 to 2033
Figure 100: Western Europe Market Value (US$ Million) Analysis by Camera Type, 2018 to 2033
Figure 101: Western Europe Market Volume (Units) Analysis by Camera Type, 2018 to 2033
Figure 102: Western Europe Market Value Share (%) and BPS Analysis by Camera Type, 2023 to 2033
Figure 103: Western Europe Market Y-o-Y Growth (%) Projections by Camera Type, 2023 to 2033
Figure 104: Western Europe Market Value (US$ Million) Analysis by Professional Services, 2018 to 2033
Figure 105: Western Europe Market Volume (Units) Analysis by Professional Services, 2018 to 2033
Figure 106: Western Europe Market Value Share (%) and BPS Analysis by Professional Services, 2023 to 2033
Figure 107: Western Europe Market Y-o-Y Growth (%) Projections by Professional Services, 2023 to 2033
Figure 108: Western Europe Market Value (US$ Million) Analysis by Pixel Density, 2018 to 2033
Figure 109: Western Europe Market Volume (Units) Analysis by Pixel Density, 2018 to 2033
Figure 110: Western Europe Market Value Share (%) and BPS Analysis by Pixel Density, 2023 to 2033
Figure 111: Western Europe Market Y-o-Y Growth (%) Projections by Pixel Density, 2023 to 2033
Figure 112: Western Europe Market Value (US$ Million) Analysis by Application, 2018 to 2033
Figure 113: Western Europe Market Volume (Units) Analysis by Application, 2018 to 2033
Figure 114: Western Europe Market Value Share (%) and BPS Analysis by Application, 2023 to 2033
Figure 115: Western Europe Market Y-o-Y Growth (%) Projections by Application, 2023 to 2033
Figure 116: Western Europe Market Attractiveness by Camera Type, 2023 to 2033
Figure 117: Western Europe Market Attractiveness by Professional Services, 2023 to 2033
Figure 118: Western Europe Market Attractiveness by Pixel Density, 2023 to 2033
Figure 119: Western Europe Market Attractiveness by Application, 2023 to 2033
Figure 120: Western Europe Market Attractiveness by Country, 2023 to 2033
Figure 121: Eastern Europe Market Value (US$ Million) by Camera Type, 2023 to 2033
Figure 122: Eastern Europe Market Value (US$ Million) by Professional Services, 2023 to 2033
Figure 123: Eastern Europe Market Value (US$ Million) by Pixel Density, 2023 to 2033
Figure 124: Eastern Europe Market Value (US$ Million) by Application, 2023 to 2033
Figure 125: Eastern Europe Market Value (US$ Million) by Country, 2023 to 2033
Figure 126: Eastern Europe Market Value (US$ Million) Analysis by Country, 2018 to 2033
Figure 127: Eastern Europe Market Volume (Units) Analysis by Country, 2018 to 2033
Figure 128: Eastern Europe Market Value Share (%) and BPS Analysis by Country, 2023 to 2033
Figure 129: Eastern Europe Market Y-o-Y Growth (%) Projections by Country, 2023 to 2033
Figure 130: Eastern Europe Market Value (US$ Million) Analysis by Camera Type, 2018 to 2033
Figure 131: Eastern Europe Market Volume (Units) Analysis by Camera Type, 2018 to 2033
Figure 132: Eastern Europe Market Value Share (%) and BPS Analysis by Camera Type, 2023 to 2033
Figure 133: Eastern Europe Market Y-o-Y Growth (%) Projections by Camera Type, 2023 to 2033
Figure 134: Eastern Europe Market Value (US$ Million) Analysis by Professional Services, 2018 to 2033
Figure 135: Eastern Europe Market Volume (Units) Analysis by Professional Services, 2018 to 2033
Figure 136: Eastern Europe Market Value Share (%) and BPS Analysis by Professional Services, 2023 to 2033
Figure 137: Eastern Europe Market Y-o-Y Growth (%) Projections by Professional Services, 2023 to 2033
Figure 138: Eastern Europe Market Value (US$ Million) Analysis by Pixel Density, 2018 to 2033
Figure 139: Eastern Europe Market Volume (Units) Analysis by Pixel Density, 2018 to 2033
Figure 140: Eastern Europe Market Value Share (%) and BPS Analysis by Pixel Density, 2023 to 2033
Figure 141: Eastern Europe Market Y-o-Y Growth (%) Projections by Pixel Density, 2023 to 2033
Figure 142: Eastern Europe Market Value (US$ Million) Analysis by Application, 2018 to 2033
Figure 143: Eastern Europe Market Volume (Units) Analysis by Application, 2018 to 2033
Figure 144: Eastern Europe Market Value Share (%) and BPS Analysis by Application, 2023 to 2033
Figure 145: Eastern Europe Market Y-o-Y Growth (%) Projections by Application, 2023 to 2033
Figure 146: Eastern Europe Market Attractiveness by Camera Type, 2023 to 2033
Figure 147: Eastern Europe Market Attractiveness by Professional Services, 2023 to 2033
Figure 148: Eastern Europe Market Attractiveness by Pixel Density, 2023 to 2033
Figure 149: Eastern Europe Market Attractiveness by Application, 2023 to 2033
Figure 150: Eastern Europe Market Attractiveness by Country, 2023 to 2033
Figure 151: South Asia and Pacific Market Value (US$ Million) by Camera Type, 2023 to 2033
Figure 152: South Asia and Pacific Market Value (US$ Million) by Professional Services, 2023 to 2033
Figure 153: South Asia and Pacific Market Value (US$ Million) by Pixel Density, 2023 to 2033
Figure 154: South Asia and Pacific Market Value (US$ Million) by Application, 2023 to 2033
Figure 155: South Asia and Pacific Market Value (US$ Million) by Country, 2023 to 2033
Figure 156: South Asia and Pacific Market Value (US$ Million) Analysis by Country, 2018 to 2033
Figure 157: South Asia and Pacific Market Volume (Units) Analysis by Country, 2018 to 2033
Figure 158: South Asia and Pacific Market Value Share (%) and BPS Analysis by Country, 2023 to 2033
Figure 159: South Asia and Pacific Market Y-o-Y Growth (%) Projections by Country, 2023 to 2033
Figure 160: South Asia and Pacific Market Value (US$ Million) Analysis by Camera Type, 2018 to 2033
Figure 161: South Asia and Pacific Market Volume (Units) Analysis by Camera Type, 2018 to 2033
Figure 162: South Asia and Pacific Market Value Share (%) and BPS Analysis by Camera Type, 2023 to 2033
Figure 163: South Asia and Pacific Market Y-o-Y Growth (%) Projections by Camera Type, 2023 to 2033
Figure 164: South Asia and Pacific Market Value (US$ Million) Analysis by Professional Services, 2018 to 2033
Figure 165: South Asia and Pacific Market Volume (Units) Analysis by Professional Services, 2018 to 2033
Figure 166: South Asia and Pacific Market Value Share (%) and BPS Analysis by Professional Services, 2023 to 2033
Figure 167: South Asia and Pacific Market Y-o-Y Growth (%) Projections by Professional Services, 2023 to 2033
Figure 168: South Asia and Pacific Market Value (US$ Million) Analysis by Pixel Density, 2018 to 2033
Figure 169: South Asia and Pacific Market Volume (Units) Analysis by Pixel Density, 2018 to 2033
Figure 170: South Asia and Pacific Market Value Share (%) and BPS Analysis by Pixel Density, 2023 to 2033
Figure 171: South Asia and Pacific Market Y-o-Y Growth (%) Projections by Pixel Density, 2023 to 2033
Figure 172: South Asia and Pacific Market Value (US$ Million) Analysis by Application, 2018 to 2033
Figure 173: South Asia and Pacific Market Volume (Units) Analysis by Application, 2018 to 2033
Figure 174: South Asia and Pacific Market Value Share (%) and BPS Analysis by Application, 2023 to 2033
Figure 175: South Asia and Pacific Market Y-o-Y Growth (%) Projections by Application, 2023 to 2033
Figure 176: South Asia and Pacific Market Attractiveness by Camera Type, 2023 to 2033
Figure 177: South Asia and Pacific Market Attractiveness by Professional Services, 2023 to 2033
Figure 178: South Asia and Pacific Market Attractiveness by Pixel Density, 2023 to 2033
Figure 179: South Asia and Pacific Market Attractiveness by Application, 2023 to 2033
Figure 180: South Asia and Pacific Market Attractiveness by Country, 2023 to 2033
Figure 181: East Asia Market Value (US$ Million) by Camera Type, 2023 to 2033
Figure 182: East Asia Market Value (US$ Million) by Professional Services, 2023 to 2033
Figure 183: East Asia Market Value (US$ Million) by Pixel Density, 2023 to 2033
Figure 184: East Asia Market Value (US$ Million) by Application, 2023 to 2033
Figure 185: East Asia Market Value (US$ Million) by Country, 2023 to 2033
Figure 186: East Asia Market Value (US$ Million) Analysis by Country, 2018 to 2033
Figure 187: East Asia Market Volume (Units) Analysis by Country, 2018 to 2033
Figure 188: East Asia Market Value Share (%) and BPS Analysis by Country, 2023 to 2033
Figure 189: East Asia Market Y-o-Y Growth (%) Projections by Country, 2023 to 2033
Figure 190: East Asia Market Value (US$ Million) Analysis by Camera Type, 2018 to 2033
Figure 191: East Asia Market Volume (Units) Analysis by Camera Type, 2018 to 2033
Figure 192: East Asia Market Value Share (%) and BPS Analysis by Camera Type, 2023 to 2033
Figure 193: East Asia Market Y-o-Y Growth (%) Projections by Camera Type, 2023 to 2033
Figure 194: East Asia Market Value (US$ Million) Analysis by Professional Services, 2018 to 2033
Figure 195: East Asia Market Volume (Units) Analysis by Professional Services, 2018 to 2033
Figure 196: East Asia Market Value Share (%) and BPS Analysis by Professional Services, 2023 to 2033
Figure 197: East Asia Market Y-o-Y Growth (%) Projections by Professional Services, 2023 to 2033
Figure 198: East Asia Market Value (US$ Million) Analysis by Pixel Density, 2018 to 2033
Figure 199: East Asia Market Volume (Units) Analysis by Pixel Density, 2018 to 2033
Figure 200: East Asia Market Value Share (%) and BPS Analysis by Pixel Density, 2023 to 2033
Figure 201: East Asia Market Y-o-Y Growth (%) Projections by Pixel Density, 2023 to 2033
Figure 202: East Asia Market Value (US$ Million) Analysis by Application, 2018 to 2033
Figure 203: East Asia Market Volume (Units) Analysis by Application, 2018 to 2033
Figure 204: East Asia Market Value Share (%) and BPS Analysis by Application, 2023 to 2033
Figure 205: East Asia Market Y-o-Y Growth (%) Projections by Application, 2023 to 2033
Figure 206: East Asia Market Attractiveness by Camera Type, 2023 to 2033
Figure 207: East Asia Market Attractiveness by Professional Services, 2023 to 2033
Figure 208: East Asia Market Attractiveness by Pixel Density, 2023 to 2033
Figure 209: East Asia Market Attractiveness by Application, 2023 to 2033
Figure 210: East Asia Market Attractiveness by Country, 2023 to 2033
Figure 211: Middle East and Africa Market Value (US$ Million) by Camera Type, 2023 to 2033
Figure 212: Middle East and Africa Market Value (US$ Million) by Professional Services, 2023 to 2033
Figure 213: Middle East and Africa Market Value (US$ Million) by Pixel Density, 2023 to 2033
Figure 214: Middle East and Africa Market Value (US$ Million) by Application, 2023 to 2033
Figure 215: Middle East and Africa Market Value (US$ Million) by Country, 2023 to 2033
Figure 216: Middle East and Africa Market Value (US$ Million) Analysis by Country, 2018 to 2033
Figure 217: Middle East and Africa Market Volume (Units) Analysis by Country, 2018 to 2033
Figure 218: Middle East and Africa Market Value Share (%) and BPS Analysis by Country, 2023 to 2033
Figure 219: Middle East and Africa Market Y-o-Y Growth (%) Projections by Country, 2023 to 2033
Figure 220: Middle East and Africa Market Value (US$ Million) Analysis by Camera Type, 2018 to 2033
Figure 221: Middle East and Africa Market Volume (Units) Analysis by Camera Type, 2018 to 2033
Figure 222: Middle East and Africa Market Value Share (%) and BPS Analysis by Camera Type, 2023 to 2033
Figure 223: Middle East and Africa Market Y-o-Y Growth (%) Projections by Camera Type, 2023 to 2033
Figure 224: Middle East and Africa Market Value (US$ Million) Analysis by Professional Services, 2018 to 2033
Figure 225: Middle East and Africa Market Volume (Units) Analysis by Professional Services, 2018 to 2033
Figure 226: Middle East and Africa Market Value Share (%) and BPS Analysis by Professional Services, 2023 to 2033
Figure 227: Middle East and Africa Market Y-o-Y Growth (%) Projections by Professional Services, 2023 to 2033
Figure 228: Middle East and Africa Market Value (US$ Million) Analysis by Pixel Density, 2018 to 2033
Figure 229: Middle East and Africa Market Volume (Units) Analysis by Pixel Density, 2018 to 2033
Figure 230: Middle East and Africa Market Value Share (%) and BPS Analysis by Pixel Density, 2023 to 2033
Figure 231: Middle East and Africa Market Y-o-Y Growth (%) Projections by Pixel Density, 2023 to 2033
Figure 232: Middle East and Africa Market Value (US$ Million) Analysis by Application, 2018 to 2033
Figure 233: Middle East and Africa Market Volume (Units) Analysis by Application, 2018 to 2033
Figure 234: Middle East and Africa Market Value Share (%) and BPS Analysis by Application, 2023 to 2033
Figure 235: Middle East and Africa Market Y-o-Y Growth (%) Projections by Application, 2023 to 2033
Figure 236: Middle East and Africa Market Attractiveness by Camera Type, 2023 to 2033
Figure 237: Middle East and Africa Market Attractiveness by Professional Services, 2023 to 2033
Figure 238: Middle East and Africa Market Attractiveness by Pixel Density, 2023 to 2033
Figure 239: Middle East and Africa Market Attractiveness by Application, 2023 to 2033
Figure 240: Middle East and Africa Market Attractiveness by Country, 2023 to 2033
The CMOS camera market is set to attain a value of USD 5.5 billion in 2023.
The CMOS camera market is estimated to surpass USD 15.6 billion by 2033.
The CMOS camera market is projected to experience a CAGR of 11% through 2033.
North America, boasting a 45% global revenue share in 2022, emerges as a region with significant revenue opportunities for CMOS cameras.
Key CMOS camera market players are Canon Inc., Imperx Inc., Teledyne Technologies, Samsung, Hamamatsu Photonics, Sony Corporation, Toshiba Corporation, and others.
Explore Similar Insights
Thank you!
You will receive an email from our Business Development Manager. Please be sure to check your SPAM/JUNK folder too.