Unconcentrated Orange Juice Market Size and Share Forecast Outlook 2025 to 2035

Global demand for unconcentrated orange juice was valued at USD 5.4 billion in 2025 and is forecast to reach USD 9.7 billion by 2035, growing at a 6% CAGR.
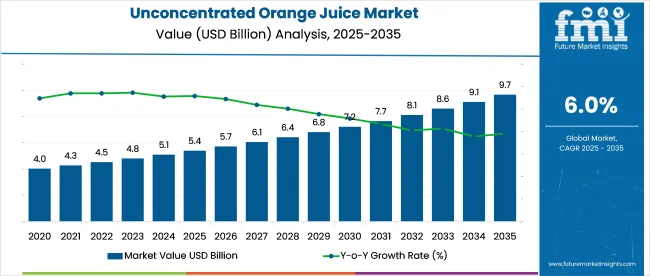
Quick Stats of the Unconcentrated Orange Juice Market

  • Industry Size (2025): USD 5.4 billion
  • Industry Value (2035): USD 9.7 billion
  • Forecast CAGR (2025 to 2035): 6%
  • Leading Segment: Direct Consumption (64.5%)
  • Key Growth Region: Asia Pacific (China)
  • Key Players: The Coca-Cola Company, PepsiCo Inc., Citrosuco, SucocitricoCutrale, Louis Dreyfus Company

Unconcentrated Orange Juice Market

It is argued that bottlers investing in high-pressure processing, aseptic PET, and blockchain-based provenance will capture retailer shelf space and defend margin. Competitive intensity is expected to rise as private-label chains integrate vertical squeezing facilities, leaving mid-tier exporters vulnerable unless direct-sourcing contracts are negotiated with growers.

In January 2024, Monica McGurk, CEO of Tropicana Brands Group, emphasized the company’s ongoing commitment to providing high-quality, natural orange juice, stating, “Our limited-edition run of 'Tropcn' orange juice bottles represents our ongoing commitment to delivering the highest quality 100% orange juice to Americans.”

This statement was made during the introduction of Tropicana’s “Tropcn” packaging at CES 2024, designed to showcase the brand’s focus on purity and authenticity. By removing the letters "AI" from its branding, Tropicana reinforced its message that its product contains no artificial ingredients, reflecting its dedication to transparency in the industry.

The industry holds a specialized share within its parent markets. In the fruit juice market, it accounts for approximately 10-12%, as orange juice is one of the most consumed fruit juices globally. Within the broader beverages market, its share is around 3-5%, given the large variety of both alcoholic and non-alcoholic drinks. In the organic food and beverages market, unconcentrated orange juice contributes about 2-3%, particularly as organic variants gain popularity among health-conscious consumers.

Within the packaged food market, its share is around 2-4%, reflecting the widespread availability of prepackaged juices. In the healthy and functional beverages market, the share is approximately 5-7%, as orange juice is often advertised for its health benefits, particularly its high vitamin C content.

Analyzing Unconcentrated Orange Juice Market by Top Investment Segments

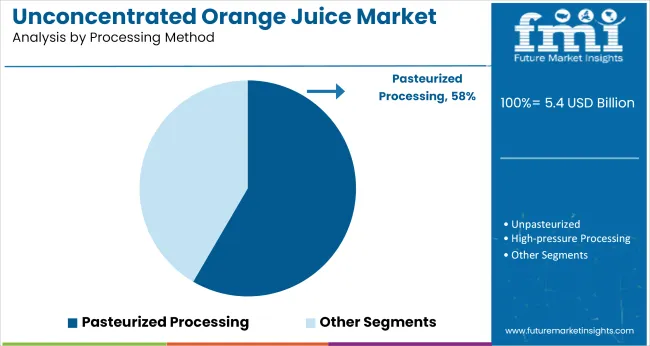
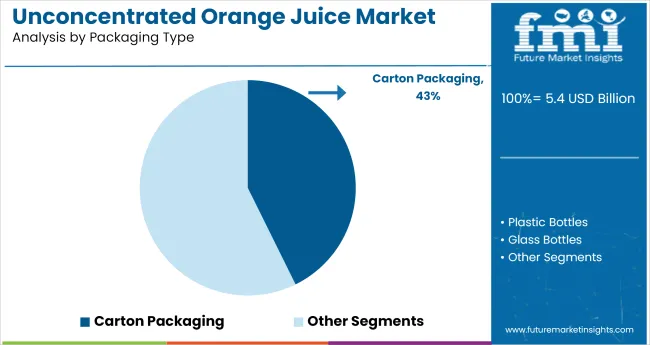
The industry is set to grow with NFC products leading the way at 46.3% industry share in 2025. Pasteurized processing will dominate at 58.4%, carton packaging will capture 42.7%, and supermarkets/hypermarkets will be the primary distribution channel with 51.2% share.
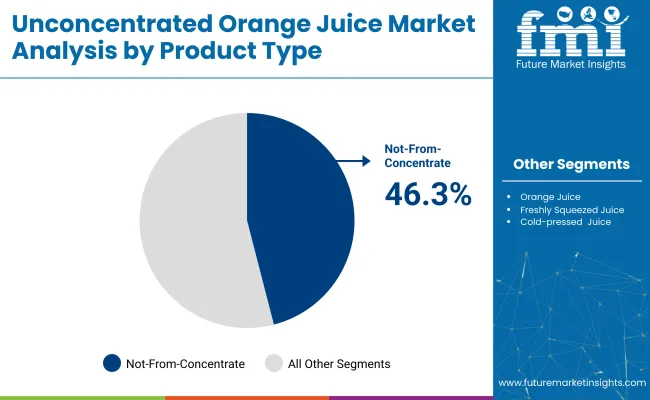
Not-From-Concentrate (NFC) orange juice leads product type with 46.3% industry share

Unconcentrated Orange Juice Market Analysis By Product Type

NFC orange juice is expected to dominate the industry, holding 46.3% of the share in 2025. It is preferred for its natural taste, aroma, and nutritional content, particularly among health-conscious consumers. Freshly squeezed and cold-pressed variants are seeing rising demand in premium and organic categories. NFC’s clean-label and unprocessed appeal makes it popular in both retail and foodservice sectors. Increasing demand from cafes and organic specialty stores further supports this trend. The ongoing premiumization of beverages is also expected to sustain the demand for NFC orange juice across global industries.
  • NFC retains natural flavor and nutrients, appealing to health-conscious consumers
  • Freshly squeezed and cold-pressed variants gaining traction in premium and organic categories
  • Premiumization trend in beverages continues to drive NFC industry growth globally

Pasteurized processing method remains widely used with 58.4% industry share

Unconcentrated Orange Juice Market Analysis By Processing Method

Pasteurized orange juice is projected to hold 58.4% of the industry share in 2025. This method remains the most common due to its ability to ensure microbiological safety and extend product shelf life, making it suitable for mass-market and specialty juice products. High-pressure processing (HPP) and pulsed electric field (PEF) techniques are increasingly being used in premium and organic juices for better flavor and nutrient retention, but pasteurization still dominates due to its scalability and cost-effectiveness. Pasteurized juice remains the industry standard for large-scale operations and supermarkets.
  • Pasteurization ensures microbiological safety and extends shelf life for mass-market and specialty juices
  • HPP and PEF techniques growing in premium and organic juice sectors for better flavor retention
  • Pasteurization’s scalability and cost-effectiveness make it ideal for commercial production

Carton packaging leads packaging type with 42.7% industry share

Unconcentrated Orange Juice Market Analysis By Packaging Type

Carton packaging is expected to lead the packaging segment, capturing 42.7% of the industry share in 2025. The demand for cartons is driven by the growing consumer preference for sustainable and recyclable materials. Carton packaging, such as Tetra Pak and Pure-Pak, is lightweight, cost-effective, and provides excellent protection for orange juice.

While plastic bottles (PET and HDPE) remain popular for their convenience and portability, and glass bottles serve the premium segment, cartons are increasingly favored for their eco-friendly appeal. This trend is influencing major beverage manufacturers to adopt carton packaging worldwide.
  • Cartons are lightweight, cost-effective, and provide excellent product protection
  • Growing consumer demand for recyclable and sustainable packaging boosts carton usage
  • Eco-friendly appeal of carton packaging drives adoption by major beverage manufacturers

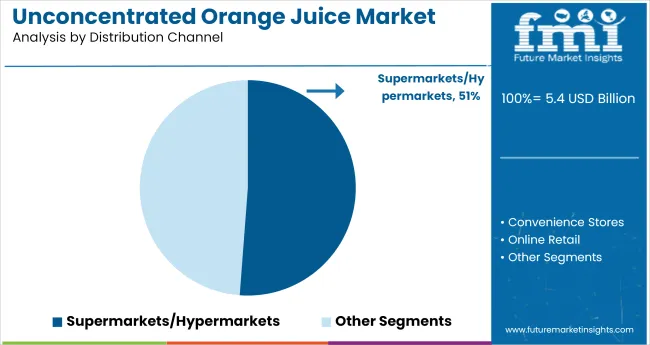
Supermarkets & hypermarkets lead distribution channel with 51.2% industry share

Unconcentrated Orange Juice Market Analysis By Distribution Channel

Supermarkets and hypermarkets are projected to hold 51.2% of the distribution channel industry share in 2025. These retail giants offer a broad selection of the products, competitive pricing, and frequent promotions, making them the preferred choice for consumers. Convenience stores are also significant, particularly in urban areas where accessibility is key.

The growing popularity of online retail platforms and health-focused beverage subscriptions is contributing to rapid growth in e-commerce. The foodservice and HoReCa sectors remain important contributors due to the high demand for fresh, high-quality orange juice in cafes and restaurants.
  • Supermarkets and hypermarkets offer broad product variety and competitive pricing
  • Convenience stores play a key role, particularly in urban areas for easy access
  • E-commerce growth and foodservice demand contribute to expanding distribution channels

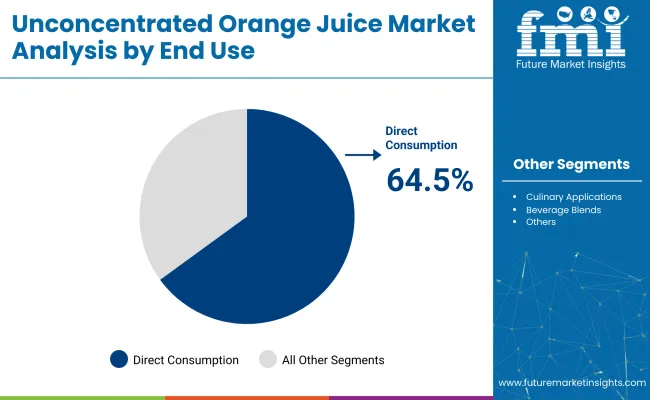
Direct consumption drives end-use segment with 64.5% industry share

Unconcentrated Orange Juice Market Analysis By End User

Direct consumption is expected to dominate the end-use segment, capturing 64.5% of the industry share in 2025. The orange juice is a popular choice as a health drink or breakfast staple due to its natural flavor and high nutrient content. The growing trend of beverage blends, such as smoothies and energy drinks, is also utilizing NFC and cold-pressed juices for better taste and functionality.

While culinary applications like sauces and marinades are growing, they represent a smaller industry segment. The focus on functional beverages incorporating orange juice for its vitamin C content further supports direct consumption as the largest revenue contributor.

  • Direct consumption continues to be the leading end-use, with rising demand for health-focused drinks
  • Beverage blends like smoothies and energy drinks drive additional consumption
  • Functional beverages incorporating vitamin C content expand the industry for direct consumption

Top Unconcentrated Orange Juice Market Dynamics

The industry is growing due to rising demand for fresh, nutrient-rich beverages. Challenges such as supply chain disruptions, crop diseases, and price volatility for juice-grade oranges are impacting availability and pricing, prompting producers to enhance resilience.

Increasing Demand for Fresh and Nutrient-Rich Beverage Options

The industry is growing due to increasing consumer preference for fresh, "not from concentrate" juices. Consumers are drawn to the natural taste, vitamin C, and immune-boosting benefits of these juices. Registered dietitians promote the health advantages of vitamin C, potassium, and phytonutrients found in 100% orange juice. Fresh-squeezed options are favored for vitamin retention, while innovations in packaging help preserve flavor. At-home consumption for culinary uses like marinades and dressings is on the rise, with food-service operators incorporating unconcentrated juice into their offerings.

  • Consumer preference is shifting towards fresh, nutrient-rich, and "not from concentrate" orange juice.
  • Health benefits like vitamin C and immune support are major drivers for juice consumption.
  • Packaging innovations and culinary uses are expanding unconcentrated juice's popularity.

Supply Chain Disruptions and Commodity Price Volatility Impact Availability

The industry faces challenges due to supply chain disruptions caused by crop diseases and weather-related events. Issues like citrus greening disease and hurricanes in Florida and Brazil have resulted in significant supply shortages, affecting production schedules and retail pricing. Volatile prices for juice-grade oranges impact overall industry stability. In response, producers are adjusting sourcing strategies, blending varieties, and investing in cold storage and juicing capacity to enhance supply chain resilience and reduce the impact of these disruptions.
  • Crop diseases and weather events, like citrus greening and hurricanes, disrupt supply.
  • Price instability for juice-grade oranges affects production schedules and retail prices.
  • Producers are investing in cold storage and sourcing strategies to enhance supply chain resilience.

Top Countries Formulating, Supplying, and Consuming Unconcentrated Orange Juice

Country Wise Analysis Of Unconcentrated Orange Juice Market

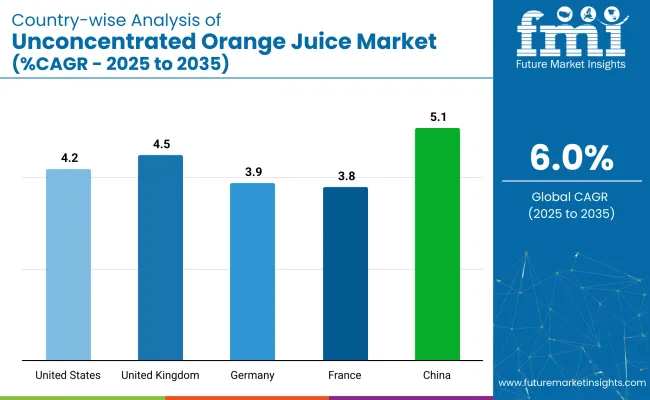
Countries CAGR (2025 to 2035)
United States 4.2%
United Kingdom 4.5%
Germany 3.9%
France 3.8%
China 5.1%

Global Industry demand is projected to rise at a 6% CAGR from 2025 to 2035. Of the five profiled countries out of 40 covered, China leads at 5.1%, followed by the United States at 4.2%, and the United Kingdom at 4.5%, while Germany posts 3.9% and France records 3.8%.

These rates translate to a growth premium of -15% for China, -30% for the United States, and -32% for the United Kingdom versus the baseline, while Germany and France trail with more moderate growth. Divergence reflects local catalysts: growing demand for fresh and health-focused beverages in China, while mature markets in Europe and the USA show slower growth due to industry saturation and shifting consumer preferences towards newer beverage trends.

United States Unconcentrated Orange Juice Market Analysis

The sales in the United States are forecast to grow at a CAGR of 4.2% from 2025 to 2035. This growth aligns with evolving consumer preferences for natural, clean-label beverages with minimal processing. Strong demand originates from the breakfast category, reinforced by innovations in cold-pressed and organic variants that appeal to wellness-conscious shoppers. National brands continue to launch fortified juices enriched with vitamin D and antioxidants to capture demand in health-focused retail channels.

  • Direct-to-consumer services and digital grocery platforms boost volume among millennial and Gen Z buyers.
  • Cold-pressed juice adoption expands in fitness studios and urban cafes, lifting regional penetration.
  • Functional juice blends with turmeric or probiotics gain shelf space in natural food chains.

United Kingdom Unconcentrated Orange Juice Industry Growth

The demand in the United Kingdom is estimated to grow at a CAGR of 4.5% between 2025 and 2035. Consumer preference for low-sugar, natural beverages is driving consistent demand across supermarkets, health-food chains, and subscription models. Sustainability messaging-centered on recyclable packaging and emissions reduction-reinforces buyer trust. Retailers categorize not-from-concentrate juice alongside functional drinks and whole-food snacks.

  • Private-label juice ranges emphasize single-origin oranges and transparent labeling.
  • Public health campaigns reinforce reduced sugar consumption, favoring pure juice offerings.
  • Retail merchandising strategies pair NFC juices with immunity-boosting supplements.

Germany Unconcentrated Orange Juice Market Analysis

The industry in Germany is set to record a CAGR of 3.9% from 2025 to 2035. A preference for organic and authentic food options underpins juice segment expansion. Bio-focused grocery outlets and organic retail chains offer cold-pressed orange juices sourced through eco-certified supply chains. Consumer advocacy for sugar-free beverages contributes to low-acid, unfiltered product innovations.

  • National nutrition guidelines promote unfortified, naturally sweet juices for balanced breakfast routines.
  • Premium pricing strategies support the proliferation of glass-bottled, traceable orange juice SKUs.
  • Clean-label certification influences category performance in natural and wellness stores.

France Unconcentrated Orange Juice Market Analysis

The industry in France is projected to expand at a CAGR of 3.8% from 2025 to 2035. Fresh juice aligns with France’s gastronomic preferences, particularly among cafes, hotels, and upscale grocers. Minimal processing, no added sugar, and transparent sourcing are valued by consumers, particularly in metropolitan regions. Government-endorsed health frameworks encourage natural beverage consumption to reduce lifestyle-related disorders.

  • On-premise demand grows in independent bakeries and boutique foodservice chains.
  • Nutritional education campaigns support pure juice inclusion in children’s meal options.
  • Regional brands offer seasonal orange blends with traceability to EU-certified farms.

China Unconcentrated Orange Juice Market Trends

The demand in China is expected to grow at a CAGR of 5.1% from 2025 to 2035. Rising income levels, combined with consumer interest in wellness, are driving NFC juice sales across modern trade and e-commerce platforms. Cold-chain expansion allows fresh juice delivery in tier-one and tier-two cities. Local and international brands emphasize zero additives, sugar reduction, and quality assurance certifications.
  • Cold-pressed NFC juices see heightened traction in premium convenience and travel retail.
  • Health-focused campaigns position orange juice as a daily vitamin C source.
  • Importers promote traceable origin from Spain, Florida, and Brazil for high-end retail positioning.

Leading Unconcentrated Orange Juice Market Suppliers

Unconcentrated Orange Juice Market Analysis By Company

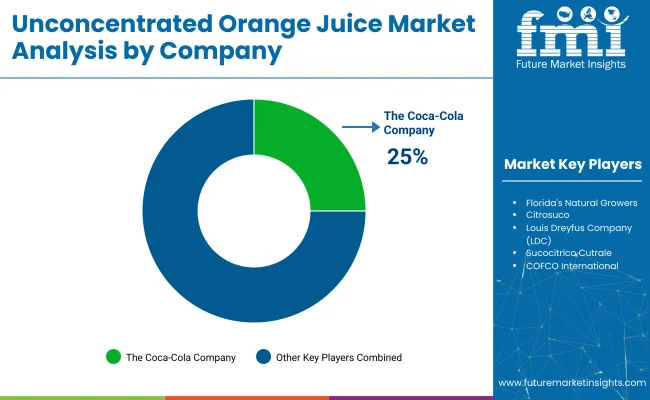
Leading Company - The Coca-Cola Company (Minute Maid, Simply Orange)

Industry Share - 25%

The global industry features a competitive landscape with dominant players, key players, and emerging players. Dominant players such as The Coca-Cola Company (Minute Maid, Simply Orange), PepsiCo, Inc. (Tropicana), and Florida's Natural Growers lead the industry with extensive product portfolios, strong R&D capabilities, and robust distribution networks across North America, Europe, and Latin America. Key players including Citrosuco, Louis Dreyfus Company (LDC), and SucocitricoCutrale offer specialized solutions tailored to specific applications and regional industries.

Emerging players, such as Uncle Matt's Organic, Rauch Fruchtsäfte GmbH & Co OG, and Huiyuan Juice Group Limited, focus on innovative technologies and cost-effective solutions, expanding their presence in the global industry.

Recent Industry News

  • In February 2024, Austria Juice showcased its organic product range at BioFach 2023 in Nuremberg, Germany. The company highlighted apple, berry, and citrus juice concentrates, catering to the rising demand for clean-label, sustainable, and health-focused beverages in the industry.
  • In early 2025, Brazil’s orange juice production rebounded, with expectations of a 30% increase in the 2025/26 harvest, reaching 260 to 300 million boxes. This recovery, following a drought-affected season, caused a significant decline in global orange juice prices, dropping over 50%. Analysts attribute the price drop to the improved crop outlook and its industry impact.

Key Unconcentrated Orange Juice Market Players

  • The Coca-Cola Company (Minute Maid, Simply Orange)
  • PepsiCo, Inc. (Tropicana)
  • Florida's Natural Growers
  • Citrosuco
  • Louis Dreyfus Company (LDC)
  • SucocitricoCutrale
  • COFCO International
  • Uncle Matt's Organic
  • Rauch Fruchtsäfte GmbH & Co OG
  • Trade Winds Citrus Limited
  • Ventura Coastal LLC
  • Nestlé S.A.
  • ITC Limited
  • Sumol + CompalMarcas S.A.
  • Huiyuan Juice Group Limited

Report Scope -Unconcentrated Orange Juice Market

Report Attributes Details
Industry Size (2025E) USD 5.4 billion
Projected Industry Size (2035F) USD 9.7 billion
CAGR (2025 to 2035) 6%
Base Year for Estimation 2024
Historical Period 2020 to 2024
Projection Period 2025 to 2035
Quantitative Units USD billion for value & thousand liters for volume
By Product Type (Segment 1) Not-From-Concentrate (NFC) Orange Juice, Freshly Squeezed Orange Juice, Cold-pressed Orange Juice, Premium Unconcentrated Orange Juice
By Processing Method (Segment 2) Pasteurized, Unpasteurized, High-Pressure Processing (HPP), Pulsed Electric Field (PEF), Others
By Packaging Type (Segment 3) Carton Packaging (Tetra Pak, Pure-Pak, Others), Plastic Bottles (PET Bottles, HDPE Bottles, Others), Glass Bottles, Bulk Packaging (Bag-in-Box, Aseptic Tanks, Drums, Others)
By Distribution Channel (Segment 4 ) Supermarkets & Hypermarkets, Convenience Stores, Online Retail, Specialty Stores, Foodservice (HoReCa: Hotel, Restaurant, Café; Institutional; Other Foodservice), Others
By End Use (Segment 5 ) Direct Consumption, Culinary Applications, Beverage Blends, Functional Beverages, Others
Regions Covered North America, Europe, Asia Pacific, Latin America, Middle East & Africa
Countries Covered USA, Canada, Germany, UK, France, Spain, Italy, Netherlands, Rest of Europe, China, India, Japan, Australia, South Korea, Rest of Asia Pacific, Brazil, Mexico, Argentina, Rest of Latin America, Saudi Arabia, South Africa, UAE, Rest of Middle East and Africa
Key Players Influencing the Industry The Coca-Cola Company (Minute Maid, Simply Orange), PepsiCo, Inc. (Tropicana), Florida's Natural Growers, Citrosuco, Louis Dreyfus Company (LDC), Sucocitrico Cutrale, COFCO International, Uncle Matt's Organic, Rauch Fruchtsäfte GmbH & Co OG, Trade Winds Citrus Limited, Ventura Coastal LLC, Nestle S.A., ITC Limited, Sumol + Compal Marcas S.A., Huiyuan Juice Group Limited
Additional Attributes Dollar sales, share, NFC demand growth, premiumization trends, innovations in cold-pressed and clean-label juices, expansion of online and HoReCa distribution, sustainability-focused packaging developments

Unconcentrated Orange Juice Market Studied by Key Segments

By Product Type:

The segmentation includes not-from-concentrate orange juice, freshly squeezed orange juice, cold-pressed orange juice, and premium unconcentrated orange juice.

By Processing Method:

Processing methods cover pasteurized, unpasteurized, high-pressure processing, pulsed electric field, and others.

By Packaging Type:

Packaging formats include carton packaging, plastic bottles, glass bottles, bulk packaging, and others.

By Distribution Channel:

Distribution occurs through supermarkets & hypermarkets, convenience stores, online retail, specialty stores, foodservice, and others.

By End Use:

End-use categories include direct consumption, culinary applications, beverage blends, functional beverages, and others.

By Region:

The industry spans North America, Europe, Asia Pacific, Latin America, and the Middle East & Africa.

Table of Content

  1. Executive Summary
    • Global Market Outlook
    • Demand-side Trends
    • Supply-side Trends
    • Technology Roadmap Analysis
    • Analysis and Recommendations
  2. Market Overview
    • Market Coverage / Taxonomy
    • Market Definition / Scope / Limitations
  3. Market Background
    • Market Dynamics
      • Drivers
      • Restraints
      • Opportunity
      • Trends
    • Scenario Forecast
      • Demand in Optimistic Scenario
      • Demand in Likely Scenario
      • Demand in Conservative Scenario
    • Opportunity Map Analysis
    • Product Life Cycle Analysis
    • Supply Chain Analysis
      • Supply Side Participants and their Roles
        • Producers
        • Mid-Level Participants (Traders/ Agents/ Brokers)
        • Wholesalers and Distributors
      • Value Added and Value Created at Node in the Supply Chain
      • List of Raw Material Suppliers
      • List of Existing and Potential Buyer’s
    • Investment Feasibility Matrix
    • Value Chain Analysis
      • Profit Margin Analysis
      • Wholesalers and Distributors
      • Retailers
    • PESTLE and Porter’s Analysis
    • Regulatory Landscape
      • By Key Regions
      • By Key Countries
    • Regional Parent Market Outlook
    • Production and Consumption Statistics
    • Import and Export Statistics
  4. Global Market Analysis 2020 to 2024 and Forecast, 2025 to 2035
    • Historical Market Size Value (USD Billion) & Volume (Thousand Liters) Analysis, 2020 to 2024
    • Current and Future Market Size Value (USD Billion) & Volume (Thousand Liters) Projections, 2025 to 2035
      • Y-o-Y Growth Trend Analysis
      • Absolute $ Opportunity Analysis
  5. Global Market Pricing Analysis 2020 to 2024 and Forecast 2025 to 2035
  6. Global Market Analysis 2020 to 2024 and Forecast 2025 to 2035, By Product Type
    • Introduction / Key Findings
    • Historical Market Size Value (USD Billion) & Volume (Thousand Liters) Analysis By Product Type, 2020 to 2024
    • Current and Future Market Size Value (USD Billion) & Volume (Thousand Liters) Analysis and Forecast By Product Type, 2025 to 2035
      • Not-From-Concentrate (NFC) Orange Juice
      • Freshly Squeezed Orange Juice
      • Cold-Pressed Orange Juice
      • Premium Unconcentrated Orange Juice
    • Y-o-Y Growth Trend Analysis By Product Type, 2020 to 2024
    • Absolute $ Opportunity Analysis By Product Type, 2025 to 2035
  7. Global Market Analysis 2020 to 2024 and Forecast 2025 to 2035, By Processing Method
    • Introduction / Key Findings
    • Historical Market Size Value (USD Billion) & Volume (Thousand Liters) Analysis By Processing Method, 2020 to 2024
    • Current and Future Market Size Value (USD Billion) & Volume (Thousand Liters) Analysis and Forecast By Processing Method, 2025 to 2035
      • Pasteurized
      • Unpasteurized
      • High-Pressure Processing (HPP)
      • Pulsed Electric Field (PEF)
      • Others
    • Y-o-Y Growth Trend Analysis By Processing Method, 2020 to 2024
    • Absolute $ Opportunity Analysis By Processing Method, 2025 to 2035
  8. Global Market Analysis 2020 to 2024 and Forecast 2025 to 2035, By Packaging Type
    • Introduction / Key Findings
    • Historical Market Size Value (USD Billion) & Volume (Thousand Liters) Analysis By Packaging Type, 2020 to 2024
    • Current and Future Market Size Value (USD Billion) & Volume (Thousand Liters) Analysis and Forecast By Packaging Type, 2025 to 2035
      • Carton Packaging
        • Tetra Pak
        • Pure-Pak
        • Others
      • Plastic bottles
        • PET bottles
        • HDPE bottles
        • Others
      • Glass Bottles
      • Bulk packaging
        • Bag-in-Box
        • Aseptic tanks
        • Drums
      • Others
    • Y-o-Y Growth Trend Analysis By Packaging Type, 2020 to 2024
    • Absolute $ Opportunity Analysis By Packaging Type, 2025 to 2035
  9. Global Market Analysis 2020 to 2024 and Forecast 2025 to 2035, By Distribution Channel
    • Introduction / Key Findings
    • Historical Market Size Value (USD Billion) & Volume (Thousand Liters) Analysis By Distribution Channel, 2020 to 2024
    • Current and Future Market Size Value (USD Billion) & Volume (Thousand Liters) Analysis and Forecast By Distribution Channel, 2025 to 2035
      • Supermarkets & Hypermarkets
      • Convenience Stores
      • Online Retail
      • Specialty Stores
      • Foodservice
        • HoReCa
        • Institutional
        • Other Foodservice
      • Others
    • Y-o-Y Growth Trend Analysis By Distribution Channel, 2020 to 2024
    • Absolute $ Opportunity Analysis By Distribution Channel, 2025 to 2035
  10. Global Market Analysis 2020 to 2024 and Forecast 2025 to 2035, By End Use
    • Introduction / Key Findings
    • Historical Market Size Value (USD Billion) & Volume (Thousand Liters) Analysis By End Use, 2020 to 2024
    • Current and Future Market Size Value (USD Billion) & Volume (Thousand Liters) Analysis and Forecast By End Use, 2025 to 2035
      • Direct Consumption
      • Culinary Applications
      • Beverage Blends
      • Functional Beverages
      • Others
    • Y-o-Y Growth Trend Analysis By End Use, 2020 to 2024
    • Absolute $ Opportunity Analysis By End Use, 2025 to 2035
  11. Global Market Analysis 2020 to 2024 and Forecast 2025 to 2035, By Region
    • Introduction
    • Historical Market Size Value (USD Billion) & Volume (Thousand Liters) Analysis By Region, 2020 to 2024
    • Current Market Size Value (USD Billion) & Volume (Thousand Liters) Analysis and Forecast By Region, 2025 to 2035
      • North America
      • Latin America
      • Western Europe
      • Eastern Europe
      • East Asia
      • South Asia & Pacific
      • Middle East and Africa
    • Market Attractiveness Analysis By Region
  12. North America Market Analysis 2020 to 2024 and Forecast 2025 to 2035, By Country
    • Historical Market Size Value (USD Billion) & Volume (Thousand Liters) Trend Analysis By Market Taxonomy, 2020 to 2024
    • Market Size Value (USD Billion) & Volume (Thousand Liters) Forecast By Market Taxonomy, 2025 to 2035
      • By Country
        • USA
        • Canada
        • Mexico
      • By Product Type
      • By Processing Method
      • By Packaging Type
      • By Distribution Channel
      • By End Use
    • Market Attractiveness Analysis
      • By Country
      • By Product Type
      • By Processing Method
      • By Packaging Type
      • By Distribution Channel
      • By End Use
    • Key Takeaways
  13. Latin America Market Analysis 2020 to 2024 and Forecast 2025 to 2035, By Country
    • Historical Market Size Value (USD Billion) & Volume (Thousand Liters) Trend Analysis By Market Taxonomy, 2020 to 2024
    • Market Size Value (USD Billion) & Volume (Thousand Liters) Forecast By Market Taxonomy, 2025 to 2035
      • By Country
        • Brazil
        • Argentina
        • Rest of LATAM
      • By Product Type
      • By Processing Method
      • By Packaging Type
      • By Distribution Channel
      • By End Use
    • Market Attractiveness Analysis
      • By Country
      • By Product Type
      • By Processing Method
      • By Packaging Type
      • By Distribution Channel
      • By End Use
    • Key Takeaways
  14. Western Europe Market Analysis 2020 to 2024 and Forecast 2025 to 2035, By Country
    • Historical Market Size Value (USD Billion) & Volume (Thousand Liters) Trend Analysis By Market Taxonomy, 2020 to 2024
    • Market Size Value (USD Billion) & Volume (Thousand Liters) Forecast By Market Taxonomy, 2025 to 2035
      • By Country
        • Germany
        • Italy
        • France
        • UK
        • Spain
        • BENELUX
        • Nordic
        • Rest of W. Europe
      • By Product Type
      • By Processing Method
      • By Packaging Type
      • By Distribution Channel
      • By End Use
    • Market Attractiveness Analysis
      • By Country
      • By Product Type
      • By Processing Method
      • By Packaging Type
      • By Distribution Channel
      • By End Use
    • Key Takeaways
  15. Eastern Europe Market Analysis 2020 to 2024 and Forecast 2025 to 2035, By Country
    • Historical Market Size Value (USD Billion) & Volume (Thousand Liters) Trend Analysis By Market Taxonomy, 2020 to 2024
    • Market Size Value (USD Billion) & Volume (Thousand Liters) Forecast By Market Taxonomy, 2025 to 2035
      • By Country
        • Russia
        • Hungary
        • Poland
        • Balkan & Baltics
        • Rest of E. Europe
      • By Product Type
      • By Processing Method
      • By Packaging Type
      • By Distribution Channel
      • By End Use
    • Market Attractiveness Analysis
      • By Country
      • By Product Type
      • By Processing Method
      • By Packaging Type
      • By Distribution Channel
      • By End Use
    • Key Takeaways
  16. East Asia Market Analysis 2020 to 2024 and Forecast 2025 to 2035, By Country
    • Historical Market Size Value (USD Billion) & Volume (Thousand Liters) Trend Analysis By Market Taxonomy, 2020 to 2024
    • Market Size Value (USD Billion) & Volume (Thousand Liters) Forecast By Market Taxonomy, 2025 to 2035
      • By Country
        • China
        • Japan
        • South Korea
      • By Product Type
      • By Processing Method
      • By Packaging Type
      • By Distribution Channel
      • By End Use
    • Market Attractiveness Analysis
      • By Country
      • By Product Type
      • By Processing Method
      • By Packaging Type
      • By Distribution Channel
      • By End Use
    • Key Takeaways
  17. South Asia & Pacific Market Analysis 2020 to 2024 and Forecast 2025 to 2035, By Country
    • Historical Market Size Value (USD Billion) & Volume (Thousand Liters) Trend Analysis By Market Taxonomy, 2020 to 2024
    • Market Size Value (USD Billion) & Volume (Thousand Liters) Forecast By Market Taxonomy, 2025 to 2035
      • By Country
        • India
        • Australia & New Zealand
        • ASEAN
        • Rest of SAP
      • By Product Type
      • By Processing Method
      • By Packaging Type
      • By Distribution Channel
      • By End Use
    • Market Attractiveness Analysis
      • By Country
      • By Product Type
      • By Processing Method
      • By Packaging Type
      • By Distribution Channel
      • By End Use
    • Key Takeaways
  18. Middle East and Africa Market Analysis 2020 to 2024 and Forecast 2025 to 2035, By Country
    • Historical Market Size Value (USD Billion) & Volume (Thousand Liters) Trend Analysis By Market Taxonomy, 2020 to 2024
    • Market Size Value (USD Billion) & Volume (Thousand Liters) Forecast By Market Taxonomy, 2025 to 2035
      • By Country
        • GCC Countries
        • Northern Africa
        • South Africa
        • Turkiye
        • Rest of MEA
      • By Product Type
      • By Processing Method
      • By Packaging Type
      • By Distribution Channel
      • By End Use
    • Market Attractiveness Analysis
      • By Country
      • By Product Type
      • By Processing Method
      • By Packaging Type
      • By Distribution Channel
      • By End Use
    • Key Takeaways
  19. Key Countries Market Analysis
    • USA
      • Pricing Analysis
      • Market Share Analysis, 2024
        • By Product Type
        • By Processing Method
        • By Packaging Type
        • By Distribution Channel
        • By End Use
    • Canada
      • Pricing Analysis
      • Market Share Analysis, 2024
        • By Product Type
        • By Processing Method
        • By Packaging Type
        • By Distribution Channel
        • By End Use
    • Brazil
      • Pricing Analysis
      • Market Share Analysis, 2024
        • By Product Type
        • By Processing Method
        • By Packaging Type
        • By Distribution Channel
        • By End Use
    • Mexico
      • Pricing Analysis
      • Market Share Analysis, 2024
        • By Product Type
        • By Processing Method
        • By Packaging Type
        • By Distribution Channel
        • By End Use
    • Argentina
      • Pricing Analysis
      • Market Share Analysis, 2024
        • By Product Type
        • By Processing Method
        • By Packaging Type
        • By Distribution Channel
        • By End Use
  20. Market Structure Analysis
    • Competition Dashboard
    • Competition Benchmarking
    • Market Share Analysis of Top Players
      • By Regional
      • By Product Type
      • By Processing Method
      • By Packaging Type
      • By Distribution Channel
      • By End Use
  21. Competition Analysis
    • Competition Deep Dive
      • The Coca-Cola Company (Minute Maid, Simply Orange)
        • Overview
        • Product Portfolio
        • Profitability by Market Segments (Product/Age /Sales Channel/Region)
        • Sales Footprint
        • Strategy Overview
          • Marketing Strategy
          • Product Strategy
          • Channel Strategy
      • PepsiCo, Inc. (Tropicana)
        • Overview
        • Product Portfolio
        • Profitability by Market Segments (Product/Age /Sales Channel/Region)
        • Sales Footprint
        • Strategy Overview
          • Marketing Strategy
          • Product Strategy
          • Channel Strategy
      • Florida's Natural Growers
        • Overview
        • Product Portfolio
        • Profitability by Market Segments (Product/Age /Sales Channel/Region)
        • Sales Footprint
        • Strategy Overview
          • Marketing Strategy
          • Product Strategy
          • Channel Strategy
      • Citrosuco
        • Overview
        • Product Portfolio
        • Profitability by Market Segments (Product/Age /Sales Channel/Region)
        • Sales Footprint
        • Strategy Overview
          • Marketing Strategy
          • Product Strategy
          • Channel Strategy
      • Louis Dreyfus Company (LDC)
        • Overview
        • Product Portfolio
        • Profitability by Market Segments (Product/Age /Sales Channel/Region)
        • Sales Footprint
        • Strategy Overview
          • Marketing Strategy
          • Product Strategy
          • Channel Strategy
      • Sucocitrico Cutrale
        • Overview
        • Product Portfolio
        • Profitability by Market Segments (Product/Age /Sales Channel/Region)
        • Sales Footprint
        • Strategy Overview
          • Marketing Strategy
          • Product Strategy
          • Channel Strategy
      • COFCO International
        • Overview
        • Product Portfolio
        • Profitability by Market Segments (Product/Age /Sales Channel/Region)
        • Sales Footprint
        • Strategy Overview
          • Marketing Strategy
          • Product Strategy
          • Channel Strategy
      • Uncle Matt's Organic
        • Overview
        • Product Portfolio
        • Profitability by Market Segments (Product/Age /Sales Channel/Region)
        • Sales Footprint
        • Strategy Overview
          • Marketing Strategy
          • Product Strategy
          • Channel Strategy
      • Rauch Fruchtsäfte GmbH & Co OG
        • Overview
        • Product Portfolio
        • Profitability by Market Segments (Product/Age /Sales Channel/Region)
        • Sales Footprint
        • Strategy Overview
          • Marketing Strategy
          • Product Strategy
          • Channel Strategy
      • Trade Winds Citrus Limited
        • Overview
        • Product Portfolio
        • Profitability by Market Segments (Product/Age /Sales Channel/Region)
        • Sales Footprint
        • Strategy Overview
          • Marketing Strategy
          • Product Strategy
          • Channel Strategy
      • Ventura Coastal LLC
        • Overview
        • Product Portfolio
        • Profitability by Market Segments (Product/Age /Sales Channel/Region)
        • Sales Footprint
        • Strategy Overview
          • Marketing Strategy
          • Product Strategy
          • Channel Strategy
      • Nestlé S.A.
        • Overview
        • Product Portfolio
        • Profitability by Market Segments (Product/Age /Sales Channel/Region)
        • Sales Footprint
        • Strategy Overview
          • Marketing Strategy
          • Product Strategy
          • Channel Strategy
      • ITC Limited
        • Overview
        • Product Portfolio
        • Profitability by Market Segments (Product/Age /Sales Channel/Region)
        • Sales Footprint
        • Strategy Overview
          • Marketing Strategy
          • Product Strategy
          • Channel Strategy
      • Sumol + Compal Marcas S.A.
        • Overview
        • Product Portfolio
        • Profitability by Market Segments (Product/Age /Sales Channel/Region)
        • Sales Footprint
        • Strategy Overview
          • Marketing Strategy
          • Product Strategy
          • Channel Strategy
      • Huiyuan Juice Group Limited
        • Overview
        • Product Portfolio
        • Profitability by Market Segments (Product/Age /Sales Channel/Region)
        • Sales Footprint
        • Strategy Overview
          • Marketing Strategy
          • Product Strategy
          • Channel Strategy
  22. Assumptions & Acronyms Used
  23. Research Methodology

List of Tables

  • Table 1: Global Market Value (USD Billion) Forecast by Region, 2020 to 2035
  • Table 2: Global Market Volume (Thousand Liters) Forecast by Region, 2020 to 2035
  • Table 3: Global Market Value (USD Billion) Forecast by Product Type, 2020 to 2035
  • Table 4: Global Market Volume (Thousand Liters) Forecast by Product Type, 2020 to 2035
  • Table 5: Global Market Value (USD Billion) Forecast by Processing Method, 2020 to 2035
  • Table 6: Global Market Volume (Thousand Liters) Forecast by Processing Method, 2020 to 2035
  • Table 7: Global Market Value (USD Billion) Forecast by Packaging Type, 2020 to 2035
  • Table 8: Global Market Volume (Thousand Liters) Forecast by Packaging Type, 2020 to 2035
  • Table 9: Global Market Value (USD Billion) Forecast by Distribution Channel, 2020 to 2035
  • Table 10: Global Market Volume (Thousand Liters) Forecast by Distribution Channel, 2020 to 2035
  • Table 11: Global Market Value (USD Billion) Forecast by End Use, 2020 to 2035
  • Table 12: Global Market Volume (Thousand Liters) Forecast by End Use, 2020 to 2035
  • Table 13: North America Market Value (USD Billion) Forecast by Country, 2020 to 2035
  • Table 14: North America Market Volume (Thousand Liters) Forecast by Country, 2020 to 2035
  • Table 15: North America Market Value (USD Billion) Forecast by Product Type, 2020 to 2035
  • Table 16: North America Market Volume (Thousand Liters) Forecast by Product Type, 2020 to 2035
  • Table 17: North America Market Value (USD Billion) Forecast by Processing Method, 2020 to 2035
  • Table 18: North America Market Volume (Thousand Liters) Forecast by Processing Method, 2020 to 2035
  • Table 19: North America Market Value (USD Billion) Forecast by Packaging Type, 2020 to 2035
  • Table 20: North America Market Volume (Thousand Liters) Forecast by Packaging Type, 2020 to 2035
  • Table 21: North America Market Value (USD Billion) Forecast by Distribution Channel, 2020 to 2035
  • Table 22: North America Market Volume (Thousand Liters) Forecast by Distribution Channel, 2020 to 2035
  • Table 23: North America Market Value (USD Billion) Forecast by End Use, 2020 to 2035
  • Table 24: North America Market Volume (Thousand Liters) Forecast by End Use, 2020 to 2035
  • Table 25: Latin America Market Value (USD Billion) Forecast by Country, 2020 to 2035
  • Table 26: Latin America Market Volume (Thousand Liters) Forecast by Country, 2020 to 2035
  • Table 27: Latin America Market Value (USD Billion) Forecast by Product Type, 2020 to 2035
  • Table 28: Latin America Market Volume (Thousand Liters) Forecast by Product Type, 2020 to 2035
  • Table 29: Latin America Market Value (USD Billion) Forecast by Processing Method, 2020 to 2035
  • Table 30: Latin America Market Volume (Thousand Liters) Forecast by Processing Method, 2020 to 2035
  • Table 31: Latin America Market Value (USD Billion) Forecast by Packaging Type, 2020 to 2035
  • Table 32: Latin America Market Volume (Thousand Liters) Forecast by Packaging Type, 2020 to 2035
  • Table 33: Latin America Market Value (USD Billion) Forecast by Distribution Channel, 2020 to 2035
  • Table 34: Latin America Market Volume (Thousand Liters) Forecast by Distribution Channel, 2020 to 2035
  • Table 35: Latin America Market Value (USD Billion) Forecast by End Use, 2020 to 2035
  • Table 36: Latin America Market Volume (Thousand Liters) Forecast by End Use, 2020 to 2035
  • Table 37: Western Europe Market Value (USD Billion) Forecast by Country, 2020 to 2035
  • Table 38: Western Europe Market Volume (Thousand Liters) Forecast by Country, 2020 to 2035
  • Table 39: Western Europe Market Value (USD Billion) Forecast by Product Type, 2020 to 2035
  • Table 40: Western Europe Market Volume (Thousand Liters) Forecast by Product Type, 2020 to 2035
  • Table 41: Western Europe Market Value (USD Billion) Forecast by Processing Method, 2020 to 2035
  • Table 42: Western Europe Market Volume (Thousand Liters) Forecast by Processing Method, 2020 to 2035
  • Table 43: Western Europe Market Value (USD Billion) Forecast by Packaging Type, 2020 to 2035
  • Table 44: Western Europe Market Volume (Thousand Liters) Forecast by Packaging Type, 2020 to 2035
  • Table 45: Western Europe Market Value (USD Billion) Forecast by Distribution Channel, 2020 to 2035
  • Table 46: Western Europe Market Volume (Thousand Liters) Forecast by Distribution Channel, 2020 to 2035
  • Table 47: Western Europe Market Value (USD Billion) Forecast by End Use, 2020 to 2035
  • Table 48: Western Europe Market Volume (Thousand Liters) Forecast by End Use, 2020 to 2035
  • Table 49: Eastern Europe Market Value (USD Billion) Forecast by Country, 2020 to 2035
  • Table 50: Eastern Europe Market Volume (Thousand Liters) Forecast by Country, 2020 to 2035
  • Table 51: Eastern Europe Market Value (USD Billion) Forecast by Product Type, 2020 to 2035
  • Table 52: Eastern Europe Market Volume (Thousand Liters) Forecast by Product Type, 2020 to 2035
  • Table 53: Eastern Europe Market Value (USD Billion) Forecast by Processing Method, 2020 to 2035
  • Table 54: Eastern Europe Market Volume (Thousand Liters) Forecast by Processing Method, 2020 to 2035
  • Table 55: Eastern Europe Market Value (USD Billion) Forecast by Packaging Type, 2020 to 2035
  • Table 56: Eastern Europe Market Volume (Thousand Liters) Forecast by Packaging Type, 2020 to 2035
  • Table 57: Eastern Europe Market Value (USD Billion) Forecast by Distribution Channel, 2020 to 2035
  • Table 58: Eastern Europe Market Volume (Thousand Liters) Forecast by Distribution Channel, 2020 to 2035
  • Table 59: Eastern Europe Market Value (USD Billion) Forecast by End Use, 2020 to 2035
  • Table 60: Eastern Europe Market Volume (Thousand Liters) Forecast by End Use, 2020 to 2035
  • Table 61: East Asia Market Value (USD Billion) Forecast by Country, 2020 to 2035
  • Table 62: East Asia Market Volume (Thousand Liters) Forecast by Country, 2020 to 2035
  • Table 63: East Asia Market Value (USD Billion) Forecast by Product Type, 2020 to 2035
  • Table 64: East Asia Market Volume (Thousand Liters) Forecast by Product Type, 2020 to 2035
  • Table 65: East Asia Market Value (USD Billion) Forecast by Processing Method, 2020 to 2035
  • Table 66: East Asia Market Volume (Thousand Liters) Forecast by Processing Method, 2020 to 2035
  • Table 67: East Asia Market Value (USD Billion) Forecast by Packaging Type, 2020 to 2035
  • Table 68: East Asia Market Volume (Thousand Liters) Forecast by Packaging Type, 2020 to 2035
  • Table 69: East Asia Market Value (USD Billion) Forecast by Distribution Channel, 2020 to 2035
  • Table 70: East Asia Market Volume (Thousand Liters) Forecast by Distribution Channel, 2020 to 2035
  • Table 71: East Asia Market Value (USD Billion) Forecast by End Use, 2020 to 2035
  • Table 72: East Asia Market Volume (Thousand Liters) Forecast by End Use, 2020 to 2035
  • Table 73: South Asia & Pacific Market Value (USD Billion) Forecast by Country, 2020 to 2035
  • Table 74: South Asia & Pacific Market Volume (Thousand Liters) Forecast by Country, 2020 to 2035
  • Table 75: South Asia & Pacific Market Value (USD Billion) Forecast by Product Type, 2020 to 2035
  • Table 76: South Asia & Pacific Market Volume (Thousand Liters) Forecast by Product Type, 2020 to 2035
  • Table 77: South Asia & Pacific Market Value (USD Billion) Forecast by Processing Method, 2020 to 2035
  • Table 78: South Asia & Pacific Market Volume (Thousand Liters) Forecast by Processing Method, 2020 to 2035
  • Table 79: South Asia & Pacific Market Value (USD Billion) Forecast by Packaging Type, 2020 to 2035
  • Table 80: South Asia & Pacific Market Volume (Thousand Liters) Forecast by Packaging Type, 2020 to 2035
  • Table 81: South Asia & Pacific Market Value (USD Billion) Forecast by Distribution Channel, 2020 to 2035
  • Table 82: South Asia & Pacific Market Volume (Thousand Liters) Forecast by Distribution Channel, 2020 to 2035
  • Table 83: South Asia & Pacific Market Value (USD Billion) Forecast by End Use, 2020 to 2035
  • Table 84: South Asia & Pacific Market Volume (Thousand Liters) Forecast by End Use, 2020 to 2035
  • Table 85: Middle East and Africa Market Value (USD Billion) Forecast by Country, 2020 to 2035
  • Table 86: Middle East and Africa Market Volume (Thousand Liters) Forecast by Country, 2020 to 2035
  • Table 87: Middle East and Africa Market Value (USD Billion) Forecast by Product Type, 2020 to 2035
  • Table 88: Middle East and Africa Market Volume (Thousand Liters) Forecast by Product Type, 2020 to 2035
  • Table 89: Middle East and Africa Market Value (USD Billion) Forecast by Processing Method, 2020 to 2035
  • Table 90: Middle East and Africa Market Volume (Thousand Liters) Forecast by Processing Method, 2020 to 2035
  • Table 91: Middle East and Africa Market Value (USD Billion) Forecast by Packaging Type, 2020 to 2035
  • Table 92: Middle East and Africa Market Volume (Thousand Liters) Forecast by Packaging Type, 2020 to 2035
  • Table 93: Middle East and Africa Market Value (USD Billion) Forecast by Distribution Channel, 2020 to 2035
  • Table 94: Middle East and Africa Market Volume (Thousand Liters) Forecast by Distribution Channel, 2020 to 2035
  • Table 95: Middle East and Africa Market Value (USD Billion) Forecast by End Use, 2020 to 2035
  • Table 96: Middle East and Africa Market Volume (Thousand Liters) Forecast by End Use, 2020 to 2035

List of Figures

  • Figure 1: Global Market Volume (Thousand Liters) Forecast 2020 to 2035
  • Figure 2: Global Market Pricing Analysis
  • Figure 3: Global Market Value (USD Billion) Forecast 2020 to 2035
  • Figure 4: Global Market Value Share and BPS Analysis by Product Type, 2025 and 2035
  • Figure 5: Global Market Y-o-Y Growth Comparison by Product Type, 2025 to 2035
  • Figure 6: Global Market Attractiveness Analysis by Product Type
  • Figure 7: Global Market Value Share and BPS Analysis by Processing Method, 2025 and 2035
  • Figure 8: Global Market Y-o-Y Growth Comparison by Processing Method, 2025 to 2035
  • Figure 9: Global Market Attractiveness Analysis by Processing Method
  • Figure 10: Global Market Value Share and BPS Analysis by Packaging Type, 2025 and 2035
  • Figure 11: Global Market Y-o-Y Growth Comparison by Packaging Type, 2025 to 2035
  • Figure 12: Global Market Attractiveness Analysis by Packaging Type
  • Figure 13: Global Market Value Share and BPS Analysis by Distribution Channel, 2025 and 2035
  • Figure 14: Global Market Y-o-Y Growth Comparison by Distribution Channel, 2025 to 2035
  • Figure 15: Global Market Attractiveness Analysis by Distribution Channel
  • Figure 16: Global Market Value Share and BPS Analysis by End Use, 2025 and 2035
  • Figure 17: Global Market Y-o-Y Growth Comparison by End Use, 2025 to 2035
  • Figure 18: Global Market Attractiveness Analysis by End Use
  • Figure 19: Global Market Value (USD Billion) Share and BPS Analysis by Region, 2025 and 2035
  • Figure 20: Global Market Y-o-Y Growth Comparison by Region, 2025 to 2035
  • Figure 21: Global Market Attractiveness Analysis by Region
  • Figure 22: North America Market Incremental $ Opportunity, 2025 to 2035
  • Figure 23: Latin America Market Incremental $ Opportunity, 2025 to 2035
  • Figure 24: Western Europe Market Incremental $ Opportunity, 2025 to 2035
  • Figure 25: Eastern Europe Market Incremental $ Opportunity, 2025 to 2035
  • Figure 26: East Asia Market Incremental $ Opportunity, 2025 to 2035
  • Figure 27: South Asia & Pacific Market Incremental $ Opportunity, 2025 to 2035
  • Figure 28: Middle East and Africa Market Incremental $ Opportunity, 2025 to 2035
  • Figure 29: North America Market Value Share and BPS Analysis by Country, 2025 and 2035
  • Figure 30: North America Market Value Share and BPS Analysis by Product Type, 2025 and 2035
  • Figure 31: North America Market Y-o-Y Growth Comparison by Product Type, 2025 to 2035
  • Figure 32: North America Market Attractiveness Analysis by Product Type
  • Figure 33: North America Market Value Share and BPS Analysis by Processing Method, 2025 and 2035
  • Figure 34: North America Market Y-o-Y Growth Comparison by Processing Method, 2025 to 2035
  • Figure 35: North America Market Attractiveness Analysis by Processing Method
  • Figure 36: North America Market Value Share and BPS Analysis by Packaging Type, 2025 and 2035
  • Figure 37: North America Market Y-o-Y Growth Comparison by Packaging Type, 2025 to 2035
  • Figure 38: North America Market Attractiveness Analysis by Packaging Type
  • Figure 39: North America Market Value Share and BPS Analysis by Distribution Channel, 2025 and 2035
  • Figure 40: North America Market Y-o-Y Growth Comparison by Distribution Channel, 2025 to 2035
  • Figure 41: North America Market Attractiveness Analysis by Distribution Channel
  • Figure 42: North America Market Value Share and BPS Analysis by End Use, 2025 and 2035
  • Figure 43: North America Market Y-o-Y Growth Comparison by End Use, 2025 to 2035
  • Figure 44: North America Market Attractiveness Analysis by End Use
  • Figure 45: Latin America Market Value Share and BPS Analysis by Country, 2025 and 2035
  • Figure 46: Latin America Market Value Share and BPS Analysis by Product Type, 2025 and 2035
  • Figure 47: Latin America Market Y-o-Y Growth Comparison by Product Type, 2025 to 2035
  • Figure 48: Latin America Market Attractiveness Analysis by Product Type
  • Figure 49: Latin America Market Value Share and BPS Analysis by Processing Method, 2025 and 2035
  • Figure 50: Latin America Market Y-o-Y Growth Comparison by Processing Method, 2025 to 2035
  • Figure 51: Latin America Market Attractiveness Analysis by Processing Method
  • Figure 52: Latin America Market Value Share and BPS Analysis by Packaging Type, 2025 and 2035
  • Figure 53: Latin America Market Y-o-Y Growth Comparison by Packaging Type, 2025 to 2035
  • Figure 54: Latin America Market Attractiveness Analysis by Packaging Type
  • Figure 55: Latin America Market Value Share and BPS Analysis by Distribution Channel, 2025 and 2035
  • Figure 56: Latin America Market Y-o-Y Growth Comparison by Distribution Channel, 2025 to 2035
  • Figure 57: Latin America Market Attractiveness Analysis by Distribution Channel
  • Figure 58: Latin America Market Value Share and BPS Analysis by End Use, 2025 and 2035
  • Figure 59: Latin America Market Y-o-Y Growth Comparison by End Use, 2025 to 2035
  • Figure 60: Latin America Market Attractiveness Analysis by End Use
  • Figure 61: Western Europe Market Value Share and BPS Analysis by Country, 2025 and 2035
  • Figure 62: Western Europe Market Value Share and BPS Analysis by Product Type, 2025 and 2035
  • Figure 63: Western Europe Market Y-o-Y Growth Comparison by Product Type, 2025 to 2035
  • Figure 64: Western Europe Market Attractiveness Analysis by Product Type
  • Figure 65: Western Europe Market Value Share and BPS Analysis by Processing Method, 2025 and 2035
  • Figure 66: Western Europe Market Y-o-Y Growth Comparison by Processing Method, 2025 to 2035
  • Figure 67: Western Europe Market Attractiveness Analysis by Processing Method
  • Figure 68: Western Europe Market Value Share and BPS Analysis by Packaging Type, 2025 and 2035
  • Figure 69: Western Europe Market Y-o-Y Growth Comparison by Packaging Type, 2025 to 2035
  • Figure 70: Western Europe Market Attractiveness Analysis by Packaging Type
  • Figure 71: Western Europe Market Value Share and BPS Analysis by Distribution Channel, 2025 and 2035
  • Figure 72: Western Europe Market Y-o-Y Growth Comparison by Distribution Channel, 2025 to 2035
  • Figure 73: Western Europe Market Attractiveness Analysis by Distribution Channel
  • Figure 74: Western Europe Market Value Share and BPS Analysis by End Use, 2025 and 2035
  • Figure 75: Western Europe Market Y-o-Y Growth Comparison by End Use, 2025 to 2035
  • Figure 76: Western Europe Market Attractiveness Analysis by End Use
  • Figure 77: Eastern Europe Market Value Share and BPS Analysis by Country, 2025 and 2035
  • Figure 78: Eastern Europe Market Value Share and BPS Analysis by Product Type, 2025 and 2035
  • Figure 79: Eastern Europe Market Y-o-Y Growth Comparison by Product Type, 2025 to 2035
  • Figure 80: Eastern Europe Market Attractiveness Analysis by Product Type
  • Figure 81: Eastern Europe Market Value Share and BPS Analysis by Processing Method, 2025 and 2035
  • Figure 82: Eastern Europe Market Y-o-Y Growth Comparison by Processing Method, 2025 to 2035
  • Figure 83: Eastern Europe Market Attractiveness Analysis by Processing Method
  • Figure 84: Eastern Europe Market Value Share and BPS Analysis by Packaging Type, 2025 and 2035
  • Figure 85: Eastern Europe Market Y-o-Y Growth Comparison by Packaging Type, 2025 to 2035
  • Figure 86: Eastern Europe Market Attractiveness Analysis by Packaging Type
  • Figure 87: Eastern Europe Market Value Share and BPS Analysis by Distribution Channel, 2025 and 2035
  • Figure 88: Eastern Europe Market Y-o-Y Growth Comparison by Distribution Channel, 2025 to 2035
  • Figure 89: Eastern Europe Market Attractiveness Analysis by Distribution Channel
  • Figure 90: Eastern Europe Market Value Share and BPS Analysis by End Use, 2025 and 2035
  • Figure 91: Eastern Europe Market Y-o-Y Growth Comparison by End Use, 2025 to 2035
  • Figure 92: Eastern Europe Market Attractiveness Analysis by End Use
  • Figure 93: East Asia Market Value Share and BPS Analysis by Country, 2025 and 2035
  • Figure 94: East Asia Market Value Share and BPS Analysis by Product Type, 2025 and 2035
  • Figure 95: East Asia Market Y-o-Y Growth Comparison by Product Type, 2025 to 2035
  • Figure 96: East Asia Market Attractiveness Analysis by Product Type
  • Figure 97: East Asia Market Value Share and BPS Analysis by Processing Method, 2025 and 2035
  • Figure 98: East Asia Market Y-o-Y Growth Comparison by Processing Method, 2025 to 2035
  • Figure 99: East Asia Market Attractiveness Analysis by Processing Method
  • Figure 100: East Asia Market Value Share and BPS Analysis by Packaging Type, 2025 and 2035
  • Figure 101: East Asia Market Y-o-Y Growth Comparison by Packaging Type, 2025 to 2035
  • Figure 102: East Asia Market Attractiveness Analysis by Packaging Type
  • Figure 103: East Asia Market Value Share and BPS Analysis by Distribution Channel, 2025 and 2035
  • Figure 104: East Asia Market Y-o-Y Growth Comparison by Distribution Channel, 2025 to 2035
  • Figure 105: East Asia Market Attractiveness Analysis by Distribution Channel
  • Figure 106: East Asia Market Value Share and BPS Analysis by End Use, 2025 and 2035
  • Figure 107: East Asia Market Y-o-Y Growth Comparison by End Use, 2025 to 2035
  • Figure 108: East Asia Market Attractiveness Analysis by End Use
  • Figure 109: South Asia & Pacific Market Value Share and BPS Analysis by Country, 2025 and 2035
  • Figure 110: South Asia & Pacific Market Value Share and BPS Analysis by Product Type, 2025 and 2035
  • Figure 111: South Asia & Pacific Market Y-o-Y Growth Comparison by Product Type, 2025 to 2035
  • Figure 112: South Asia & Pacific Market Attractiveness Analysis by Product Type
  • Figure 113: South Asia & Pacific Market Value Share and BPS Analysis by Processing Method, 2025 and 2035
  • Figure 114: South Asia & Pacific Market Y-o-Y Growth Comparison by Processing Method, 2025 to 2035
  • Figure 115: South Asia & Pacific Market Attractiveness Analysis by Processing Method
  • Figure 116: South Asia & Pacific Market Value Share and BPS Analysis by Packaging Type, 2025 and 2035
  • Figure 117: South Asia & Pacific Market Y-o-Y Growth Comparison by Packaging Type, 2025 to 2035
  • Figure 118: South Asia & Pacific Market Attractiveness Analysis by Packaging Type
  • Figure 119: South Asia & Pacific Market Value Share and BPS Analysis by Distribution Channel, 2025 and 2035
  • Figure 120: South Asia & Pacific Market Y-o-Y Growth Comparison by Distribution Channel, 2025 to 2035
  • Figure 121: South Asia & Pacific Market Attractiveness Analysis by Distribution Channel
  • Figure 122: South Asia & Pacific Market Value Share and BPS Analysis by End Use, 2025 and 2035
  • Figure 123: South Asia & Pacific Market Y-o-Y Growth Comparison by End Use, 2025 to 2035
  • Figure 124: South Asia & Pacific Market Attractiveness Analysis by End Use
  • Figure 125: Middle East and Africa Market Value Share and BPS Analysis by Country, 2025 and 2035
  • Figure 126: Middle East and Africa Market Value Share and BPS Analysis by Product Type, 2025 and 2035
  • Figure 127: Middle East and Africa Market Y-o-Y Growth Comparison by Product Type, 2025 to 2035
  • Figure 128: Middle East and Africa Market Attractiveness Analysis by Product Type
  • Figure 129: Middle East and Africa Market Value Share and BPS Analysis by Processing Method, 2025 and 2035
  • Figure 130: Middle East and Africa Market Y-o-Y Growth Comparison by Processing Method, 2025 to 2035
  • Figure 131: Middle East and Africa Market Attractiveness Analysis by Processing Method
  • Figure 132: Middle East and Africa Market Value Share and BPS Analysis by Packaging Type, 2025 and 2035
  • Figure 133: Middle East and Africa Market Y-o-Y Growth Comparison by Packaging Type, 2025 to 2035
  • Figure 134: Middle East and Africa Market Attractiveness Analysis by Packaging Type
  • Figure 135: Middle East and Africa Market Value Share and BPS Analysis by Distribution Channel, 2025 and 2035
  • Figure 136: Middle East and Africa Market Y-o-Y Growth Comparison by Distribution Channel, 2025 to 2035
  • Figure 137: Middle East and Africa Market Attractiveness Analysis by Distribution Channel
  • Figure 138: Middle East and Africa Market Value Share and BPS Analysis by End Use, 2025 and 2035
  • Figure 139: Middle East and Africa Market Y-o-Y Growth Comparison by End Use, 2025 to 2035
  • Figure 140: Middle East and Africa Market Attractiveness Analysis by End Use
  • Figure 141: Global Market - Tier Structure Analysis
  • Figure 142: Global Market - Company Share Analysis

Frequently Asked Questions

What is the value of the unconcentrated orange juice market in 2025?

The industry value of the in 2025 is USD 5.4 billion.

What is the value of the unconcentrated orange juice market in 2035 and its CAGR?

The industry is projected to reach USD 9.7 billion by 2035, with a 6% CAGR.

What is the leading segment in the unconcentrated orange juice market?

Direct consumption will lead the industry with a 64.5% share in 2025.

Which country will lead the unconcentrated orange juice market?

The United States will lead the industry with a 4.2% CAGR from 2025 to 2035.

Who is the leading company in the unconcentrated orange juice market?

The Coca-Cola Company (Minute Maid, Simply Orange) is the leading company in the industry with a 25% share.

Explore Similar Insights

Future Market Insights

Unconcentrated Orange Juice Market