Reconstituted Juice Market Size and Share Forecast Outlook 2025 to 2035

The global reconstituted juice market is worth USD 14.3 billion in 2025 and is expected to reach USD 24.6 billion by 2035, reflecting a CAGR of 5.5%. The market expansion will be driven by rising consumer demand for shelf-stable, nutritious, and convenient beverage options.
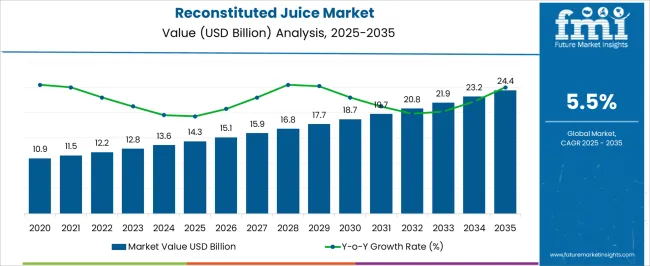
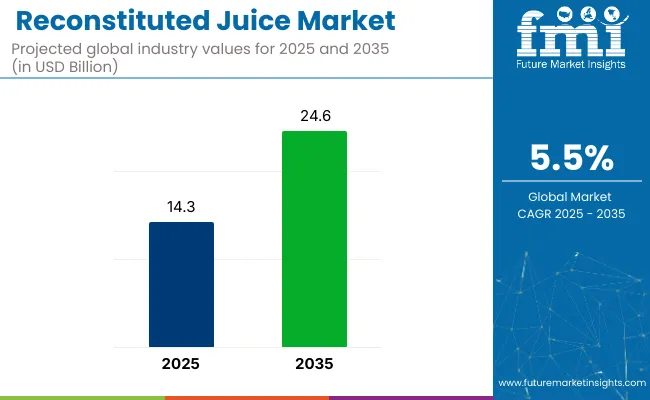
Quick Stats for Reconstituted Juice Market

  • Market Value (2025): USD 14.3 billion
  • Forecast Value (2035): USD 24.6 billion
  • Forecast CAGR: 5.5%
  • Ingredient Leader in 2025: Fruit (67% Market Share)
  • Top End Use Segment: Retail/Household (66% market Share)
  • Key Growth Region: North America (fastest growing market in the USA with 4.9% CAGR)

Reconstituted Juice Market

Metric Value
Estimated Size (2025E) USD 14.3 billion
Projected Value (2035F) USD 24.6 billion
CAGR (2025 to 2035) 5.5%

Increased urbanization, changing dietary habits, and growing health consciousness will continue to fuel interest in juice products that retain flavor and nutrition. Additionally, advancements in food processing and storage technologies have enabled longer shelf life and wider distribution, thereby supporting the market’s growth.

In terms of country performance, the USA will account for the largest share of global revenue, growing at a significant CAGR of 4.9%. Meanwhile, Germany and France are expected to emerge as the fastest-growing markets with projected CAGRs of 4.8% and 4.7% respectively. By nature type, the conventional segment is projected to lead with a 72% market share, while by ingredient, fruits are expected to dominate with a 67% market share in 2025.

The market holds a notable share within its parent markets, accounting for approximately 38% of the global fruit juice market due to its cost-effectiveness and long shelf life. Within the broader beverage market, it captures around 6%, while it constitutes roughly 12% of the non-alcoholic beverage segment.

In the packaged food and beverage market, reconstituted juice holds a 4% share, reflecting its consistent demand in retail and foodservice. It also comprises nearly 55% of the juice concentrate market, given its reliance on concentrates as raw material. In the functional beverage category, its share remains modest at 3%.

Going forward, innovation in sugar-free and vitamin-enriched reconstituted juice products will be emphasized to attract health-conscious consumers. Recent government regulations around clean-label products and reduced sugar content have influenced R&D priorities.

In addition, technological advancements such as aseptic packaging and water treatment used in reconstitution processes are helping companies offer safer, more appealing products. Regulatory support and shifting consumer preferences will shape the future growth trajectory of the reconstituted juice market.

Reconstituted Juice Market Analysis by Top Investment Segment

The market is segmented by Nature, ingredient, end-use, packaging, distribution channel and region. By nature, it is segmented into organic and conventional. By ingredient, it includes fruit, vegetables, mixed fruits and vegetables. By end use, it is segmented into HoReCa and household/retail.

By packaging, it includes retail, bottle, can, tetra pak and bulk. By distribution channel, it is segmented into direct/B2B, indirect/B2C, hypermarkets/supermarkets, modern grocery stores, discount stores, specialty stores and e-retail. By region, it covers North America, Latin America, Europe, East Asia, South Asia, Oceania, and the Middle East & Africa.
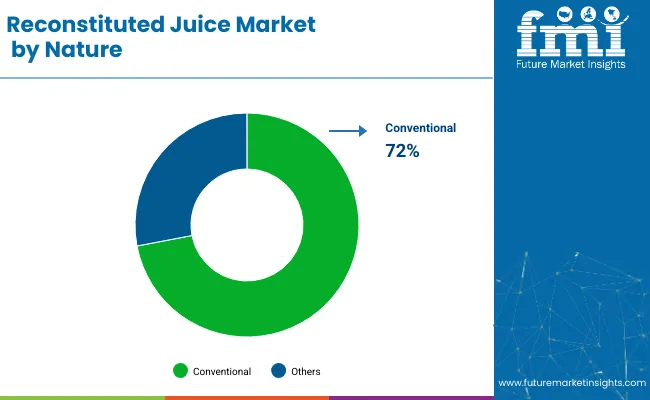
By Nature, the Conventional Segment Accounts for 72% of the Market Share

Reconstituted Juice Market By Nature

The conventional segment dominates the reconstituted juice market, projected to hold a 72% share in 2025, driven by affordability, mass-scale production, and global availability. Organic reconstituted juices are gaining momentum in niche consumer circles, especially in Europe and North America, owing to clean-label trends and perceived health benefits.
  • Conventional juices benefit from low production costs and established distribution.
  • Organic juices gain traction in premium wellness categories.
  • Certification and sourcing complexities hinder organic scale-up.
  • Growth in organic retail formats supports segment expansion.

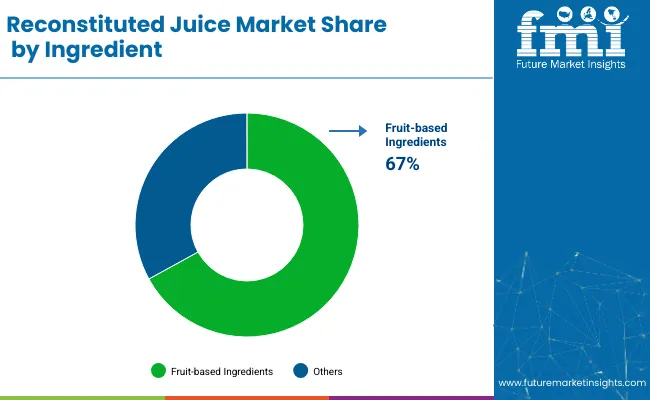
By Ingredient, Fruit-Based Ingredients Account for 67% of the Market Share

Reconstituted Juice Market Share By Ingredient

Fruit-based ingredients lead the market with a 67% share in 2025, owing to widespread consumer preference for orange, apple, and mixed fruit reconstituted juices. Vegetables and exotic fruit blends are seeing increased demand in functional beverages and detox formulations. Innovative combinations are also being introduced in sports and fitness drinks, targeting health-conscious urban demographics.
  • Citrus-based juices dominate breakfast and health drink routines.
  • Exotic and tropical fruits gain popularity in functional blends.
  • Vegetable-based juices emerge in low-calorie detox products.
  • Blended formulations drive differentiation and brand positioning.

By End Use, the Retail/Household Segment Accounts for 66% of the Market Share

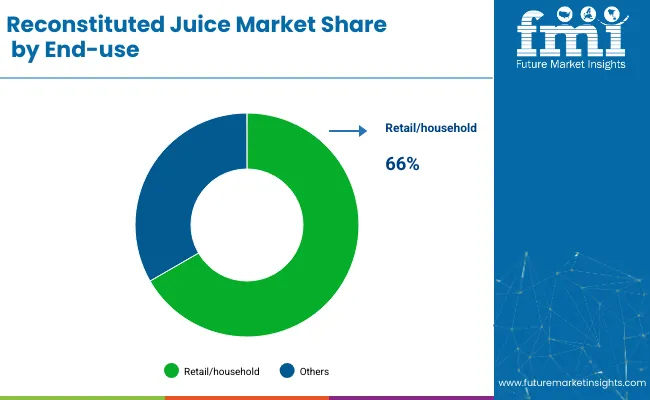
Reconstituted Juice Market Share By End Use

Retail/household consumption will dominate with a 66% market share in 2025, propelled by daily breakfast routines, rising disposable incomes, and health-focused lifestyles. The HoReCa segment is expanding steadily through hotels, restaurants, and catering services, offering juice-based cocktails and health beverages. Demand in food manufacturing remains consistent for use in flavored yogurts, confectioneries, and ready-to-drink mixes.
  • Retailers promote family packs and multipack cartons.
  • Cafes and hotels use juices in smoothies and mixed beverages.
  • Food manufacturers use reconstituted juice in yogurts and desserts.
  • Growing urban health trends expand on-the-go juice usage.

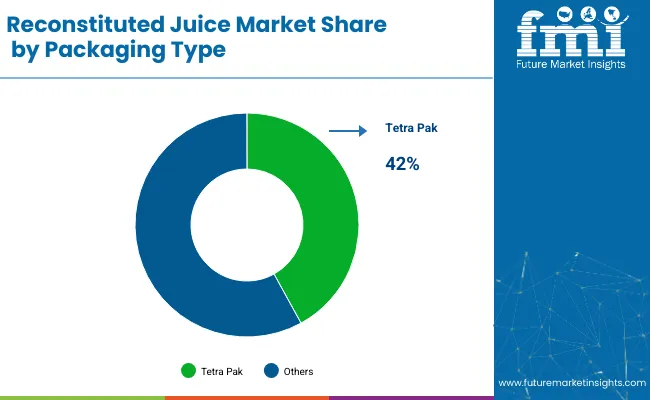
By Packaging, Tetra Pak Accounts for 42% of the Market Share

Reconstituted Juice Market Share By Packaging Type

Tetra packs lead with a 42% share in 2025, due to their lightweight nature, long shelf life, and convenience in transport and storage. Bottles (PET and glass) are gaining share in premium and cold-pressed juice categories. Bulk packaging formats like drums or cans cater to industrial and institutional users. Recyclable and sustainable packaging formats are gaining interest due to eco-conscious consumer behavior.

  • Tetra packs dominate retail shelves and family-size juice formats.
  • PET and glass bottles cater to ready-to-drink and single-serve options.
  • Bulk packs serve institutional catering and food processing.
  • Sustainable packaging drives innovation in brand portfolios.

By Distribution Channel, Indirect/B2C Sales Channel Accounts for 58% of the Market Share

Indirect/B2C sales channels such as supermarkets, hypermarkets, and e-Retail hold the majority, accounting for 58% of the market in 2025, due to broad accessibility and variety. Direct/B2B channels still account for a large portion, primarily for supply to restaurants, schools, and bulk food manufacturers. Online platforms are showing rapid growth, with personalized nutrition and subscription models leading the way.

  • Supermarkets and convenience stores dominate shelf-based sales.
  • B2B deals serve schools, airlines, and institutional catering.
  • e-Retail channels offer health-focused and premium juice brands.
  • Subscription and D2C platforms tap into repeat consumption habits.

Top Reconstituted Juice Market Dynamics

Recent Trends in the Reconstituted Juice Market

  • Surge in demand for affordable juice options amid rising food inflation.
  • Increasing uptake of fortified reconstituted juices with added vitamins and minerals.
  • Expansion of flavored and exotic fruit blends catering to diverse taste preferences.
  • Growth in on-the-go packaging formats like tetra packs and single-serve PET bottles.

Key Challenges in the Reconstituted Juice Market
  • Perception of lower quality compared to fresh and cold-pressed juices.
  • Regulatory scrutiny over sugar content and the use of preservatives.
  • Inconsistent supply of high-quality fruit concentrates due to seasonal variability.
  • Intensifying competition from fresh, organic, and not-from-concentrate (NFC) juices.

Analyzing Top Countries Producing, Using, and Supplying the Reconstituted Juice

Reconstituted Juice Market Country Wise Analysis

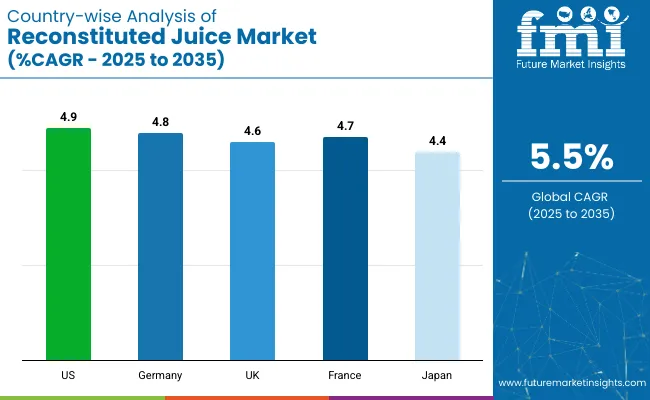
Among the top five countries, the USA leads the reconstituted juice market with a projected CAGR of 4.9% from 2025 to 2035, driven by affordable, vitamin-enriched offerings. Germany follows closely at 4.8%, supported by a strong organic segment and institutional demand.

France and the UK show similar momentum with CAGRs of 4.7% and 4.6%, respectively, fueled by premium blends and functional beverages. Japan exhibits the slowest growth at 4.4%, though its market is driven by single-serve innovation and fortified juice formats. Overall, developed nations show steady uptake of functional, clean-label reconstituted juice options.

The report covers an in-depth analysis of 40+ countries; five top-performing OECD countries are highlighted below.
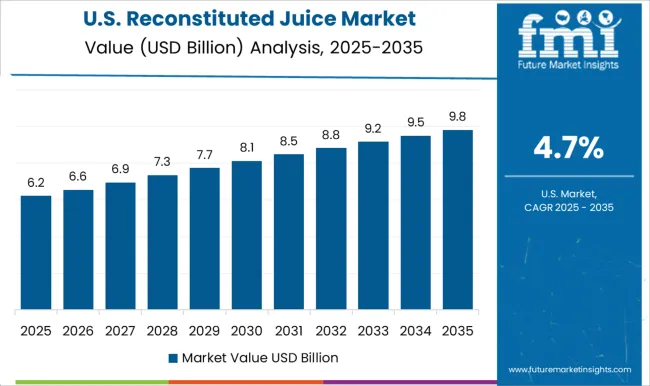
United States Reconstituted Juice Market Analysis

The reconstituted juice revenue in the USA is projected to grow at a CAGR of 4.9% from 2025 to 2035, driven by increasing consumer demand for cost-effective, shelf-stable juice products. Domestic beverage manufacturers are expanding their use of imported fruit concentrates to reduce costs and streamline production. The USA market is also seeing growth in fortified reconstituted juices targeting health-conscious segments.

  • Strong demand for vitamin-enriched, affordable beverages.
  • Extensive use of imported orange and apple concentrates.
  • Private-label growth in mass retail and club stores.

Reconstituted Juice Demand Analysis in the United Kingdom

The reconstituted juice market in the UK is expected to rise at a CAGR of 4.6% from 2025 to 2035, supported by consumer preference for low-sugar, functional beverages. Retailers are launching own-brand reconstituted juice lines with clean-label claims, while sustainability in packaging and sourcing is gaining importance.
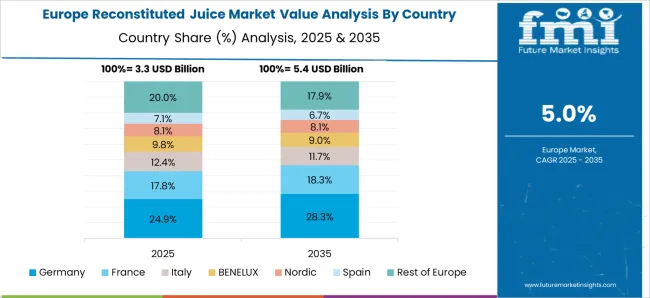
  • Increased demand for low-calorie and vitamin-C-rich drinks.
  • Emphasis on recyclable, eco-friendly packaging formats.
  • Shift towards EU-compliant, traceable concentrate sources.

Germany Reconstituted Juice Sales Analysis

The sales of reconstituted juice in Germany are forecasted to flourish at a CAGR of 4.8% from 2025 to 2035, owing to strong consumer preference for healthy, preservative-free juice options. Domestic production leverages European-grown fruits, and processors focus on cold-filled, ambient-stable packaging. Organic variants are also emerging.

  • Strong penetration of organic and reduced-sugar juice lines.
  • Local sourcing from EU fruit concentrate suppliers.
  • High demand in institutional and HoReCa segments.

Reconstituted Juice Demand Analysis in France

The revenue from reconstituted juice in France is anticipated to grow at a CAGR of 4.7% from 2025 to 2035, fueled by demand for premium fruit blends and functional wellness beverages. French consumers continue to favor juice blends with botanical or probiotic additives. The foodservice sector contributes significantly to volume sales.

  • Growing trend of immunity-boosting juice formulations.
  • Popularity of Mediterranean fruit concentrates.
  • Expansion of reconstituted juices in cafés and breakfast chains.

Japan Reconstituted Juice Market Analysis

The reconstituted juice market in Japan is slated to grow at a CAGR of 4.4% from 2025 to 2035, driven by convenience, long shelf life, and expanding vending and retail networks. Japanese consumers prefer fruit juices with enhanced nutritional profiles, and imports from Brazil and ASEAN countries dominate concentrate sourcing.
  • Demand for single-serve, fortified juice packs.
  • Import-reliant supply chain for tropical fruits.
  • Functional juices targeting immunity and energy markets.

Leading Reconstituted Juice Suppliers

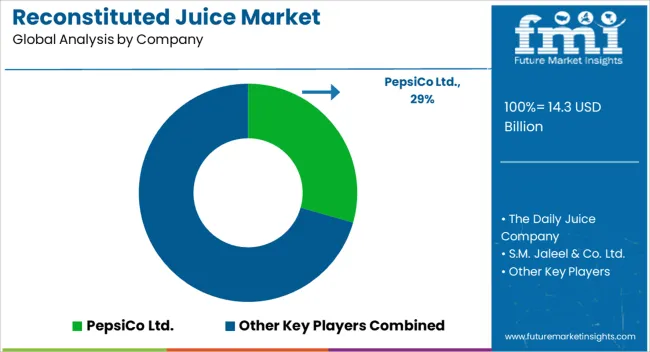
The reconstituted juice market is moderately consolidated, with major players like PepsiCo Ltd., Citrus World Inc., Citrosuco S.A., The Daily Juice Company, and Louis Dreyfus Company B.V. commanding a significant global share. These companies focus on leveraging economies of scale, global supply chain capabilities, and diversified juice portfolios to maintain competitive dominance. Innovation in flavor, clean-label positioning, and sustainability remain central to their strategies.

Top suppliers are competing through product differentiation, strategic regional expansions, private-label partnerships, and increased production of organic and reduced-sugar variants. Companies like PepsiCo are targeting health-conscious consumers with new functional juice offerings, while suppliers like Citrosuco and AGRANA are investing in sustainability initiatives, including carbon reduction in fruit concentrate production and recyclable packaging solutions. Meanwhile, Louis Dreyfus Company is strengthening its downstream integration to maintain pricing flexibility and control over quality standards.

Recent Reconstituted Juice Market News

  • PepsiCo’s reconstituted juice sales are further supported by the rising demand for convenient, longer-shelf-life beverages, and the company has reported strong performance in this segment as part of its broader beverage portfolio in 2024 and 2025.
  • AGRANA, a major European food industry group, aims to capitalize on the growing demand for natural and functional beverage options, with a focus on sustainability and cleaner label products. AGRANA’s strategic initiatives are highlighted as key drivers for its growth in the reconstituted juice market in 2024 and 2025.

Reconstituted Juice Market Report Scope

Report Attributes Details
Current Total Market Size (2025) USD 14.3 billion
Projected Market Size (2035) USD 24.6 billion
CAGR (2025 to 2035) 5.5%
Base Year for Estimation 2024
Historical Period 2020 to 2024
Projections Period 2025 to 2035
Market Analysis Parameters Revenue in USD billions / Volume in metric tons
By Nature Organic, Conventional
By Ingredient Fruit, Vegetable, Mixed Fruits and Vegetables
By End-Use HoReCa (Hotels, Restaurants, and Cafes), Household/Retail
By Packaging Retail, Bottle, Can, Tetra Pak, Bulk
By Distribution Channel Direct/B2B, Indirect/B2C, Hypermarkets/Supermarkets, Modern Grocery Stores, Discount Stores, Specialty Stores, e-Retail
Regions Covered North America, Latin America, Europe, East Asia, South Asia, Middle East & Africa, Oceania
Countries Covered United States, Canada, United Kingdom, Germany, France, China, Japan, South Korea, Brazil, Australia and 40+ Countries
Key Players PepsiCo Ltd., The Daily Juice Company, S.M. Jaleel & Co. Ltd., Citrus World, Inc., Citrosuco S.A., Louis Dreyfus Company B.V., Lemon Concentrate S.L., Frunutex Sp. z o.o., and AGRANA Beteiligungs-AG.
Additional Attributes Dollar sales by value, market share analysis by segments, and country-wise analysis

Key Segments

By Nature:

  • Organic
  • Conventional

By Ingredient:

  • Fruit
  • Vegetable
  • Mixed Fruits and Vegetable

By End Use:

  • HoReCa (Hotels, Restaurants, and Cafes)
  • Household/Retail

By Packaging:

  • Retail
  • Bottle
  • Can
  • Tetra Pak
  • Bulk

By Distribution Channel:

  • Direct/B2B
  • Indirect/B2C
  • Hypermarkets/Supermarkets
  • Modern Grocery Stores
  • Discount Stores
  • Specialty Stores
  • e-Retail

By Region:

  • North America
  • Latin America
  • Europe
  • East Asia
  • South Asia
  • Oceania
  • Middle East & Africa

Table of Content

  1. Executive Summary
    • Global Market Outlook
    • Demand-side Trends
    • Supply-side Trends
    • Technology Roadmap Analysis
    • Analysis and Recommendations
  2. Market Overview
    • Market Coverage / Taxonomy
    • Market Definition / Scope / Limitations
  3. Market Background
    • Market Dynamics
      • Drivers
      • Restraints
      • Opportunity
      • Trends
    • Scenario Forecast
      • Demand in Optimistic Scenario
      • Demand in Likely Scenario
      • Demand in Conservative Scenario
    • Opportunity Map Analysis
    • Product Life Cycle Analysis
    • Supply Chain Analysis
      • Supply Side Participants and their Roles
        • Producers
        • Mid-Level Participants (Traders/ Agents/ Brokers)
        • Wholesalers and Distributors
      • Value Added and Value Created at Node in the Supply Chain
      • List of Raw Material Suppliers
      • List of Existing and Potential Buyer’s
    • Investment Feasibility Matrix
    • Value Chain Analysis
      • Profit Margin Analysis
      • Wholesalers and Distributors
      • Retailers
    • PESTLE and Porter’s Analysis
    • Regulatory Landscape
      • By Key Regions
      • By Key Countries
    • Regional Parent Market Outlook
    • Production and Consumption Statistics
    • Import and Export Statistics
  4. Global Market Analysis 2020 to 2024 and Forecast, 2025 to 2035
    • Historical Market Size Value (USD billion) & Volume (metric tons) Analysis, 2020 to 2024
    • Current and Future Market Size Value (USD billion) & Volume (metric tons) Projections, 2025 to 2035
      • Y-o-Y Growth Trend Analysis
      • Absolute $ Opportunity Analysis
  5. Global Market Pricing Analysis 2020 to 2024 and Forecast 2025 to 2035
  6. Global Market Analysis 2020 to 2024 and Forecast 2025 to 2035, By Nature
    • Introduction / Key Findings
    • Historical Market Size Value (USD billion) & Volume (metric tons) Analysis By Nature, 2020 to 2024
    • Current and Future Market Size Value (USD billion) & Volume (metric tons) Analysis and Forecast By Nature, 2025 to 2035
      • Organic
      • Conventional
    • Y-o-Y Growth Trend Analysis By Nature, 2020 to 2024
    • Absolute $ Opportunity Analysis By Nature, 2025 to 2035
  7. Global Market Analysis 2020 to 2024 and Forecast 2025 to 2035, By Ingredient
    • Introduction / Key Findings
    • Historical Market Size Value (USD billion) & Volume (metric tons) Analysis By Ingredient, 2020 to 2024
    • Current and Future Market Size Value (USD billion) & Volume (metric tons) Analysis and Forecast By Ingredient, 2025 to 2035
      • Fruit
      • Vegetable
      • Mixed Fruits and Vegetables
    • Y-o-Y Growth Trend Analysis By Ingredient, 2020 to 2024
    • Absolute $ Opportunity Analysis By Ingredient, 2025 to 2035
  8. Global Market Analysis 2020 to 2024 and Forecast 2025 to 2035, By End Use
    • Introduction / Key Findings
    • Historical Market Size Value (USD billion) & Volume (metric tons) Analysis By End Use, 2020 to 2024
    • Current and Future Market Size Value (USD billion) & Volume (metric tons) Analysis and Forecast By End Use, 2025 to 2035
      • HoReCa (Hotels, Restaurants, and Cafes)
      • Retail/Household
    • Y-o-Y Growth Trend Analysis By End Use, 2020 to 2024
    • Absolute $ Opportunity Analysis By End Use, 2025 to 2035
  9. Global Market Analysis 2020 to 2024 and Forecast 2025 to 2035, By Packaging
    • Introduction / Key Findings
    • Historical Market Size Value (USD billion) & Volume (metric tons) Analysis By Packaging, 2020 to 2024
    • Current and Future Market Size Value (USD billion) & Volume (metric tons) Analysis and Forecast By Packaging, 2025 to 2035
      • Retail
      • Bottle
      • Can
      • Tetra Pak
      • Bulk
    • Y-o-Y Growth Trend Analysis By Packaging, 2020 to 2024
    • Absolute $ Opportunity Analysis By Packaging, 2025 to 2035
  10. Global Market Analysis 2020 to 2024 and Forecast 2025 to 2035, By Distribution Channel
    • Introduction / Key Findings
    • Historical Market Size Value (USD billion) & Volume (metric tons) Analysis By Distribution Channel, 2020 to 2024
    • Current and Future Market Size Value (USD billion) & Volume (metric tons) Analysis and Forecast By Distribution Channel, 2025 to 2035
      • Direct/B2B
      • Indirect/B2C
      • Hypermarkets/Supermarkets
      • Modern Grocery Stores
      • Discount Stores
      • Specialty Stores
      • e-Retail
    • Y-o-Y Growth Trend Analysis By Distribution Channel, 2020 to 2024
    • Absolute $ Opportunity Analysis By Distribution Channel, 2025 to 2035
  11. Global Market Analysis 2020 to 2024 and Forecast 2025 to 2035, By Region
    • Introduction
    • Historical Market Size Value (USD billion) & Volume (metric tons) Analysis By Region, 2020 to 2024
    • Current Market Size Value (USD billion) & Volume (metric tons) Analysis and Forecast By Region, 2025 to 2035
      • North America
      • Latin America
      • Western Europe
      • Eastern Europe
      • East Asia
      • South Asia & Pacific
      • Middle East and Africa
    • Market Attractiveness Analysis By Region
  12. North America Market Analysis 2020 to 2024 and Forecast 2025 to 2035, By Country
    • Historical Market Size Value (USD billion) & Volume (metric tons) Trend Analysis By Market Taxonomy, 2020 to 2024
    • Market Size Value (USD billion) & Volume (metric tons) Forecast By Market Taxonomy, 2025 to 2035
      • By Country
        • USA
        • Canada
        • Mexico
      • By Nature
      • By Ingredient
      • By End Use
      • By Packaging
      • By Distribution Channel
    • Market Attractiveness Analysis
      • By Country
      • By Nature
      • By Ingredient
      • By End Use
      • By Packaging
      • By Distribution Channel
    • Key Takeaways
  13. Latin America Market Analysis 2020 to 2024 and Forecast 2025 to 2035, By Country
    • Historical Market Size Value (USD billion) & Volume (metric tons) Trend Analysis By Market Taxonomy, 2020 to 2024
    • Market Size Value (USD billion) & Volume (metric tons) Forecast By Market Taxonomy, 2025 to 2035
      • By Country
        • Brazil
        • Argentina
        • Rest of LATAM
      • By Nature
      • By Ingredient
      • By End Use
      • By Packaging
      • By Distribution Channel
    • Market Attractiveness Analysis
      • By Country
      • By Nature
      • By Ingredient
      • By End Use
      • By Packaging
      • By Distribution Channel
    • Key Takeaways
  14. Western Europe Market Analysis 2020 to 2024 and Forecast 2025 to 2035, By Country
    • Historical Market Size Value (USD billion) & Volume (metric tons) Trend Analysis By Market Taxonomy, 2020 to 2024
    • Market Size Value (USD billion) & Volume (metric tons) Forecast By Market Taxonomy, 2025 to 2035
      • By Country
        • Germany
        • Italy
        • France
        • UK
        • Spain
        • BENELUX
        • Nordic
        • Rest of W.Europe
      • By Nature
      • By Ingredient
      • By End Use
      • By Packaging
      • By Distribution Channel
    • Market Attractiveness Analysis
      • By Country
      • By Nature
      • By Ingredient
      • By End Use
      • By Packaging
      • By Distribution Channel
    • Key Takeaways
  15. Eastern Europe Market Analysis 2020 to 2024 and Forecast 2025 to 2035, By Country
    • Historical Market Size Value (USD billion) & Volume (metric tons) Trend Analysis By Market Taxonomy, 2020 to 2024
    • Market Size Value (USD billion) & Volume (metric tons) Forecast By Market Taxonomy, 2025 to 2035
      • By Country
        • Russia
        • Hungary
        • Poland
        • Balkan & Baltics
        • Rest of E. Europe
      • By Nature
      • By Ingredient
      • By End Use
      • By Packaging
      • By Distribution Channel
    • Market Attractiveness Analysis
      • By Country
      • By Nature
      • By Ingredient
      • By End Use
      • By Packaging
      • By Distribution Channel
    • Key Takeaways
  16. East Asia Market Analysis 2020 to 2024 and Forecast 2025 to 2035, By Country
    • Historical Market Size Value (USD billion) & Volume (metric tons) Trend Analysis By Market Taxonomy, 2020 to 2024
    • Market Size Value (USD billion) & Volume (metric tons) Forecast By Market Taxonomy, 2025 to 2035
      • By Country
        • China
        • Japan
        • South Korea
      • By Nature
      • By Ingredient
      • By End Use
      • By Packaging
      • By Distribution Channel
    • Market Attractiveness Analysis
      • By Country
      • By Nature
      • By Ingredient
      • By End Use
      • By Packaging
      • By Distribution Channel
    • Key Takeaways
  17. South Asia & Pacific Market Analysis 2020 to 2024 and Forecast 2025 to 2035, By Country
    • Historical Market Size Value (USD billion) & Volume (metric tons) Trend Analysis By Market Taxonomy, 2020 to 2024
    • Market Size Value (USD billion) & Volume (metric tons) Forecast By Market Taxonomy, 2025 to 2035
      • By Country
        • India
        • Australia & New Zealand
        • ASEAN
        • Rest of SAP
      • By Nature
      • By Ingredient
      • By End Use
      • By Packaging
      • By Distribution Channel
    • Market Attractiveness Analysis
      • By Country
      • By Nature
      • By Ingredient
      • By End Use
      • By Packaging
      • By Distribution Channel
    • Key Takeaways
  18. Middle East and Africa Market Analysis 2020 to 2024 and Forecast 2025 to 2035, By Country
    • Historical Market Size Value (USD billion) & Volume (metric tons) Trend Analysis By Market Taxonomy, 2020 to 2024
    • Market Size Value (USD billion) & Volume (metric tons) Forecast By Market Taxonomy, 2025 to 2035
      • By Country
        • GCC Countries
        • Northern Africa
        • South Africa
        • Turkiye
        • Rest of MEA
      • By Nature
      • By Ingredient
      • By End Use
      • By Packaging
      • By Distribution Channel
    • Market Attractiveness Analysis
      • By Country
      • By Nature
      • By Ingredient
      • By End Use
      • By Packaging
      • By Distribution Channel
    • Key Takeaways
  19. Key Countries Market Analysis
    • USA
      • Pricing Analysis
      • Market Share Analysis, 2024
        • By Nature
        • By Ingredient
        • By End Use
        • By Packaging
        • By Distribution Channel
    • Canada
      • Pricing Analysis
      • Market Share Analysis, 2024
        • By Nature
        • By Ingredient
        • By End Use
        • By Packaging
        • By Distribution Channel
    • Brazil
      • Pricing Analysis
      • Market Share Analysis, 2024
        • By Nature
        • By Ingredient
        • By End Use
        • By Packaging
        • By Distribution Channel
    • Mexico
      • Pricing Analysis
      • Market Share Analysis, 2024
        • By Nature
        • By Ingredient
        • By End Use
        • By Packaging
        • By Distribution Channel
    • Argentina
      • Pricing Analysis
      • Market Share Analysis, 2024
        • By Nature
        • By Ingredient
        • By End Use
        • By Packaging
        • By Distribution Channel
  20. Market Structure Analysis
    • Competition Dashboard
    • Competition Benchmarking
    • Market Share Analysis of Top Players
      • By Regional
      • By Nature
      • By Ingredient
      • By End Use
      • By Packaging
      • By Distribution Channel
  21. Competition Analysis
    • Competition Deep Dive
      • PepsiCo Ltd.
        • Overview
        • Product Portfolio
        • Profitability by Market Segments (Product/Age /Sales Channel/Region)
        • Sales Footprint
        • Strategy Overview
          • Marketing Strategy
          • Product Strategy
          • Channel Strategy
      • The Daily Juice Company
        • Overview
        • Product Portfolio
        • Profitability by Market Segments (Product/Age /Sales Channel/Region)
        • Sales Footprint
        • Strategy Overview
          • Marketing Strategy
          • Product Strategy
          • Channel Strategy
      • S.M. Jaleel & Co. Ltd.
        • Overview
        • Product Portfolio
        • Profitability by Market Segments (Product/Age /Sales Channel/Region)
        • Sales Footprint
        • Strategy Overview
          • Marketing Strategy
          • Product Strategy
          • Channel Strategy
      • Citrus World, Inc.
        • Overview
        • Product Portfolio
        • Profitability by Market Segments (Product/Age /Sales Channel/Region)
        • Sales Footprint
        • Strategy Overview
          • Marketing Strategy
          • Product Strategy
          • Channel Strategy
      • Citrosuco S.A.
        • Overview
        • Product Portfolio
        • Profitability by Market Segments (Product/Age /Sales Channel/Region)
        • Sales Footprint
        • Strategy Overview
          • Marketing Strategy
          • Product Strategy
          • Channel Strategy
      • Louis Dreyfus Company B.V.
        • Overview
        • Product Portfolio
        • Profitability by Market Segments (Product/Age /Sales Channel/Region)
        • Sales Footprint
        • Strategy Overview
          • Marketing Strategy
          • Product Strategy
          • Channel Strategy
      • Lemon Concentrate S.L.
        • Overview
        • Product Portfolio
        • Profitability by Market Segments (Product/Age /Sales Channel/Region)
        • Sales Footprint
        • Strategy Overview
          • Marketing Strategy
          • Product Strategy
          • Channel Strategy
      • Frunutex Sp. z o.o.
        • Overview
        • Product Portfolio
        • Profitability by Market Segments (Product/Age /Sales Channel/Region)
        • Sales Footprint
        • Strategy Overview
          • Marketing Strategy
          • Product Strategy
          • Channel Strategy
      • AGRANA Beteiligungs-AG.
        • Overview
        • Product Portfolio
        • Profitability by Market Segments (Product/Age /Sales Channel/Region)
        • Sales Footprint
        • Strategy Overview
          • Marketing Strategy
          • Product Strategy
          • Channel Strategy
  22. Assumptions & Acronyms Used
  23. Research Methodology

List of Tables

  • Table 1: Global Market Value (USD billion) Forecast by Region, 2020-2035
  • Table 2: Global Market Volume (metric tons) Forecast by Region, 2020-2035
  • Table 3: Global Market Value (USD billion) Forecast by Nature, 2020-2035
  • Table 4: Global Market Volume (metric tons) Forecast by Nature, 2020-2035
  • Table 5: Global Market Value (USD billion) Forecast by Ingredient, 2020-2035
  • Table 6: Global Market Volume (metric tons) Forecast by Ingredient, 2020-2035
  • Table 7: Global Market Value (USD billion) Forecast by End Use, 2020-2035
  • Table 8: Global Market Volume (metric tons) Forecast by End Use, 2020-2035
  • Table 9: Global Market Value (USD billion) Forecast by Packaging, 2020-2035
  • Table 10: Global Market Volume (metric tons) Forecast by Packaging, 2020-2035
  • Table 11: Global Market Value (USD billion) Forecast by Distribution Channel, 2020-2035
  • Table 12: Global Market Volume (metric tons) Forecast by Distribution Channel, 2020-2035
  • Table 13: North America Market Value (USD billion) Forecast by Country, 2020-2035
  • Table 14: North America Market Volume (metric tons) Forecast by Country, 2020-2035
  • Table 15: North America Market Value (USD billion) Forecast by Nature, 2020-2035
  • Table 16: North America Market Volume (metric tons) Forecast by Nature, 2020-2035
  • Table 17: North America Market Value (USD billion) Forecast by Ingredient, 2020-2035
  • Table 18: North America Market Volume (metric tons) Forecast by Ingredient, 2020-2035
  • Table 19: North America Market Value (USD billion) Forecast by End Use, 2020-2035
  • Table 20: North America Market Volume (metric tons) Forecast by End Use, 2020-2035
  • Table 21: North America Market Value (USD billion) Forecast by Packaging, 2020-2035
  • Table 22: North America Market Volume (metric tons) Forecast by Packaging, 2020-2035
  • Table 23: North America Market Value (USD billion) Forecast by Distribution Channel, 2020-2035
  • Table 24: North America Market Volume (metric tons) Forecast by Distribution Channel, 2020-2035
  • Table 25: Latin America Market Value (USD billion) Forecast by Country, 2020-2035
  • Table 26: Latin America Market Volume (metric tons) Forecast by Country, 2020-2035
  • Table 27: Latin America Market Value (USD billion) Forecast by Nature, 2020-2035
  • Table 28: Latin America Market Volume (metric tons) Forecast by Nature, 2020-2035
  • Table 29: Latin America Market Value (USD billion) Forecast by Ingredient, 2020-2035
  • Table 30: Latin America Market Volume (metric tons) Forecast by Ingredient, 2020-2035
  • Table 31: Latin America Market Value (USD billion) Forecast by End Use, 2020-2035
  • Table 32: Latin America Market Volume (metric tons) Forecast by End Use, 2020-2035
  • Table 33: Latin America Market Value (USD billion) Forecast by Packaging, 2020-2035
  • Table 34: Latin America Market Volume (metric tons) Forecast by Packaging, 2020-2035
  • Table 35: Latin America Market Value (USD billion) Forecast by Distribution Channel, 2020-2035
  • Table 36: Latin America Market Volume (metric tons) Forecast by Distribution Channel, 2020-2035
  • Table 37: Western Europe Market Value (USD billion) Forecast by Country, 2020-2035
  • Table 38: Western Europe Market Volume (metric tons) Forecast by Country, 2020-2035
  • Table 39: Western Europe Market Value (USD billion) Forecast by Nature, 2020-2035
  • Table 40: Western Europe Market Volume (metric tons) Forecast by Nature, 2020-2035
  • Table 41: Western Europe Market Value (USD billion) Forecast by Ingredient, 2020-2035
  • Table 42: Western Europe Market Volume (metric tons) Forecast by Ingredient, 2020-2035
  • Table 43: Western Europe Market Value (USD billion) Forecast by End Use, 2020-2035
  • Table 44: Western Europe Market Volume (metric tons) Forecast by End Use, 2020-2035
  • Table 45: Western Europe Market Value (USD billion) Forecast by Packaging, 2020-2035
  • Table 46: Western Europe Market Volume (metric tons) Forecast by Packaging, 2020-2035
  • Table 47: Western Europe Market Value (USD billion) Forecast by Distribution Channel, 2020-2035
  • Table 48: Western Europe Market Volume (metric tons) Forecast by Distribution Channel, 2020-2035
  • Table 49: Eastern Europe Market Value (USD billion) Forecast by Country, 2020-2035
  • Table 50: Eastern Europe Market Volume (metric tons) Forecast by Country, 2020-2035
  • Table 51: Eastern Europe Market Value (USD billion) Forecast by Nature, 2020-2035
  • Table 52: Eastern Europe Market Volume (metric tons) Forecast by Nature, 2020-2035
  • Table 53: Eastern Europe Market Value (USD billion) Forecast by Ingredient, 2020-2035
  • Table 54: Eastern Europe Market Volume (metric tons) Forecast by Ingredient, 2020-2035
  • Table 55: Eastern Europe Market Value (USD billion) Forecast by End Use, 2020-2035
  • Table 56: Eastern Europe Market Volume (metric tons) Forecast by End Use, 2020-2035
  • Table 57: Eastern Europe Market Value (USD billion) Forecast by Packaging, 2020-2035
  • Table 58: Eastern Europe Market Volume (metric tons) Forecast by Packaging, 2020-2035
  • Table 59: Eastern Europe Market Value (USD billion) Forecast by Distribution Channel, 2020-2035
  • Table 60: Eastern Europe Market Volume (metric tons) Forecast by Distribution Channel, 2020-2035
  • Table 61: East Asia Market Value (USD billion) Forecast by Country, 2020-2035
  • Table 62: East Asia Market Volume (metric tons) Forecast by Country, 2020-2035
  • Table 63: East Asia Market Value (USD billion) Forecast by Nature, 2020-2035
  • Table 64: East Asia Market Volume (metric tons) Forecast by Nature, 2020-2035
  • Table 65: East Asia Market Value (USD billion) Forecast by Ingredient, 2020-2035
  • Table 66: East Asia Market Volume (metric tons) Forecast by Ingredient, 2020-2035
  • Table 67: East Asia Market Value (USD billion) Forecast by End Use, 2020-2035
  • Table 68: East Asia Market Volume (metric tons) Forecast by End Use, 2020-2035
  • Table 69: East Asia Market Value (USD billion) Forecast by Packaging, 2020-2035
  • Table 70: East Asia Market Volume (metric tons) Forecast by Packaging, 2020-2035
  • Table 71: East Asia Market Value (USD billion) Forecast by Distribution Channel, 2020-2035
  • Table 72: East Asia Market Volume (metric tons) Forecast by Distribution Channel, 2020-2035
  • Table 73: South Asia & Pacific Market Value (USD billion) Forecast by Country, 2020-2035
  • Table 74: South Asia & Pacific Market Volume (metric tons) Forecast by Country, 2020-2035
  • Table 75: South Asia & Pacific Market Value (USD billion) Forecast by Nature, 2020-2035
  • Table 76: South Asia & Pacific Market Volume (metric tons) Forecast by Nature, 2020-2035
  • Table 77: South Asia & Pacific Market Value (USD billion) Forecast by Ingredient, 2020-2035
  • Table 78: South Asia & Pacific Market Volume (metric tons) Forecast by Ingredient, 2020-2035
  • Table 79: South Asia & Pacific Market Value (USD billion) Forecast by End Use, 2020-2035
  • Table 80: South Asia & Pacific Market Volume (metric tons) Forecast by End Use, 2020-2035
  • Table 81: South Asia & Pacific Market Value (USD billion) Forecast by Packaging, 2020-2035
  • Table 82: South Asia & Pacific Market Volume (metric tons) Forecast by Packaging, 2020-2035
  • Table 83: South Asia & Pacific Market Value (USD billion) Forecast by Distribution Channel, 2020-2035
  • Table 84: South Asia & Pacific Market Volume (metric tons) Forecast by Distribution Channel, 2020-2035
  • Table 85: Middle East and Africa Market Value (USD billion) Forecast by Country, 2020-2035
  • Table 86: Middle East and Africa Market Volume (metric tons) Forecast by Country, 2020-2035
  • Table 87: Middle East and Africa Market Value (USD billion) Forecast by Nature, 2020-2035
  • Table 88: Middle East and Africa Market Volume (metric tons) Forecast by Nature, 2020-2035
  • Table 89: Middle East and Africa Market Value (USD billion) Forecast by Ingredient, 2020-2035
  • Table 90: Middle East and Africa Market Volume (metric tons) Forecast by Ingredient, 2020-2035
  • Table 91: Middle East and Africa Market Value (USD billion) Forecast by End Use, 2020-2035
  • Table 92: Middle East and Africa Market Volume (metric tons) Forecast by End Use, 2020-2035
  • Table 93: Middle East and Africa Market Value (USD billion) Forecast by Packaging, 2020-2035
  • Table 94: Middle East and Africa Market Volume (metric tons) Forecast by Packaging, 2020-2035
  • Table 95: Middle East and Africa Market Value (USD billion) Forecast by Distribution Channel, 2020-2035
  • Table 96: Middle East and Africa Market Volume (metric tons) Forecast by Distribution Channel, 2020-2035

List of Figures

  • Figure 1: Global Market Volume (metric tons) Forecast 2020-2035
  • Figure 2: Global Market Pricing Analysis
  • Figure 3: Global Market Value (USD billion) Forecast 2020-2035
  • Figure 4: Global Market Value Share and BPS Analysis by Nature, 2025 and 2035
  • Figure 5: Global Market Y-o-Y Growth Comparison by Nature, 2025-2035
  • Figure 6: Global Market Attractiveness Analysis by Nature
  • Figure 7: Global Market Value Share and BPS Analysis by Ingredient, 2025 and 2035
  • Figure 8: Global Market Y-o-Y Growth Comparison by Ingredient, 2025-2035
  • Figure 9: Global Market Attractiveness Analysis by Ingredient
  • Figure 10: Global Market Value Share and BPS Analysis by End Use, 2025 and 2035
  • Figure 11: Global Market Y-o-Y Growth Comparison by End Use, 2025-2035
  • Figure 12: Global Market Attractiveness Analysis by End Use
  • Figure 13: Global Market Value Share and BPS Analysis by Packaging, 2025 and 2035
  • Figure 14: Global Market Y-o-Y Growth Comparison by Packaging, 2025-2035
  • Figure 15: Global Market Attractiveness Analysis by Packaging
  • Figure 16: Global Market Value Share and BPS Analysis by Distribution Channel, 2025 and 2035
  • Figure 17: Global Market Y-o-Y Growth Comparison by Distribution Channel, 2025-2035
  • Figure 18: Global Market Attractiveness Analysis by Distribution Channel
  • Figure 19: Global Market Value (USD billion) Share and BPS Analysis by Region, 2025 and 2035
  • Figure 20: Global Market Y-o-Y Growth Comparison by Region, 2025-2035
  • Figure 21: Global Market Attractiveness Analysis by Region
  • Figure 22: North America Market Incremental $ Opportunity, 2025-2035
  • Figure 23: Latin America Market Incremental $ Opportunity, 2025-2035
  • Figure 24: Western Europe Market Incremental $ Opportunity, 2025-2035
  • Figure 25: Eastern Europe Market Incremental $ Opportunity, 2025-2035
  • Figure 26: East Asia Market Incremental $ Opportunity, 2025-2035
  • Figure 27: South Asia & Pacific Market Incremental $ Opportunity, 2025-2035
  • Figure 28: Middle East and Africa Market Incremental $ Opportunity, 2025-2035
  • Figure 29: North America Market Value Share and BPS Analysis by Country, 2025 and 2035
  • Figure 30: North America Market Value Share and BPS Analysis by Nature, 2025 and 2035
  • Figure 31: North America Market Y-o-Y Growth Comparison by Nature, 2025-2035
  • Figure 32: North America Market Attractiveness Analysis by Nature
  • Figure 33: North America Market Value Share and BPS Analysis by Ingredient, 2025 and 2035
  • Figure 34: North America Market Y-o-Y Growth Comparison by Ingredient, 2025-2035
  • Figure 35: North America Market Attractiveness Analysis by Ingredient
  • Figure 36: North America Market Value Share and BPS Analysis by End Use, 2025 and 2035
  • Figure 37: North America Market Y-o-Y Growth Comparison by End Use, 2025-2035
  • Figure 38: North America Market Attractiveness Analysis by End Use
  • Figure 39: North America Market Value Share and BPS Analysis by Packaging, 2025 and 2035
  • Figure 40: North America Market Y-o-Y Growth Comparison by Packaging, 2025-2035
  • Figure 41: North America Market Attractiveness Analysis by Packaging
  • Figure 42: North America Market Value Share and BPS Analysis by Distribution Channel, 2025 and 2035
  • Figure 43: North America Market Y-o-Y Growth Comparison by Distribution Channel, 2025-2035
  • Figure 44: North America Market Attractiveness Analysis by Distribution Channel
  • Figure 45: Latin America Market Value Share and BPS Analysis by Country, 2025 and 2035
  • Figure 46: Latin America Market Value Share and BPS Analysis by Nature, 2025 and 2035
  • Figure 47: Latin America Market Y-o-Y Growth Comparison by Nature, 2025-2035
  • Figure 48: Latin America Market Attractiveness Analysis by Nature
  • Figure 49: Latin America Market Value Share and BPS Analysis by Ingredient, 2025 and 2035
  • Figure 50: Latin America Market Y-o-Y Growth Comparison by Ingredient, 2025-2035
  • Figure 51: Latin America Market Attractiveness Analysis by Ingredient
  • Figure 52: Latin America Market Value Share and BPS Analysis by End Use, 2025 and 2035
  • Figure 53: Latin America Market Y-o-Y Growth Comparison by End Use, 2025-2035
  • Figure 54: Latin America Market Attractiveness Analysis by End Use
  • Figure 55: Latin America Market Value Share and BPS Analysis by Packaging, 2025 and 2035
  • Figure 56: Latin America Market Y-o-Y Growth Comparison by Packaging, 2025-2035
  • Figure 57: Latin America Market Attractiveness Analysis by Packaging
  • Figure 58: Latin America Market Value Share and BPS Analysis by Distribution Channel, 2025 and 2035
  • Figure 59: Latin America Market Y-o-Y Growth Comparison by Distribution Channel, 2025-2035
  • Figure 60: Latin America Market Attractiveness Analysis by Distribution Channel
  • Figure 61: Western Europe Market Value Share and BPS Analysis by Country, 2025 and 2035
  • Figure 62: Western Europe Market Value Share and BPS Analysis by Nature, 2025 and 2035
  • Figure 63: Western Europe Market Y-o-Y Growth Comparison by Nature, 2025-2035
  • Figure 64: Western Europe Market Attractiveness Analysis by Nature
  • Figure 65: Western Europe Market Value Share and BPS Analysis by Ingredient, 2025 and 2035
  • Figure 66: Western Europe Market Y-o-Y Growth Comparison by Ingredient, 2025-2035
  • Figure 67: Western Europe Market Attractiveness Analysis by Ingredient
  • Figure 68: Western Europe Market Value Share and BPS Analysis by End Use, 2025 and 2035
  • Figure 69: Western Europe Market Y-o-Y Growth Comparison by End Use, 2025-2035
  • Figure 70: Western Europe Market Attractiveness Analysis by End Use
  • Figure 71: Western Europe Market Value Share and BPS Analysis by Packaging, 2025 and 2035
  • Figure 72: Western Europe Market Y-o-Y Growth Comparison by Packaging, 2025-2035
  • Figure 73: Western Europe Market Attractiveness Analysis by Packaging
  • Figure 74: Western Europe Market Value Share and BPS Analysis by Distribution Channel, 2025 and 2035
  • Figure 75: Western Europe Market Y-o-Y Growth Comparison by Distribution Channel, 2025-2035
  • Figure 76: Western Europe Market Attractiveness Analysis by Distribution Channel
  • Figure 77: Eastern Europe Market Value Share and BPS Analysis by Country, 2025 and 2035
  • Figure 78: Eastern Europe Market Value Share and BPS Analysis by Nature, 2025 and 2035
  • Figure 79: Eastern Europe Market Y-o-Y Growth Comparison by Nature, 2025-2035
  • Figure 80: Eastern Europe Market Attractiveness Analysis by Nature
  • Figure 81: Eastern Europe Market Value Share and BPS Analysis by Ingredient, 2025 and 2035
  • Figure 82: Eastern Europe Market Y-o-Y Growth Comparison by Ingredient, 2025-2035
  • Figure 83: Eastern Europe Market Attractiveness Analysis by Ingredient
  • Figure 84: Eastern Europe Market Value Share and BPS Analysis by End Use, 2025 and 2035
  • Figure 85: Eastern Europe Market Y-o-Y Growth Comparison by End Use, 2025-2035
  • Figure 86: Eastern Europe Market Attractiveness Analysis by End Use
  • Figure 87: Eastern Europe Market Value Share and BPS Analysis by Packaging, 2025 and 2035
  • Figure 88: Eastern Europe Market Y-o-Y Growth Comparison by Packaging, 2025-2035
  • Figure 89: Eastern Europe Market Attractiveness Analysis by Packaging
  • Figure 90: Eastern Europe Market Value Share and BPS Analysis by Distribution Channel, 2025 and 2035
  • Figure 91: Eastern Europe Market Y-o-Y Growth Comparison by Distribution Channel, 2025-2035
  • Figure 92: Eastern Europe Market Attractiveness Analysis by Distribution Channel
  • Figure 93: East Asia Market Value Share and BPS Analysis by Country, 2025 and 2035
  • Figure 94: East Asia Market Value Share and BPS Analysis by Nature, 2025 and 2035
  • Figure 95: East Asia Market Y-o-Y Growth Comparison by Nature, 2025-2035
  • Figure 96: East Asia Market Attractiveness Analysis by Nature
  • Figure 97: East Asia Market Value Share and BPS Analysis by Ingredient, 2025 and 2035
  • Figure 98: East Asia Market Y-o-Y Growth Comparison by Ingredient, 2025-2035
  • Figure 99: East Asia Market Attractiveness Analysis by Ingredient
  • Figure 100: East Asia Market Value Share and BPS Analysis by End Use, 2025 and 2035
  • Figure 101: East Asia Market Y-o-Y Growth Comparison by End Use, 2025-2035
  • Figure 102: East Asia Market Attractiveness Analysis by End Use
  • Figure 103: East Asia Market Value Share and BPS Analysis by Packaging, 2025 and 2035
  • Figure 104: East Asia Market Y-o-Y Growth Comparison by Packaging, 2025-2035
  • Figure 105: East Asia Market Attractiveness Analysis by Packaging
  • Figure 106: East Asia Market Value Share and BPS Analysis by Distribution Channel, 2025 and 2035
  • Figure 107: East Asia Market Y-o-Y Growth Comparison by Distribution Channel, 2025-2035
  • Figure 108: East Asia Market Attractiveness Analysis by Distribution Channel
  • Figure 109: South Asia & Pacific Market Value Share and BPS Analysis by Country, 2025 and 2035
  • Figure 110: South Asia & Pacific Market Value Share and BPS Analysis by Nature, 2025 and 2035
  • Figure 111: South Asia & Pacific Market Y-o-Y Growth Comparison by Nature, 2025-2035
  • Figure 112: South Asia & Pacific Market Attractiveness Analysis by Nature
  • Figure 113: South Asia & Pacific Market Value Share and BPS Analysis by Ingredient, 2025 and 2035
  • Figure 114: South Asia & Pacific Market Y-o-Y Growth Comparison by Ingredient, 2025-2035
  • Figure 115: South Asia & Pacific Market Attractiveness Analysis by Ingredient
  • Figure 116: South Asia & Pacific Market Value Share and BPS Analysis by End Use, 2025 and 2035
  • Figure 117: South Asia & Pacific Market Y-o-Y Growth Comparison by End Use, 2025-2035
  • Figure 118: South Asia & Pacific Market Attractiveness Analysis by End Use
  • Figure 119: South Asia & Pacific Market Value Share and BPS Analysis by Packaging, 2025 and 2035
  • Figure 120: South Asia & Pacific Market Y-o-Y Growth Comparison by Packaging, 2025-2035
  • Figure 121: South Asia & Pacific Market Attractiveness Analysis by Packaging
  • Figure 122: South Asia & Pacific Market Value Share and BPS Analysis by Distribution Channel, 2025 and 2035
  • Figure 123: South Asia & Pacific Market Y-o-Y Growth Comparison by Distribution Channel, 2025-2035
  • Figure 124: South Asia & Pacific Market Attractiveness Analysis by Distribution Channel
  • Figure 125: Middle East and Africa Market Value Share and BPS Analysis by Country, 2025 and 2035
  • Figure 126: Middle East and Africa Market Value Share and BPS Analysis by Nature, 2025 and 2035
  • Figure 127: Middle East and Africa Market Y-o-Y Growth Comparison by Nature, 2025-2035
  • Figure 128: Middle East and Africa Market Attractiveness Analysis by Nature
  • Figure 129: Middle East and Africa Market Value Share and BPS Analysis by Ingredient, 2025 and 2035
  • Figure 130: Middle East and Africa Market Y-o-Y Growth Comparison by Ingredient, 2025-2035
  • Figure 131: Middle East and Africa Market Attractiveness Analysis by Ingredient
  • Figure 132: Middle East and Africa Market Value Share and BPS Analysis by End Use, 2025 and 2035
  • Figure 133: Middle East and Africa Market Y-o-Y Growth Comparison by End Use, 2025-2035
  • Figure 134: Middle East and Africa Market Attractiveness Analysis by End Use
  • Figure 135: Middle East and Africa Market Value Share and BPS Analysis by Packaging, 2025 and 2035
  • Figure 136: Middle East and Africa Market Y-o-Y Growth Comparison by Packaging, 2025-2035
  • Figure 137: Middle East and Africa Market Attractiveness Analysis by Packaging
  • Figure 138: Middle East and Africa Market Value Share and BPS Analysis by Distribution Channel, 2025 and 2035
  • Figure 139: Middle East and Africa Market Y-o-Y Growth Comparison by Distribution Channel, 2025-2035
  • Figure 140: Middle East and Africa Market Attractiveness Analysis by Distribution Channel
  • Figure 141: Global Market - Tier Structure Analysis
  • Figure 142: Global Market - Company Share Analysis

Frequently Asked Questions

What is the projected size of the reconstituted juice market in 2025?

The market size is estimated at USD 14.3 billion in 2025.

How much is the reconstituted juice market expected to reach by 2035?

The market is projected to reach USD 24.6 billion by 2035, expanding at a CAGR of 5.5%.

Which nature type dominates the reconstituted juice market in 2025?

The conventional segment is expected to dominate with the highest market share of 72% in 2025.

Which end-use sector holds the leading share in the reconstituted juice market?

The retail/household sector is projected to lead the end-use segment with 66% market share in 2025.

Which country is expected to witness the fastest growth in the reconstituted juice market?

The USA is anticipated to register the fastest growth at a CAGR of 4.9% from 2025 to 2035.

Explore Similar Insights

Future Market Insights

Reconstituted Juice Market