Juice Extraction Equipment Market Outlook (2023 to 2033)

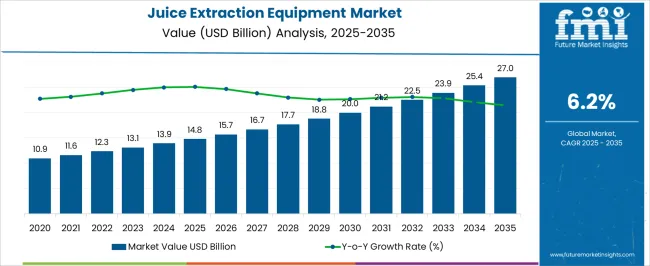
During the projected period (2023 to 2033), the global juice extraction equipment market is expected to grow at a CAGR of 6.2%. The juice extraction equipment market is projected to reach a valuation of US$ 23,906.5 Million by 2033 from US$ 13,100 Million in 2023.

Fruit & vegetable juice extractors and blenders are useful tools for extracting juice. The juice extraction equipment is multitasking and capable of conducting a wide variety of tasks. It has a high-powered motor. Extracts of all kinds are becoming increasingly popular in recent years. Juicers come in three different types, namely, centrifugal, titrating, and masticating.

High consumption of fruit juices owing to increasing health consciousness among consumers is projected to drive the global juice extraction equipment market in the next ten years. Besides, increasing demand for milkshakes and smoothies in both developing and developed countries is likely to push the market forward.

Various international and local companies are coming up with state-of-the-art beverages consisting of fruit juices to expand their product portfolios and attract a large client base. In January 2021, for instance, FMCG major CavinKare introduced a series of fruit-based carbonated drinks to expand its beverage portfolio. The company’s new beverages include immunity-supporting ingredients such as vitamin D, A, and zinc.

In September 2022, the Campari Group unveiled X-Rated, its new popular fusion liqueur in the Indian market. It is made with ultra-premium vodka sourced from the Ardennes and Champagne regions of France. It is mainly popular among the millennials and is a tropical mango, ultra-premium French vodka, passion fruit juice sourced from Brazil, and blood oranges from Sicily in Italy.

Many large-scale and start-up companies worldwide are engaging in social media marketing, as well as influencer marketing by hiring celebrities and sports personalities to launch their products in the market. In September 2022, 1NE, a leading seasoning and beverage brand under the subsidiary of Livinia foods, joined hands with renowned actress Mouni Roy to launch its new line of trendy fruit juices. The coconut and aloe vera flavored beverages are infused with immunity-boosting abilities.

Some of the chocolate and confectionery companies are also including real fruit juice in their in-house products to enhance their texture and taste. In July 2022, Fruit-tella, the Perfetti Van Melle-owned candy brand, introduced its new fruit stack ice lollies made with real fruit juice in the Food Warehouse and Iceland. The fruit stack lolly blends three Fruit-Tella flavors into one ice cream, including strawberry, lemon, and orange. The product has low salt, sugar, and fat content.

Attributes Key Insights
Global Juice Extraction Equipment Market Estimated Size (2023E) US$ 13,100 Million
Projected Market Valuation (2033F) US$ 23,906.5 Million
Value-based CAGR (2023 to 2033) 6.2%
Market Share of North America 28%

Don't pay for what you don't need

Customize your report by selecting specific countries or regions and save 30%!

2018 to 2022 Global Juice Extraction Equipment Market Outlook Compared to 2023 to 2033 Demand Forecast

During the historical period of 2018 to 2022, the global juice extraction equipment market exhibited considerable growth at a CAGR of nearly 4.3%. The advent of cold-pressed juices, the adoption of healthier diets, changes in consumer tastes, and surging demand for fruit juices all contribute to growth in the global juice extraction equipment market.

Consumers are nowadays opting for healthy food choices that would help them prevent chronic diseases, meet their nutritional requirements, and maintain their body weight. The rising shift of consumers towards healthy juices from aerated soda, which contains excessive sugar and preservatives, is another crucial factor that is estimated to drive the global juice extraction equipment market in the next ten years.
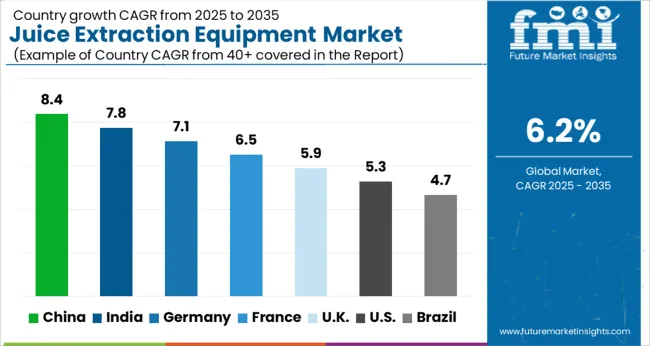
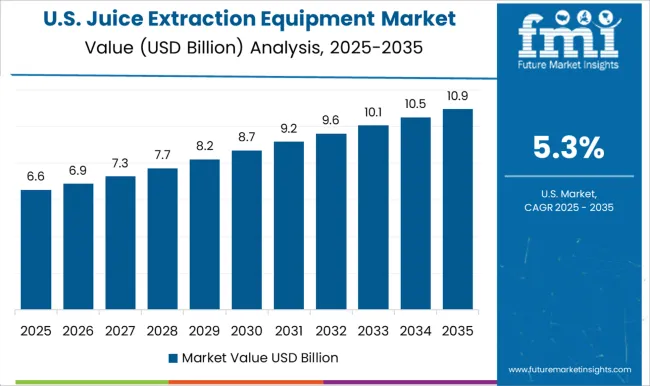
Country-wise Insights

How are the USA-based Juice Extraction Equipment Companies Performing?

High Demand for Orange Juice in the USA to Push Sales of Juice Extraction Machines

Americans are starting to prefer raw fruits over fruit juices and that is why the demand for fruit juice extraction equipment for domestic use is decreasing. However, sales of packed juices and beverages are rising due to the growing trend of on-the-go snacking. People in the USA are nowadays preferring orange juice as it is considered to be healthier than the other commonly available fruit juices. Thus, the USA juice extraction equipment market is expected to witness steady growth in the assessment period.

Why is India Witnessing High Demand for Juice Extraction Equipment?

High Demand for Organic Beverages to Drive Sales of Fruit Pulp Extractors in India

The Indian fruit juice industry is primarily driven by various factors such as increased health consciousness and the high disposable income of consumers. Therefore, demand for organic beverages over carbonated beverages that are free of added sugar, artificial flavors, and preservatives is growing at a rapid pace in the country.

Many international fruit juice brands are preferring India for setting up their manufacturing facilities owing to the low cost of labor and raw materials. They are also targeting children and millennials to sell their products, which would drive the Indian juice extraction equipment market.

How is Juice Extraction Equipment Manufacturers Entering Canada for Business?

Rising Preference for Low-sugar Drinks to Boost the Demand for Pulp Extraction Machines in Canada

Canadians have been topping the list when it comes to the consumption of fruit juice. They mainly prefer freshly produced fruit juice rather than packed juices. Thus, the Canadian juice extraction equipment market is projected to witness rapid growth in the evaluation period.

However, there have been concerns over the sugar content in fruit juices, and many Canadians are starting to prefer to eat whole fruits over 100% fruit juice. Therefore, several manufacturers will have to come up with new technologies where the juice retains the fibers present in the fruit as well.
Nandini Roy Choudhury

Principal Consultant

Talk to Analyst

Find your sweet spots for generating winning opportunities in this market.

Category-wise Insights

Which is the Most Preferred Type of Juice Extraction Equipment?

Demand for Masticating Fruit Juice Extraction Machines to Surge by the End of 2033

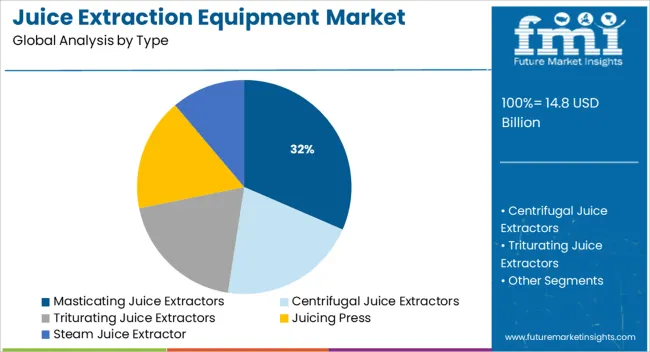
By type, the masticating juicer segment is projected to lead the global juice extraction equipment market in the next ten years. The auger in a masticating juicer, also known as a slow juicer, crushes the fruits and vegetables as they pass through the chute, and then squeezes them to separate the juice and pulp.

The pulp will be put into a separate container while the juice passes through a mesh. Though they are a bit more expensive than centrifugal juicers, the quality of juice is much better than that of centrifugal juicers. Triturating juicers may provide a better quality of juice than masticating juicers, but they cost much more.

Competitive Landscape

Key companies operating in the global juice extraction equipment market are facing intense competition from local players. The presence of small-scale firms that sell their products at slightly lesser prices is causing the market to be highly fragmented. It is thus compelling international companies to upgrade their existing portfolios and introduce affordable products for customers worldwide.

For instance:

  • In July 2022, Hamilton Beach Professional announced its plan to launch its professional juicer mixer grinder (JMG) in the Indian market. It has joined hands with Indian engineers and culinary experts to better understand the country’s kitchens to develop a new product that would offer superior performance.

Juicing for Good Health: Get the Squeeze on the Best Juice Extraction Equipment from Phillips, Kuvings, and Hamilton Beach

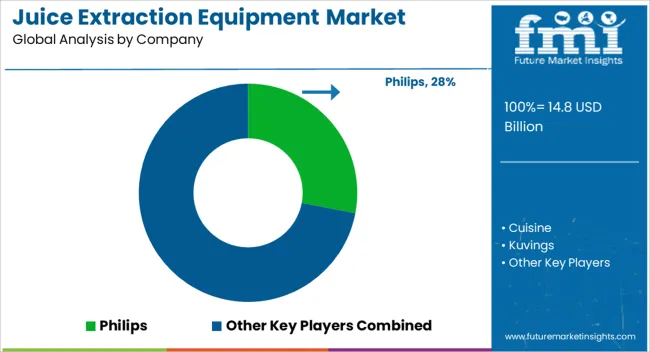
Many companies are installing juice extraction equipment in their offices to improve their employees’ health. Juice extraction equipment removes more nutrients, as compared to a blender or food processor, which enhances health even further. Additionally, juice extraction equipment is relatively easy to clean up and takes up very little space in an office setting. The top three leading players are using different strategies to remain at the forefront in this field.

Royal Philips Group of the Netherlands is a diverse technology firm focusing on enhancing people's lives via significant innovation in healthcare, consumer lifestyle, and lighting. The firm is a pioneer in cardiac care, acute care, and home healthcare, as well as energy-efficient lighting solutions and innovative lighting applications, male shaving & grooming, and oral healthcare. Phillips juice extractor is one of the many products manufactured by Philips. It also includes an automatic pulp ejection system so that the user does not have to worry about getting their hands dirty.

Kuvings, on the other hand, is another popular kitchen appliance brand among health-conscious consumers in over 80 countries. The firm strives to provide high-quality goods that make healthy living easier, more convenient, and enjoyable.

Products manufactured by Kuvings are trusted by people all around the world, and the firm continues to strive for quality in all aspects of its operations. Kuvings have become a vital component of new residences, cafés, restaurants, and cold press juice businesses.

The company offers two premium-level machines with a unique extraction method that promises better juice and reduced oxidation. This is accomplished through an innovative twin-gear system, which grinds up the produce at twice the speed of other juicers while using half as much power.

Likewise, Hamilton Beach Brands Holding Company currently operates through its wholly-owned subsidiary Hamilton Beach Brands, Inc., which is a leading designer, marketer, and distributor of branded small electric household and specialty housewares appliances, as well as commercial products for restaurants, fast food chains, bars, and hotels. Hamilton Beach, Proctor Silex, Hamilton Beach Professional, Weston, TrueAir, Brightline, and Hamilton Beach Health are some of the company's consumer trademarks. Commercial brands held by the company include Hamilton Beach Commercial and Proctor Silex Commercial.

Hamilton Beach Juice Extractor 67650A is a top-of-its-kind product. It has various features that help it to stand out from other products available on the market. This machine is highly rated by customers, as well as experts who have reviewed it. They have given a 4-star rating to the Hamilton beach juicer which makes it one of the best-selling products online.

Get the data you need at a Fraction of the cost

Personalize your report by choosing insights you need
and save 40%!

Scope of the Juice Extraction Equipment Market Report

Attribute Details
Estimated Market Size (2023) US$ 13,100 Million
Projected Market Valuation (2033) US$ 23,906.5 Million
Value-based CAGR (2023 to 2033) 6.2%
Forecast Period 2023 to 2033
Historical Data Available for 2017 to 2021
Market Analysis Value (US$ Million)
Key Regions Covered North America; Latin America; Europe; South Asia; East Asia; Oceania; Middle East and Africa (MEA)
Key Countries Covered USA, Canada, Mexico, Germany, UK, France, Italy, Spain, China, Japan, India, South Korea, Australia, Brazil, Argentina, South Africa, UAE
Key Segments Covered Type, Application, Use, Distribution Channel, Region
Key Companies Profiled Phillips; Cuisine; Kuvings; Braun; Hamilton Beach; Breville Chefs Star; Breville; Omega; Jack LaLanne; Cuisinart; Hurom; Philips; Kenwood; Guangdong Xinbao Electrical Appliances Holdings Co. Ltd.; Panasonic
Report Coverage Market Forecast, Company Share Analysis, Competitive Landscape, Drivers, Restraints, Opportunities and Threats Analysis, Market Dynamics and Challenges, and Strategic Growth Initiatives

Juice Extraction Equipment Market Outlook by Category

By Type:

  • Masticating Juice Extractors
  • Centrifugal Juice Extractors
  • Triturating Juice Extractors
  • Juicing Press
  • Steam Juice Extractor

By Application:

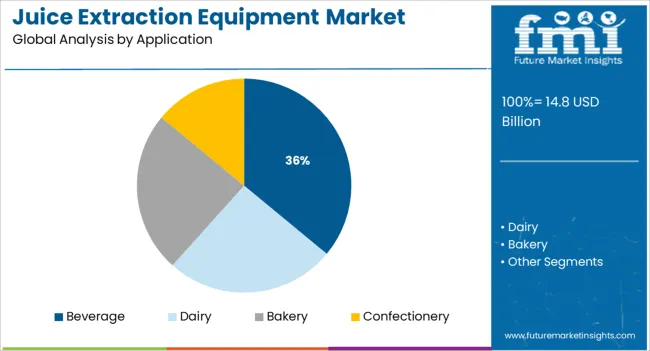
  • Dairy
  • Beverage
  • Bakery
  • Confectionery
  • Others

By Use:

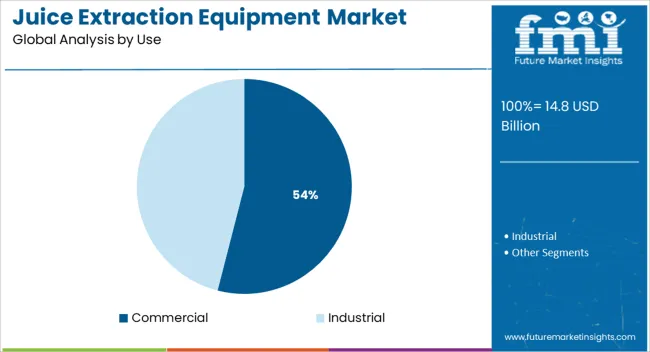
  • Commercial Juice Extractors
  • Industrial Juice Extractors

By Distribution Channel:

  • Internet Retailing
  • Mass Retailers
  • Direct Selling

By Region:

  • North America
  • Latin America
  • Europe
  • East Asia
  • South Asia
  • Oceania
  • Middle East and Africa (MEA)

Frequently Asked Questions

How big is the juice extraction equipment market?

The juice extraction equipment market size is expected to reach US$ 13,100.0 Million by the end of 2023.

At what rate is the juice extraction equipment market expected to rise?

The juice extraction equipment market is expected to rise at a CAGR of 6.2% in the forecast period.

What is the value share of the North America juice extraction equipment market?

North America holds around 28% of share in the juice extraction equipment market.

Which are the major countries driving demand in the juice extraction equipment market?

The USA, India, China, the UK, Germany, and Australia are the major countries driving demand in the juice extraction equipment market.

What is Europe’s share in the global juice extraction equipment market?

The juice extraction equipment market in Europe accounts for 33% of the global share.

At what rate will the China juice extraction equipment market grow?

The China juice extraction equipment market is projected to grow at a CAGR of around 6.38% over the next ten years.

At what rate will the Germany juice extraction equipment market grow?

The Germany juice extraction equipment market is projected to grow at a CAGR of around 4.93% over the next ten years.

Who are the top players operating in the juice extraction equipment market?

Phillips, Cuisine, Kuvings, Braun, and Hamilton Beach are the top players in the juice extraction equipment market.

What is the demand outlook forecast for the juice extraction equipment market?

The global juice extraction equipment market is expected to surpass US$ 23,906.5 Million by the end of 2033.

Table of Content
1. Executive Summary | Juice Extraction Equipment Market
    1.1. Global Market Outlook
    1.2. Demand-side Trends
    1.3. Supply-side Trends
    1.4. Technology Roadmap Analysis
    1.5. Analysis and Recommendations
2. Market Overview
    2.1. Market Coverage / Taxonomy
    2.2. Market Definition / Scope / Limitations
3. Market Background
    3.1. Market Dynamics
        3.1.1. Drivers
        3.1.2. Restraints
        3.1.3. Opportunity
        3.1.4. Trends
    3.2. Scenario Forecast
        3.2.1. Demand in Optimistic Scenario
        3.2.2. Demand in Likely Scenario
        3.2.3. Demand in Conservative Scenario
    3.3. Product launches & Recent Developments
    3.4. Product Life Cycle Analysis
    3.5. Value Chain Analysis
        3.5.1. Supply Side Participants and their Roles
            3.5.1.1. Producers
            3.5.1.2. Mid-Level Participants (Traders/ Agents/ Brokers)
            3.5.1.3. Wholesalers and Distributors
        3.5.2. % of Operating Margin Analysis
        3.5.3. List of Raw Material Suppliers
        3.5.4. List of Existing and Potential Buyers
    3.6. Global Market - Pricing Analysis
        3.6.1. Price Point Assessment by Region
        3.6.2. Price Point Assessment by Type
        3.6.3. Price Forecast till 2033
        3.6.4. Factors affecting Pricing
    3.7. Forecast Factors - Relevance & Impact
    3.8. Regulatory Landscape
        3.8.1. Packaging & Labelling Regulations
        3.8.2. Certifications and Certifying Agency Overview
        3.8.3. Import/Export Policies
    3.9. Regional Parent Market Outlook
    3.10. Consumers Survey Analysis
    3.11. Macro-Economic Factors
    3.12. Product Claims & Nutritional Information scanned by Buyers
4. Global Market Analysis 2018 to 2022 and Forecast, 2023 to 2033
    4.1. Historical Market Size Value (US$ Million) & Volume (MT) Analysis, 2018 to 2022
    4.2. Current and Future Market Size Value (US$ Million) & Volume (MT) Projections, 2023 to 2033
        4.2.1. Y-o-Y Growth Trend Analysis
        4.2.2. Absolute $ Opportunity Analysis
5. Global Market Analysis 2018 to 2022 and Forecast 2023 to 2033, By Type
    5.1. Introduction / Key Findings
    5.2. Historical Market Size Value (US$ Million) & Volume (MT) Analysis By Type, 2018 to 2022
    5.3. Current and Future Market Size Value (US$ Million) & Volume (MT) Analysis and Forecast By Type, 2023 to 2033
        5.3.1. Masticating Juice Extractors
        5.3.2. Centrifugal Juice Extractors
        5.3.3. Triturating Juice Extractors
        5.3.4. Juicing press
        5.3.5. Steam juice extractor
    5.4. Y-o-Y Growth Trend Analysis By Type, 2018 to 2022
    5.5. Absolute $ Opportunity Analysis By Type, 2023 to 2033
6. Global Market Analysis 2018 to 2022 and Forecast 2023 to 2033, By Application
    6.1. Introduction / Key Findings
    6.2. Historical Market Size Value (US$ Million) & Volume (MT) Analysis By Application, 2018 to 2022
    6.3. Current and Future Market Size Value (US$ Million) & Volume (MT) Analysis and Forecast By Application, 2023 to 2033
        6.3.1. Dairy
        6.3.2. Beverage
        6.3.3. Bakery
        6.3.4. Confectionery
    6.4. Y-o-Y Growth Trend Analysis By Application, 2018 to 2022
    6.5. Absolute $ Opportunity Analysis By Application, 2023 to 2033
7. Global Market Analysis 2018 to 2022 and Forecast 2023 to 2033, By Use
    7.1. Introduction / Key Findings
    7.2. Historical Market Size Value (US$ Million) & Volume (MT) Analysis By Use, 2018 to 2022
    7.3. Current and Future Market Size Value (US$ Million) & Volume (MT) Analysis and Forecast By Use, 2023 to 2033
        7.3.1. Commercial
        7.3.2. Industrial
    7.4. Y-o-Y Growth Trend Analysis By Use, 2018 to 2022
    7.5. Absolute $ Opportunity Analysis By Use, 2023 to 2033
8. Global Market Analysis 2018 to 2022 and Forecast 2023 to 2033, By Distribution Channel
    8.1. Introduction / Key Findings
    8.2. Historical Market Size Value (US$ Million) & Volume (MT) Analysis By Distribution Channel, 2018 to 2022
    8.3. Current and Future Market Size Value (US$ Million) & Volume (MT) Analysis and Forecast By Distribution Channel, 2023 to 2033
        8.3.1. Internet Retailing
        8.3.2. Mass Retailers
        8.3.3. Direct Selling
    8.4. Y-o-Y Growth Trend Analysis By Distribution Channel, 2018 to 2022
    8.5. Absolute $ Opportunity Analysis By Distribution Channel, 2023 to 2033
9. Global Market Analysis 2018 to 2022 and Forecast 2023 to 2033, By Region
    9.1. Introduction
    9.2. Historical Market Size Value (US$ Million) & Volume (MT) Analysis By Region, 2018 to 2022
    9.3. Current Market Size Value (US$ Million) & Volume (MT) Analysis and Forecast By Region, 2023 to 2033
        9.3.1. North America
        9.3.2. Latin America
        9.3.3. Europe
        9.3.4. East Asia
        9.3.5. South Asia
        9.3.6. Oceania
        9.3.7. Middle East and Africa (MEA)
    9.4. Market Attractiveness Analysis By Region
10. North America Market Analysis 2018 to 2022 and Forecast 2023 to 2033, By Country
    10.1. Historical Market Size Value (US$ Million) & Volume (MT) Trend Analysis By Market Taxonomy, 2018 to 2022
    10.2. Market Size Value (US$ Million) & Volume (MT) Forecast By Market Taxonomy, 2023 to 2033
        10.2.1. By Country
            10.2.1.1. United States of America
            10.2.1.2. Canada
        10.2.2. By Type
        10.2.3. By Application
        10.2.4. By Use
        10.2.5. By Distribution Channel
    10.3. Market Attractiveness Analysis
        10.3.1. By Country
        10.3.2. By Type
        10.3.3. By Application
        10.3.4. By Use
        10.3.5. By Distribution Channel
    10.4. Key Takeaways
11. Latin America Market Analysis 2018 to 2022 and Forecast 2023 to 2033, By Country
    11.1. Historical Market Size Value (US$ Million) & Volume (MT) Trend Analysis By Market Taxonomy, 2018 to 2022
    11.2. Market Size Value (US$ Million) & Volume (MT) Forecast By Market Taxonomy, 2023 to 2033
        11.2.1. By Country
            11.2.1.1. Brazil
            11.2.1.2. Mexico
            11.2.1.3. Argentina
            11.2.1.4. Chile
            11.2.1.5. Peru
            11.2.1.6. Rest of Latin America
        11.2.2. By Type
        11.2.3. By Application
        11.2.4. By Use
        11.2.5. By Distribution Channel
    11.3. Market Attractiveness Analysis
        11.3.1. By Country
        11.3.2. By Type
        11.3.3. By Application
        11.3.4. By Use
        11.3.5. By Distribution Channel
    11.4. Key Takeaways
12. Europe Market Analysis 2018 to 2022 and Forecast 2023 to 2033, By Country
    12.1. Historical Market Size Value (US$ Million) & Volume (MT) Trend Analysis By Market Taxonomy, 2018 to 2022
    12.2. Market Size Value (US$ Million) & Volume (MT) Forecast By Market Taxonomy, 2023 to 2033
        12.2.1. By Country
            12.2.1.1. Germany
            12.2.1.2. Italy
            12.2.1.3. France
            12.2.1.4. United Kingdom
            12.2.1.5. Spain
            12.2.1.6. Russia
            12.2.1.7. BENELUX
            12.2.1.8. Poland
            12.2.1.9. Nordic Countries
            12.2.1.10. Rest of Europe
        12.2.2. By Type
        12.2.3. By Application
        12.2.4. By Use
        12.2.5. By Distribution Channel
    12.3. Market Attractiveness Analysis
        12.3.1. By Country
        12.3.2. By Type
        12.3.3. By Application
        12.3.4. By Use
        12.3.5. By Distribution Channel
    12.4. Key Takeaways
13. East Asia Market Analysis 2018 to 2022 and Forecast 2023 to 2033, By Country
    13.1. Historical Market Size Value (US$ Million) & Volume (MT) Trend Analysis By Market Taxonomy, 2018 to 2022
    13.2. Market Size Value (US$ Million) & Volume (MT) Forecast By Market Taxonomy, 2023 to 2033
        13.2.1. By Country
            13.2.1.1. China
            13.2.1.2. Japan
            13.2.1.3. South Korea
        13.2.2. By Type
        13.2.3. By Application
        13.2.4. By Use
        13.2.5. By Distribution Channel
    13.3. Market Attractiveness Analysis
        13.3.1. By Country
        13.3.2. By Type
        13.3.3. By Application
        13.3.4. By Use
        13.3.5. By Distribution Channel
    13.4. Key Takeaways
14. South Asia Market Analysis 2018 to 2022 and Forecast 2023 to 2033, By Country
    14.1. Historical Market Size Value (US$ Million) & Volume (MT) Trend Analysis By Market Taxonomy, 2018 to 2022
    14.2. Market Size Value (US$ Million) & Volume (MT) Forecast By Market Taxonomy, 2023 to 2033
        14.2.1. By Country
            14.2.1.1. India
            14.2.1.2. Thailand
            14.2.1.3. Malaysia
            14.2.1.4. Indonesia
            14.2.1.5. Rest of South Asia
        14.2.2. By Type
        14.2.3. By Application
        14.2.4. By Use
        14.2.5. By Distribution Channel
    14.3. Market Attractiveness Analysis
        14.3.1. By Country
        14.3.2. By Type
        14.3.3. By Application
        14.3.4. By Use
        14.3.5. By Distribution Channel
    14.4. Key Takeaways
15. Oceania Market Analysis 2018 to 2022 and Forecast 2023 to 2033, By Country
    15.1. Historical Market Size Value (US$ Million) & Volume (MT) Trend Analysis By Market Taxonomy, 2018 to 2022
    15.2. Market Size Value (US$ Million) & Volume (MT) Forecast By Market Taxonomy, 2023 to 2033
        15.2.1. By Country
            15.2.1.1. Australia
            15.2.1.2. New Zealand
        15.2.2. By Type
        15.2.3. By Application
        15.2.4. By Use
        15.2.5. By Distribution Channel
    15.3. Market Attractiveness Analysis
        15.3.1. By Country
        15.3.2. By Type
        15.3.3. By Application
        15.3.4. By Use
        15.3.5. By Distribution Channel
    15.4. Key Takeaways
16. MEA Market Analysis 2018 to 2022 and Forecast 2023 to 2033, By Country
    16.1. Historical Market Size Value (US$ Million) & Volume (MT) Trend Analysis By Market Taxonomy, 2018 to 2022
    16.2. Market Size Value (US$ Million) & Volume (MT) Forecast By Market Taxonomy, 2023 to 2033
        16.2.1. By Country
            16.2.1.1. GCC Countries
            16.2.1.2. South Africa
            16.2.1.3. Central Africa
            16.2.1.4. North Africa
        16.2.2. By Type
        16.2.3. By Application
        16.2.4. By Use
        16.2.5. By Distribution Channel
    16.3. Market Attractiveness Analysis
        16.3.1. By Country
        16.3.2. By Type
        16.3.3. By Application
        16.3.4. By Use
        16.3.5. By Distribution Channel
    16.4. Key Takeaways
17. Key Countries Market Analysis
    17.1. United States of America
        17.1.1. Pricing Analysis
        17.1.2. Market Share Analysis, 2023
            17.1.2.1. By Type
            17.1.2.2. By Application
            17.1.2.3. By Use
            17.1.2.4. By Distribution Channel
    17.2. Canada
        17.2.1. Pricing Analysis
        17.2.2. Market Share Analysis, 2023
            17.2.2.1. By Type
            17.2.2.2. By Application
            17.2.2.3. By Use
            17.2.2.4. By Distribution Channel
    17.3. Brazil
        17.3.1. Pricing Analysis
        17.3.2. Market Share Analysis, 2023
            17.3.2.1. By Type
            17.3.2.2. By Application
            17.3.2.3. By Use
            17.3.2.4. By Distribution Channel
    17.4. Mexico
        17.4.1. Pricing Analysis
        17.4.2. Market Share Analysis, 2023
            17.4.2.1. By Type
            17.4.2.2. By Application
            17.4.2.3. By Use
            17.4.2.4. By Distribution Channel
    17.5. Argentina
        17.5.1. Pricing Analysis
        17.5.2. Market Share Analysis, 2023
            17.5.2.1. By Type
            17.5.2.2. By Application
            17.5.2.3. By Use
            17.5.2.4. By Distribution Channel
    17.6. Chile
        17.6.1. Pricing Analysis
        17.6.2. Market Share Analysis, 2023
            17.6.2.1. By Type
            17.6.2.2. By Application
            17.6.2.3. By Use
            17.6.2.4. By Distribution Channel
    17.7. Peru
        17.7.1. Pricing Analysis
        17.7.2. Market Share Analysis, 2023
            17.7.2.1. By Type
            17.7.2.2. By Application
            17.7.2.3. By Use
            17.7.2.4. By Distribution Channel
    17.8. Germany
        17.8.1. Pricing Analysis
        17.8.2. Market Share Analysis, 2023
            17.8.2.1. By Type
            17.8.2.2. By Application
            17.8.2.3. By Use
            17.8.2.4. By Distribution Channel
    17.9. Italy
        17.9.1. Pricing Analysis
        17.9.2. Market Share Analysis, 2023
            17.9.2.1. By Type
            17.9.2.2. By Application
            17.9.2.3. By Use
            17.9.2.4. By Distribution Channel
    17.10. France
        17.10.1. Pricing Analysis
        17.10.2. Market Share Analysis, 2023
            17.10.2.1. By Type
            17.10.2.2. By Application
            17.10.2.3. By Use
            17.10.2.4. By Distribution Channel
    17.11. Spain
        17.11.1. Pricing Analysis
        17.11.2. Market Share Analysis, 2023
            17.11.2.1. By Type
            17.11.2.2. By Application
            17.11.2.3. By Use
            17.11.2.4. By Distribution Channel
    17.12. United Kingdom
        17.12.1. Pricing Analysis
        17.12.2. Market Share Analysis, 2023
            17.12.2.1. By Type
            17.12.2.2. By Application
            17.12.2.3. By Use
            17.12.2.4. By Distribution Channel
    17.13. Russia
        17.13.1. Pricing Analysis
        17.13.2. Market Share Analysis, 2023
            17.13.2.1. By Type
            17.13.2.2. By Application
            17.13.2.3. By Use
            17.13.2.4. By Distribution Channel
    17.14. Poland
        17.14.1. Pricing Analysis
        17.14.2. Market Share Analysis, 2023
            17.14.2.1. By Type
            17.14.2.2. By Application
            17.14.2.3. By Use
            17.14.2.4. By Distribution Channel
    17.15. BENELUX
        17.15.1. Pricing Analysis
        17.15.2. Market Share Analysis, 2023
            17.15.2.1. By Type
            17.15.2.2. By Application
            17.15.2.3. By Use
            17.15.2.4. By Distribution Channel
    17.16. Nordic Countries
        17.16.1. Pricing Analysis
        17.16.2. Market Share Analysis, 2023
            17.16.2.1. By Type
            17.16.2.2. By Application
            17.16.2.3. By Use
            17.16.2.4. By Distribution Channel
    17.17. China
        17.17.1. Pricing Analysis
        17.17.2. Market Share Analysis, 2023
            17.17.2.1. By Type
            17.17.2.2. By Application
            17.17.2.3. By Use
            17.17.2.4. By Distribution Channel
    17.18. Japan
        17.18.1. Pricing Analysis
        17.18.2. Market Share Analysis, 2023
            17.18.2.1. By Type
            17.18.2.2. By Application
            17.18.2.3. By Use
            17.18.2.4. By Distribution Channel
    17.19. South Korea
        17.19.1. Pricing Analysis
        17.19.2. Market Share Analysis, 2023
            17.19.2.1. By Type
            17.19.2.2. By Application
            17.19.2.3. By Use
            17.19.2.4. By Distribution Channel
    17.20. India
        17.20.1. Pricing Analysis
        17.20.2. Market Share Analysis, 2023
            17.20.2.1. By Type
            17.20.2.2. By Application
            17.20.2.3. By Use
            17.20.2.4. By Distribution Channel
    17.21. Thailand
        17.21.1. Pricing Analysis
        17.21.2. Market Share Analysis, 2023
            17.21.2.1. By Type
            17.21.2.2. By Application
            17.21.2.3. By Use
            17.21.2.4. By Distribution Channel
    17.22. Indonesia
        17.22.1. Pricing Analysis
        17.22.2. Market Share Analysis, 2023
            17.22.2.1. By Type
            17.22.2.2. By Application
            17.22.2.3. By Use
            17.22.2.4. By Distribution Channel
    17.23. Malaysia
        17.23.1. Pricing Analysis
        17.23.2. Market Share Analysis, 2023
            17.23.2.1. By Type
            17.23.2.2. By Application
            17.23.2.3. By Use
            17.23.2.4. By Distribution Channel
    17.24. Singapore
        17.24.1. Pricing Analysis
        17.24.2. Market Share Analysis, 2023
            17.24.2.1. By Type
            17.24.2.2. By Application
            17.24.2.3. By Use
            17.24.2.4. By Distribution Channel
    17.25. GCC Countries
        17.25.1. Pricing Analysis
        17.25.2. Market Share Analysis, 2023
            17.25.2.1. By Type
            17.25.2.2. By Application
            17.25.2.3. By Use
            17.25.2.4. By Distribution Channel
    17.26. South Africa
        17.26.1. Pricing Analysis
        17.26.2. Market Share Analysis, 2023
            17.26.2.1. By Type
            17.26.2.2. By Application
            17.26.2.3. By Use
            17.26.2.4. By Distribution Channel
    17.27. Central Africa
        17.27.1. Pricing Analysis
        17.27.2. Market Share Analysis, 2023
            17.27.2.1. By Type
            17.27.2.2. By Application
            17.27.2.3. By Use
            17.27.2.4. By Distribution Channel
    17.28. North Africa
        17.28.1. Pricing Analysis
        17.28.2. Market Share Analysis, 2023
            17.28.2.1. By Type
            17.28.2.2. By Application
            17.28.2.3. By Use
            17.28.2.4. By Distribution Channel
18. Market Structure Analysis
    18.1. Competition Dashboard
    18.2. Competition Benchmarking
    18.3. Market Share Analysis of Top Players
        18.3.1. By Regional
        18.3.2. By Type
        18.3.3. By Application
        18.3.4. By Use
        18.3.5. By Distribution Channel
19. Competition Analysis
    19.1. Competition Deep Dive
        19.1.1. Phillips
            19.1.1.1. Overview
            19.1.1.2. Product Portfolio
            19.1.1.3. Profitability by Market Segments
            19.1.1.4. Sales Footprint
            19.1.1.5. Strategy Overview
                19.1.1.5.1. Marketing Strategy
                19.1.1.5.2. Product Strategy
                19.1.1.5.3. Channel Strategy
        19.1.2. Cuisine
            19.1.2.1. Overview
            19.1.2.2. Product Portfolio
            19.1.2.3. Profitability by Market Segments
            19.1.2.4. Sales Footprint
            19.1.2.5. Strategy Overview
                19.1.2.5.1. Marketing Strategy
                19.1.2.5.2. Product Strategy
                19.1.2.5.3. Channel Strategy
        19.1.3. Kuvings
            19.1.3.1. Overview
            19.1.3.2. Product Portfolio
            19.1.3.3. Profitability by Market Segments
            19.1.3.4. Sales Footprint
            19.1.3.5. Strategy Overview
                19.1.3.5.1. Marketing Strategy
                19.1.3.5.2. Product Strategy
                19.1.3.5.3. Channel Strategy
        19.1.4. Braun
            19.1.4.1. Overview
            19.1.4.2. Product Portfolio
            19.1.4.3. Profitability by Market Segments
            19.1.4.4. Sales Footprint
            19.1.4.5. Strategy Overview
                19.1.4.5.1. Marketing Strategy
                19.1.4.5.2. Product Strategy
                19.1.4.5.3. Channel Strategy
        19.1.5. Hamilton Beach
            19.1.5.1. Overview
            19.1.5.2. Product Portfolio
            19.1.5.3. Profitability by Market Segments
            19.1.5.4. Sales Footprint
            19.1.5.5. Strategy Overview
                19.1.5.5.1. Marketing Strategy
                19.1.5.5.2. Product Strategy
                19.1.5.5.3. Channel Strategy
        19.1.6. Breville Chefs Star
            19.1.6.1. Overview
            19.1.6.2. Product Portfolio
            19.1.6.3. Profitability by Market Segments
            19.1.6.4. Sales Footprint
            19.1.6.5. Strategy Overview
                19.1.6.5.1. Marketing Strategy
                19.1.6.5.2. Product Strategy
                19.1.6.5.3. Channel Strategy
        19.1.7. Breville
            19.1.7.1. Overview
            19.1.7.2. Product Portfolio
            19.1.7.3. Profitability by Market Segments
            19.1.7.4. Sales Footprint
            19.1.7.5. Strategy Overview
                19.1.7.5.1. Marketing Strategy
                19.1.7.5.2. Product Strategy
                19.1.7.5.3. Channel Strategy
        19.1.8. Omega
            19.1.8.1. Overview
            19.1.8.2. Product Portfolio
            19.1.8.3. Profitability by Market Segments
            19.1.8.4. Sales Footprint
            19.1.8.5. Strategy Overview
                19.1.8.5.1. Marketing Strategy
                19.1.8.5.2. Product Strategy
                19.1.8.5.3. Channel Strategy
        19.1.9. Jack LaLanne
            19.1.9.1. Overview
            19.1.9.2. Product Portfolio
            19.1.9.3. Profitability by Market Segments
            19.1.9.4. Sales Footprint
            19.1.9.5. Strategy Overview
                19.1.9.5.1. Marketing Strategy
                19.1.9.5.2. Product Strategy
                19.1.9.5.3. Channel Strategy
        19.1.10. Cuisinart
            19.1.10.1. Overview
            19.1.10.2. Product Portfolio
            19.1.10.3. Profitability by Market Segments
            19.1.10.4. Sales Footprint
            19.1.10.5. Strategy Overview
                19.1.10.5.1. Marketing Strategy
                19.1.10.5.2. Product Strategy
                19.1.10.5.3. Channel Strategy
        19.1.11. Hurom
            19.1.11.1. Overview
            19.1.11.2. Product Portfolio
            19.1.11.3. Profitability by Market Segments
            19.1.11.4. Sales Footprint
            19.1.11.5. Strategy Overview
                19.1.11.5.1. Marketing Strategy
                19.1.11.5.2. Product Strategy
                19.1.11.5.3. Channel Strategy
        19.1.12. Philips
            19.1.12.1. Overview
            19.1.12.2. Product Portfolio
            19.1.12.3. Profitability by Market Segments
            19.1.12.4. Sales Footprint
            19.1.12.5. Strategy Overview
                19.1.12.5.1. Marketing Strategy
                19.1.12.5.2. Product Strategy
                19.1.12.5.3. Channel Strategy
        19.1.13. Kenwood
            19.1.13.1. Overview
            19.1.13.2. Product Portfolio
            19.1.13.3. Profitability by Market Segments
            19.1.13.4. Sales Footprint
            19.1.13.5. Strategy Overview
                19.1.13.5.1. Marketing Strategy
                19.1.13.5.2. Product Strategy
                19.1.13.5.3. Channel Strategy
        19.1.14. Guangdong Xinbao Electrical Appliances Holdings Co. Ltd.
            19.1.14.1. Overview
            19.1.14.2. Product Portfolio
            19.1.14.3. Profitability by Market Segments
            19.1.14.4. Sales Footprint
            19.1.14.5. Strategy Overview
                19.1.14.5.1. Marketing Strategy
                19.1.14.5.2. Product Strategy
                19.1.14.5.3. Channel Strategy
        19.1.15. Others (On Additional Request)
20. Assumptions & Acronyms Used
21. Research Methodology

Explore Process Automation Insights

View Reports
Future Market Insights

Juice Extraction Equipment Market

Schedule a Call