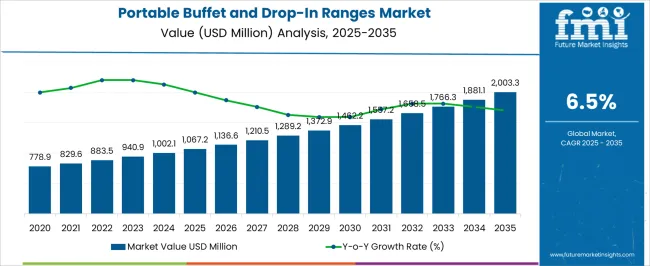
The Portable Buffet and Drop-In Ranges Market is estimated to be valued at USD 1067.2 million in 2025 and is projected to reach USD 2003.3 million by 2035, registering a compound annual growth rate (CAGR) of 6.5% over the forecast period.
| Metric | Value |
|---|---|
| Portable Buffet and Drop-In Ranges Market Estimated Value in (2025 E) | USD 1067.2 million |
| Portable Buffet and Drop-In Ranges Market Forecast Value in (2035 F) | USD 2003.3 million |
| Forecast CAGR (2025 to 2035) | 6.5% |
The portable buffet and drop-in ranges market is gaining traction due to increasing demand from hospitality, catering, and food service industries that prioritize mobility, energy efficiency, and space optimization. Growth is being supported by the rising culture of outdoor dining, live food counters, and on-the-go catering services where portable ranges provide both flexibility and operational convenience.
Advancements in burner design, fuel efficiency, and lightweight construction have enhanced their usability across diverse food service environments. Regulatory emphasis on energy-efficient appliances and safety standards has further accelerated innovation.
Additionally, evolving consumer lifestyles, rising urbanization, and growth in quick-service restaurant formats are expanding opportunities for portable ranges. The market outlook remains positive as operators increasingly seek durable, versatile, and user-friendly cooking solutions to address both commercial and residential needs.
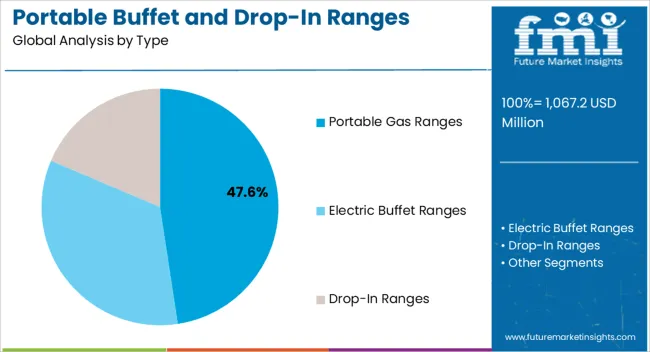
The portable gas ranges type segment is projected to hold 47.60% of total revenue by 2025, making it the leading type category. This dominance is supported by the efficiency, high heat control, and affordability offered by gas-based cooking solutions.
The portability of gas ranges makes them highly adaptable in commercial catering, outdoor events, and mobile food operations where electricity may not be readily available. Their widespread use is reinforced by consistent performance, ease of maintenance, and compatibility with varied cooking styles.
These advantages continue to strengthen the leadership of portable gas ranges in the overall market.
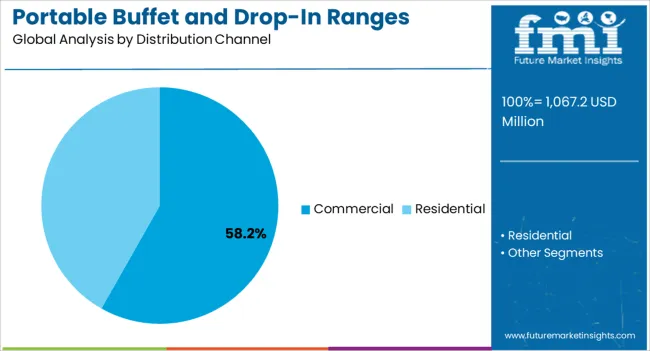
The commercial application segment is anticipated to account for 58.20% of overall revenue by 2025, positioning it as the most prominent application. This growth is driven by the rapid expansion of catering services, hotels, and quick-service restaurants that rely on flexible and efficient cooking systems.
Portable buffet and drop-in ranges have been increasingly deployed in institutional settings such as corporate cafeterias and educational facilities where scalability and operational efficiency are essential. Enhanced product designs offering high durability and safety features have further accelerated adoption in commercial kitchens.
These factors have collectively reinforced the dominance of this segment.
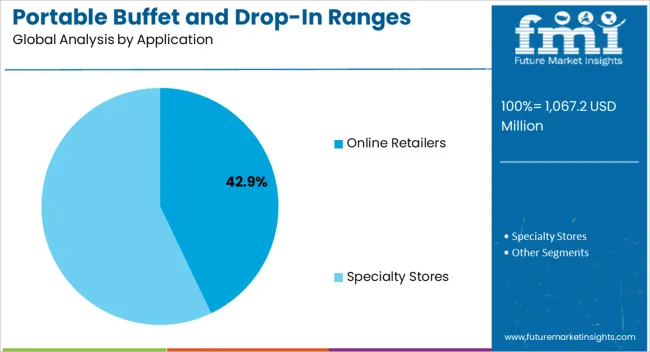
The online retailers segment is expected to capture 42.90% of market revenue by 2025, making it the leading distribution channel. Rising e-commerce penetration and consumer preference for convenient product access are contributing to this segment’s expansion.
The availability of a wide product portfolio, competitive pricing, and doorstep delivery options are enhancing consumer adoption. Online platforms also provide detailed product comparisons, user reviews, and promotional offers, strengthening their role in purchase decisions.
With the increasing digitalization of retail and the growing reliance on e-commerce for appliance purchases, online retailers have become the most influential distribution channel in the portable buffet and drop-in ranges market.
The global demand for portable buffet and drop-in ranges is projected to increase at a CAGR of 6.5% during the forecast period between 2025 and 2035, reaching a total of USD 1,629.7 million in 2035, according to a report from Future Market Insights (FMI). There was a significant increase in sales, registering a CAGR of 3.3% between 2020 and 2024.
Increasing demand for food stalls and fast food delivery services on the market has pushed the market for portable buffets and drop-in ranges of products. It is becoming increasingly important for customers to find products that can integrate with their existing systems as technology advances.
It is becoming increasingly common for manufacturers to incorporate smart home assistants and wireless temperature monitoring into their products to make it easier for customers to manage their cooking and serving equipment.
In the coming years, manufacturers will release new models with a variety of innovative technologies and safety features, including electric drop-in ranges that support heat, digital thermostats, and advanced safety features that will ensure market growth.
Portable buffets and drop-ins are flourishing and evolving to meet changing customer demands in the market. As long as manufacturers pay attention to energy efficiency, versatility, durability, and the incorporation of technology, they are able to capitalize on these developments and provide products that customers expect.
With the Growth of Modular Kitchen and Appliances, Portable Buffets and Drop-in Ranges have Been Gaining Traction
With the increasing popularity of custom-built kitchens and the demand for a more minimal-looking kitchen, the market for these appliances in the kitchen has been booming. Modular design and open kitchens are expected to drive the market in various smart cities. In a kitchen island, drop-in ranges are often installed within the cabinetry of customized cabinetry to create a convenient cooking appliance that fits neatly into the space. For a more integrated appearance, these ranges are often installed above woodwork or cabinetry to give them the appearance of being built-in.
In order to maintain the quality and temperature of food, portable buffer warmers are expected to reach a high level of demand in the coming years. Interactive food stations are another trend within the world of foodies, along with traditional buffets. Modern buffets feature portable heating units that offer a seemingly endless variety of options.
The portable warmers are also renowned for their versatility as they can be set up separately for allergy-sensitive foods, allowing operators to separate warming areas for different types of food. Therefore, sales in the market are expected to increase.
The Future of Portable Buffets and Drop-in Ranges with High-end Functionalities is Promising
In the fast-paced and ever-evolving world of food trucks, pop-up restaurants, and other mobile food businesses, portable cooking and serving equipment is becoming increasingly sought-after in the market. This type of business can prepare and serve food more conveniently at a variety of locations without the need for a permanent kitchen setup with portable buffets and drop-in ranges.
Increasing street-side fast food and traditional pizza demands are likely to continue growing demand for these appliances in a cost-effective manner. Energy consumption is in constant flux, and consumers are becoming increasingly aware of ways to reduce costs and carbon footprint by planning their energy usage strategically.
A variety of portable buffets and drop-in ranges are now available that are equipped with energy-efficient heating elements, such as induction or infrared heating, allowing for reduced energy consumption and cost savings in the long run.
The High Cost of Portable Buffets and Drop-in Ranges Inhibit Industry Growth
In comparison to traditional stovetops and ovens, portable buffets and drop-in ranges typically provide smaller cooking capacities. The complexity of this can make it difficult to prepare multiple dishes simultaneously or cook for large groups.
In particular, high-end models with larger cooking capacities and additional features can be more costly than traditional appliances. In addition to being powered by electricity, portable buffets, and drop-in ranges can also be affected by power failures caused by storms or other emergencies. The use of these devices is also limited by the fact that they may require dedicated circuits to function.
Although portable buffets and drop-in ranges are constructed to be moved, moving them may not be as easy as expected. Besides being heavy, they're also bulky, making them difficult to transport and move. All these factors are expected to hamper the growth of the market.
Technological Advancements in the United States Will Drive Market
North America is expected to capture the largest market share of 37% by 2025 for portable buffets and drop-in ranges. Manufacturers in this region are constantly focusing on innovation in order to improve the functionality and efficiency of their products.
The North American industry has been a pioneer of technological advancements in kitchenware, including portable buffets and drop-in ranges. With the increasing demand for smart and digital features, portable and drop-in electric buffets and ranges are becoming more popular.
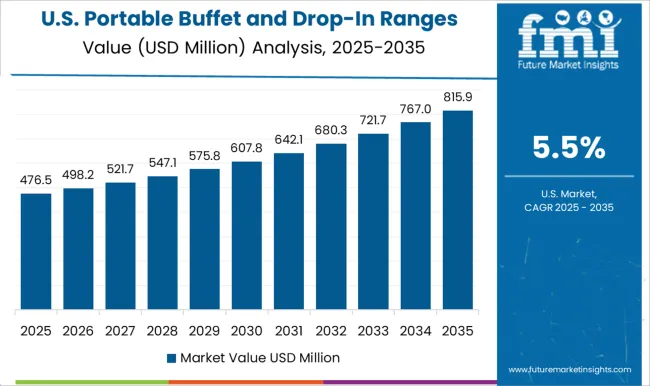
According to FMI, portable buffets and drop-in ranges revenue accounted for 37.2% of the USA market in 2025. This model provides solid performance and convenient features such as simmer burners and digital controls that are intelligent and cost-effective. Users in this region are more likely to spend more on models with the highest ratings on the market.
In comparison to less expensive models, these models don't often come with dual ovens or slide-ins, sleek front-mounted controls, or other major advantages. Dual fuel rangetops, gas rangetops, and electric ovens are becoming more prevalent, although they do not necessarily correlate to superior cooking performance.
Tourism Growth in Asia Pacific is Spurring Demand for Portable Buffet and Drop-in Ranges
According to the forecast, the Asia Pacific region will exhibit the highest growth rate during the forecast period. Growing urbanization and disposable income will drive portable buffets and drop-in ranges market growth. Market growth is attributed to the availability of a large population and the increasing attention given to mid-sized businesses.
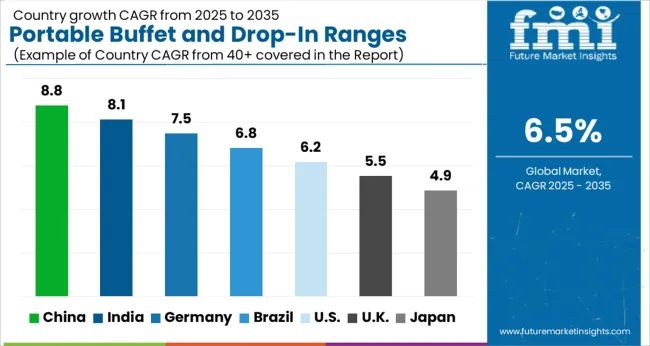
China and India are expected to grow at a CAGR of 6.30% for portable buffets and drop-in ranges. Over the last few years’ countries like China, Japan, and India are experiencing a rise in convenience foods and a growth in home bakers. It is anticipated that these factors will result in an increase in demand for portable buffet ranges and drop-in ranges.
Electric ovens and cooktops are slowly becoming a popular household item in Japan. A series of technological advancements have been incorporated into everyday products or appliances to make it the leading consumer electronic market in the world.
Moreover, Asia is home to many important market participants, which is expected to fuel the market growth during the forecast period in countries like Japan and South Korea. Japan is further expected to hold a market share of 4.90% during the forecast period.
Portable Gas Ranges are expected to grow at a Significant Rate
Portable gas ranges are expected to hold the largest market share in 2025, owing to the longer production runs that make them economically feasible in the market. As a result of self-cleaning and easy cleaning functions, smart technologies are becoming more economically viable and are likely to accelerate their growth. However, the portable gas range segment's growth is limited by fluctuating heat levels and emissions during the frying process.
A portable buffet and drop-in ranges will record a significant growth rate in the forecast period due to their highly cost-effective production and simmering capabilities. With a fast heat-up time, true convention, and a storage drawer, the market is expected to expand further in the near future.
Online Demand for Portable Buffets and Drop-in Ranges is Expected to Grow
Due to the discounts offered by the market, online retailers will hold the largest market share of 35% by the end of 2025. The growing number of chefs worldwide, the availability of portable buffets and drop-in ranges, and advanced equipment in developed countries are resulting in the segment dominating the market during the forecast period.
As a result of increased demand for easy and quick service and free installation facilities on the market, it is anticipated that sales of this equipment will increase in the future. A growing need for warranty periods, end-to-end services, and easy replacement within given timeframes has contributed to the market's growth.
Some of the start-ups in the commercial gas restaurant range market include
Leading players are introducing new advanced products and services to the global market. For flexible cooking, these companies use professional portable gas ranges and innovative technologies that are matched with professional cooking equipment.
The design of modern portable buffets and drop-in ranges and the integration of e-commerce will enhance the sales of these ranges in the market. In addition to mergers, acquisitions, partnerships, and product launches, market players will focus their efforts on product launches.
| Report Attribute | Details |
|---|---|
| Market Value in 2025 | USD 1067.2 million |
| Market Value in 2035 | USD 2003.3 million |
| Growth Rate | CAGR of 6.50% from 2025 to 2035 |
| Base Year for Estimation | 2025 |
| Historical Data | 2020 to 2035 |
| Forecast Period | 2025 to 2035 |
| Quantitative Units | Revenue in USD Billion and CAGR from 2025 to 2035 |
| Report Coverage | Revenue Forecast, Volume Forecast, Company Ranking, Competitive Landscape, Growth Factors, Trends and Pricing Analysis |
| Segments Covered | Type, Application, Distribution Channel, Region |
| Regions Covered | North America; Latin America; Europe; Asia Pacific; Middle East & Africa |
| Key Countries Profiled | USA, Canada, Brazil, Mexico, Germany, United kingdom, France, Spain, Italy, China, Japan, South Korea, Singapore, Thailand, Indonesia, Australia, New Zealand, GCC Countries, South Africa, Israel |
| Key Companies Profiled | Avantco Equipment; Vollrath; Cadco, Ltd.; Globe Food Equipment Company; APW Wyott; Hatco Corporation; Nemco Food Equipment; Warning Commercial; Adcraft; Fagor Commercial |
| Customization | Available Upon Request |
The global portable buffet and drop-in ranges market is estimated to be valued at USD 1,067.2 million in 2025.
The market size for the portable buffet and drop-in ranges market is projected to reach USD 2,003.3 million by 2035.
The portable buffet and drop-in ranges market is expected to grow at a 6.5% CAGR between 2025 and 2035.
The key product types in portable buffet and drop-in ranges market are portable gas ranges, electric buffet ranges and drop-in ranges.
In terms of distribution channel, commercial segment to command 58.2% share in the portable buffet and drop-in ranges market in 2025.


Our Research Products

The "Full Research Suite" delivers actionable market intel, deep dives on markets or technologies, so clients act faster, cut risk, and unlock growth.

The Leaderboard benchmarks and ranks top vendors, classifying them as Established Leaders, Leading Challengers, or Disruptors & Challengers.

Locates where complements amplify value and substitutes erode it, forecasting net impact by horizon

We deliver granular, decision-grade intel: market sizing, 5-year forecasts, pricing, adoption, usage, revenue, and operational KPIs—plus competitor tracking, regulation, and value chains—across 60 countries broadly.

Spot the shifts before they hit your P&L. We track inflection points, adoption curves, pricing moves, and ecosystem plays to show where demand is heading, why it is changing, and what to do next across high-growth markets and disruptive tech

Real-time reads of user behavior. We track shifting priorities, perceptions of today’s and next-gen services, and provider experience, then pace how fast tech moves from trial to adoption, blending buyer, consumer, and channel inputs with social signals (#WhySwitch, #UX).

Partner with our analyst team to build a custom report designed around your business priorities. From analysing market trends to assessing competitors or crafting bespoke datasets, we tailor insights to your needs.
Supplier Intelligence
Discovery & Profiling
Capacity & Footprint
Performance & Risk
Compliance & Governance
Commercial Readiness
Who Supplies Whom
Scorecards & Shortlists
Playbooks & Docs
Category Intelligence
Definition & Scope
Demand & Use Cases
Cost Drivers
Market Structure
Supply Chain Map
Trade & Policy
Operating Norms
Deliverables
Buyer Intelligence
Account Basics
Spend & Scope
Procurement Model
Vendor Requirements
Terms & Policies
Entry Strategy
Pain Points & Triggers
Outputs
Pricing Analysis
Benchmarks
Trends
Should-Cost
Indexation
Landed Cost
Commercial Terms
Deliverables
Brand Analysis
Positioning & Value Prop
Share & Presence
Customer Evidence
Go-to-Market
Digital & Reputation
Compliance & Trust
KPIs & Gaps
Outputs
Full Research Suite comprises of:
Market outlook & trends analysis
Interviews & case studies
Strategic recommendations
Vendor profiles & capabilities analysis
5-year forecasts
8 regions and 60+ country-level data splits
Market segment data splits
12 months of continuous data updates
DELIVERED AS:
PDF EXCEL ONLINE
Portable Audiometer Calibration System Market Size and Share Forecast Outlook 2025 to 2035
Portable Crushers Market Size and Share Forecast Outlook 2025 to 2035
Portable Filtration System Market Size and Share Forecast Outlook 2025 to 2035
Portable Toilet Rental Market Size and Share Forecast Outlook 2025 to 2035
Portable NIR Moisture Meter Market Forecast and Outlook 2025 to 2035
Portable Appliance Tester (PAT) Market Size and Share Forecast Outlook 2025 to 2035
Portable Boring Machines Market Size and Share Forecast Outlook 2025 to 2035
Portable Charging Units Market Size and Share Forecast Outlook 2025 to 2035
Portable Electronic Analgesic Pump Market Size and Share Forecast Outlook 2025 to 2035
Portable Ramps Market Size and Share Forecast Outlook 2025 to 2035
Portable Cancer Screen Devices Market Size and Share Forecast Outlook 2025 to 2035
Portable Hydrogen Powered Generator Market Size and Share Forecast Outlook 2025 to 2035
Portable Milling Machine Market Size and Share Forecast Outlook 2025 to 2035
Portable Power Quality Meter Market Size and Share Forecast Outlook 2025 to 2035
Portable Conventional Generator Market Size and Share Forecast Outlook 2025 to 2035
Portable Projector Market Size and Share Forecast Outlook 2025 to 2035
Portable Printer Market Size and Share Forecast Outlook 2025 to 2035
Portable Video Wall Market Size and Share Forecast Outlook 2025 to 2035
Portable Gas Detection Equipment Market Size and Share Forecast Outlook 2025 to 2035
Portable Chromatography Systems Market Size and Share Forecast Outlook 2025 to 2035

Thank you!
You will receive an email from our Business Development Manager. Please be sure to check your SPAM/JUNK folder too.
Chat With
MaRIA