The Portable Bioprocessing Bioreactors Market is anticipated to be valued at USD 1.9 billion in 2025 and is expected to reach USD 3.6 billion by 2035, registering a CAGR of 6.8%.
| Metric | Value (USD Million) |
|---|---|
| Industry Size (2025E) | USD 1.9 Billion |
| Industry Value (2035F) | USD 3.6 Billion |
| CAGR (2025 to 2035) | 6.8% |
This market is experiencing significant growth, driven by the increasing demand for flexible and scalable biomanufacturing solutions. These compact, mobile bioreactors are gaining traction across various sectors, including academia, pilot-scale productions, targeted therapy applications, and on-site biologics manufacturing.
Key factors contributing to this growth include the adoption of single-use technologies, which reduce infrastructure requirements and setup times, and the need for decentralized production models that offer operational flexibility. The market is poised for expansion, with technological advancements and a shifting biomanufacturing landscape playing pivotal roles in its evolution.
Prominent players in the Portable Bioprocessing Bioreactors Market include Thermo Fisher Scientific, Sartorius Stedim Biotech, Merck KGaA, Cytiva, and Culture Biosciences. These companies are at the forefront of innovation, introducing products that cater to the evolving needs of biomanufacturing. In April 2025, Thermo Fisher Scientific Inc., announced the 5L DynaDrive Single-Use Bioreactor.
The 5L DynaDrive expands the company's robust portfolio of bioreactors, offering seamless scalability from 1 to 5,000 liters and accelerating bench-scale process development, while facilitating the cost-effective transition from bench to commercialization with consistent reactor design and film across all scales.
"The introduction of the 5L DynaDrive marks a significant advancement in our commitment to helping customers maximize productivity and accelerate time to market, with 25 years of experience in single-use technology, we are dedicated to meeting our customers' evolving needs.
Our trusted innovations provide seamless scalability and enhanced efficiency, enabling customers to streamline their bioprocessing workflows and successfully develop and commercialize life-saving therapies." said Ray Mercier, president of Thermo Fisher’s single-use technologies business.

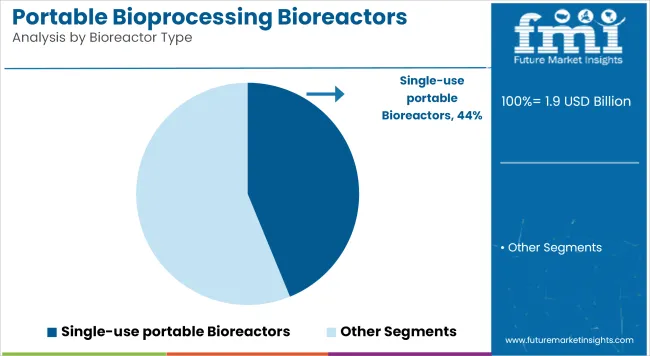
The dominance of single-use portable bioreactors, which hold a 43.8% revenue share in 2025, has been driven by their ability to reduce cross-contamination risks and streamline bioproduction workflows. Adoption has been accelerated by the rising need for sterile and flexible operations in biopharmaceutical research and manufacturing.
The setup and changeover times have been drastically minimized, enabling faster scale-out for multi-product facilities. Additionally, their compatibility with automation and remote-control systems has been viewed favorably, particularly in decentralized and modular production settings.
Regulatory preference for GMP-compliant, contamination-free systems has also influenced uptake. Cost-efficiency in terms of reduced cleaning validation and utility consumption has further positioned this segment as a preferred choice among CDMOs and biopharma innovators.

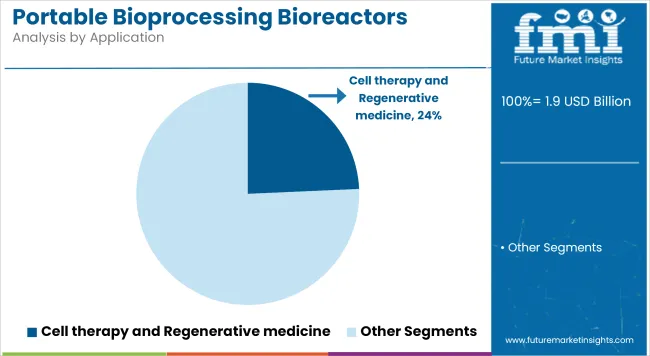
With a 24.3% revenue share in 2025, cell therapy and regenerative medicine applications have emerged as the leading segment within the market. This leadership has been attributed to the rising number of autologous and allogeneic cell-based therapies entering clinical and commercial pipelines.
A growing emphasis on personalized medicine has required scalable yet compact bioreactor systems that support controlled cell expansion. Portable bioreactors have been embraced for their ability to maintain precise parameters critical for sensitive cell lines.
Additionally, innovation in ex vivo culture techniques and regulatory fast-tracking of advanced therapy medicinal products (ATMPs) have further accelerated the need for flexible systems. Biotech firms and academic labs have also adopted these platforms to reduce risk and enhance reproducibility.
The 1 to 10 L capacity bioreactor range, holding a 20.3% revenue share in 2025, has been favored for early-stage research and development activities. This capacity segment has been widely adopted by academic institutions, startups, and CROs due to its low footprint, lower upfront cost, and ability to support rapid prototyping of biologics.
It has also been selected for feasibility studies, process optimization, and small-batch testing. Its ease of integration with PAT (Process Analytical Technology) and single-use technology has enhanced data collection efficiency. Moreover, its suitability for automated and parallel experimentation has supported high-throughput needs in discovery and early-phase formulation development, thereby strengthening its share in the market landscape.
Holding a commanding 42.3% revenue share in 2025, pharmaceutical and biotechnology companies have emerged as the largest end-user segment within the market. This has been enabled by the need for scalable solutions in the development and manufacturing of monoclonal antibodies, vaccines, and cell-based therapies.
Portable bioreactors have been strategically implemented to support upstream process development and reduce facility footprint in multiproduct environments. Their use has also been driven by increasing investment in biologics and biosimilars, where time-to-market and production flexibility are critical.
Internalization of R&D and GMP-compliant production by mid-to-large biopharma firms has further increased reliance on modular bioreactor systems. These companies have also adopted integrated platforms to improve reproducibility and facilitate seamless tech transfer.
Limited Scalability Beyond Pilot and Lab Scale Is Emerging as the Significant Market Growth Barrier.
One of the major restraining factor for portable bioprocessing bioreactors market is limited scalability due to its application restricted to pilot and lab scale. Portable bioreactors are ideally suited to early-stage R&D, small-batch production, or personalized therapies, but face many challenges in transitioning to large-scale commercial manufacturing.
These systems generally come with volume and throughput limits that prevent their use at mass production sites. Furthermore, upscaling bioprocesses while ensuring yield, quality, and regulatory compliance seems to be a challenge (www.biopharma-reporter.com).
This limitation necessitates their more limited use in higher-throughput biologics production, where uniformity and throughput are key. Consequently, full-scale production for many biopharmaceutical companies remains dependent on classic, large stainless-steel systems, which limits the commercial scalability of portable bioreactors.
Growing Role of Academic and Research Institutes is Propelling the Overall Market Growth.
The role of academic and research institutes are expected to be a breaking ground in the portable bioprocessing bioreactors market. Many of these institutions have developed partnerships with biotech companies for preclinical, translational, and early-stage biopharmaceutical research.
Portable bioreactors provide a perfect system for these settings due to the need for small scale, low-cost, ease of use systems. They allow for rapid process development and small-batch production, making them fit well with the exploratory nature of academic research.
Additionally, with more academic and research institutions being funded for biotechnology innovation, there is increasing demand for powerful, yet easy-to-run bioprocessing tools. As such, this has the potential to spur adoption heavyweight among the academic and government-supported research labs from cell culture studies to microbial fermentation to applications in synthetic biology.
Field-Deployable Biomanufacturing Units
Rapidly emerging industry features such as field-deployable biomanufacturing units for on-site production of biologics and diagnostics in remote or resource-limited settings using portable bioprocessing bioreactors. They have received growing use in military operations, disaster response organizations, and remote health care providers to guarantee the rapid availability of essential therapeutics, vaccines, and diagnostic tools in the course of emergencies.
Their compact design, ease of transport, and ability to function in non-standard settings, makes them well-suited to be deployed in conflict zones, areas affected by natural disasters, and other underserved regions in support of decentralized biomanufacturing; medical supply chains; and global health preparedness and response efforts.
Rapid Process Development Platforms
Rapid process development platforms that use portable bioreactors are an emerging market trend in biotech companies and academic labs. These systems are increasingly valuable in driving forward process optimization, scale-down modeling, and technology transfer routine earlier in a drug development pipeline.
Their small footprint, real time monitoring abilities, and compatibility with single-use technologies allows for the use of faster experimentation, quicker turn around and overall lower operational costs. With the rise in the demand for flexible manufacturing of biologics, biosimilars and advanced therapies, portable bioreactors are becoming a key part of improving the upstream process development, increasing efficiency, and reducing the time-to-market of new biopharmaceutical products.
Portable bioprocessing bioreactors are gaining traction worldwide due to their flexibility and scalability in the biopharmaceutical and bioprocessing industries. This trend is expected to foster the growth of the market with the increasing adoption of disposable bioreactors, along with further technological advancements and enhancements in manufacturing capacity.
However, all these growth trajectories are challenged by issues, such as high equipment costs and very stringent regulatory standards, as well as the requirement of skilled personnel.
Market should continue its growth for the period from 2025 up to 2035. The essential factors that propel the market are sustained innovations, increased investments in biopharmaceutical R&D and focus on personalized medicine and regenerative therapy. This market will be further pushed with automatic and intelligent bioreactors expected to be more widely used in the field of cell and gene therapy, development of vaccines, and tissue engineering.

Market Outlook
The global portable bioprocessing bioreactors market was led by the USA due to the strong presence of major biopharmaceutical companies, advanced R&D infrastructure, and early adoption of single-use technologies. Ongoing innovation is driven by major investment in biologics, cell and gene therapies, as well as government-funded research initiatives.
The need for modular, flexible bioprocessing solutions is further corroborated by the country’s drive towards decentralized manufacturing and pandemic preparedness. Many academic institutions, startups and (contract development and manufacturing organizations (CDMOs have favored smaller bioreactors for rapid process development. In addition, a friendly regulatory climate, technology adoption and workforce expertise will continue to make the US the global leader in portable and scalable bioprocessing.
Market Growth Factors
Market Forecast
| Country | CAGR (2025 to 2035) |
|---|---|
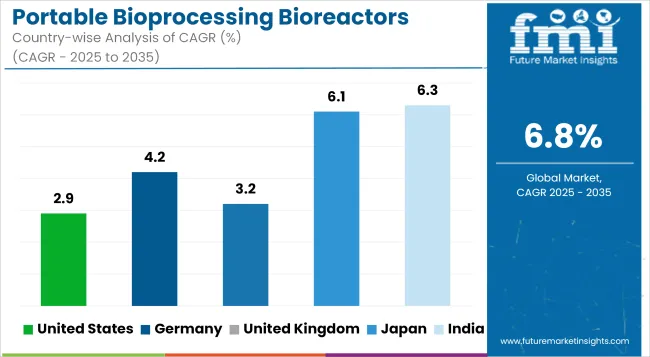
| United States | 2.9% |
Market Outlook
The increasing biopharmaceutical manufacturing ecosystem in Europe, which houses Germany as a fulcrum, features strong industrial infrastructure coupled with competitive government support for innovation. Gradual growth in the portable bioprocessing bioreactors market-fastens up the needs for biologics, biosimilars, and personalized medicines.
The focus on automation, precision engineering, and sustainability in Germany corresponds precisely to what a single-use small bioreactor would require. Most partnerships between academia and companies in the biotech sector are meant to encourage innovation, especially at the early stages of development.
Through strengthening their production capabilities, key national and international players position Germany as an important market for the next generation portable systems in biomanufacturing, tech deployment being supported by harmonized regulations within the EU.
Market Growth Factors
Market Forecast
| Country | CAGR (2025 to 2035) |
|---|---|
| Germany | 4.2% |
Market Outlook
The UK is well established in a vibrant biotech ecosystem, increasing investments in life science, and a thriving portable bioprocessing bioreactor market, which best reflects the ideal conditions for a growing market. After the UK government has prioritized biomedicine, investing in translational research and advanced therapy, it will happen after leaving EU.
Portable bioreactor systems are gaining traction in universities, CDMOs, and research parks for early-phase drug development and personalized medicine. There exists really high demand among cell and gene therapy for fast scaling up in production, and that is the segment where the UK is leading across Europe. The UK is fast establishing itself as a major node for decentralized biomanufacturing, having a rich talent pool and academic achievement and directing regulatory frameworks.
Market Growth Factors
Market Forecast
| Country | CAGR (2025 to 2035) |
|---|---|
| United Kingdom | 3.2% |
Market Outlook
Japan’s portable bioprocessing bioreactors market is expanding due to its focus on regenerative medicine, aging population-driven healthcare innovation, and strong government support for biopharmaceutical R&D. The country’s industrial automation capabilities enhance the deployment of compact, intelligent bioreactor systems for upstream processing.
Biotech firms and academic institutions are increasingly adopting portable bioreactors for rapid experimentation and small-batch production, particularly in vaccine development and iPSC research. Japan’s Pharmaceutical and Medical Device Agency (PMDA) is also streamlining approval pathways, accelerating clinical research.
As domestic pharmaceutical companies and research centers invest in next-gen technologies, Japan continues to emerge as a high-potential market for mobile and modular bioprocessing platforms.
Market Growth Factors
Market Forecast
| Country | CAGR (2025 to 2035) |
|---|---|
| Japan | 6.1% |
India is witnessing rapid growth in the portable bioprocessing bioreactors market, fueled by expanding biopharmaceutical manufacturing, government-backed biotechnology initiatives, and cost-effective R&D capabilities. With the rising demand for biosimilars, vaccines, and affordable biologics, Indian biotech firms and academic institutes are embracing portable systems for pilot-scale and preclinical development.
The Make in India campaign and Biotech Parks have spurred infrastructure development, while increased collaboration with global players is improving access to advanced bioprocessing tools. Additionally, the shift toward decentralized production and point-of-care biomanufacturing in rural healthcare settings positions India as a key emerging market for portable, scalable bioreactor technologies.
Market Growth Factors
Market Forecast
| Country | CAGR (2025 to 2035) |
|---|---|
| India | 6.3% |
Some prominent companies and startups functioning in the portable bioprocessing bioreactors market are Miroculus Inc., Wilhelmsen Group, 10× Genomics, Genesyst Biotech International, Samsung Biologics, Merck Millipore, and Genentech. To adapt to the changing needs of the industry, the main players such as Thermo Fisher Scientific, Sartorius AG, and Merck KGaA have made significant investments in modular, single-use systems, and automation.
These strategies comprise building platform solutions tailored to cell and gene therapy, acquiring smaller biotech tool providers, and cooperating with academic institutions for early-stage implementation. Meanwhile, the companies are also ramping up their manufacturing capabilities to support rapid deployment and build supply chain resilience.
This integrated bioprocessing, modular solutions, and advanced monitoring technologies are allowing manufacturers to distinguish themselves and target emerging markets requiring decentralized biomanufacturing opportunities.
the market is segmented into Single-Use Portable Bioreactors, Benchtop and Compact Reusable Bioreactors, Stainless Steel Bioreactors, and Hybrid Bioreactors.
the market is segmented into Cell Therapy and Regenerative Medicine, Vaccine and Biologic Development, Biopharmaceutical Production, Biologics and Biosimilars Manufacturing, and Tissue Engineering.
the market is segmented into 1 To 10 L, 10 To 50 L, 50 To 100 L, and 100 To 500 L.
the market is segmented into Biopharmaceutical & Biotechnology Companies, Contract Research Organizations (CROs), Contract Manufacturing Organizations (CMOs), and Academic & Research Institutes.
The Portable Bioprocessing Bioreactors Market is analyzed across North America, Latin America, Western Europe, Eastern Europe, East Asia, South Asia & Pacific, and the Middle East & Africa.
The global Portable Bioprocessing Bioreactors industry is projected to witness CAGR of 6.8% between 2025 and 2035.
The global Portable Bioprocessing Bioreactors industry stood at USD 1,849.2 million in 2024.
The global portable bioprocessing bioreactors industry is anticipated to reach USD 3.6 billion by 2035 end.
China is expected to show a CAGR of 6.9% in the assessment period.
The key players operating in the global Portable Bioprocessing Bioreactors industry are Thermo Fisher Scientific, Sartorius AG, Eppendorf AG, Merck KGaA, Solaris Biotech, Applikon Biotechnology (Getinge), PBS Biotech, Infors HT, Pierre Guérin Technologies, Cytiva (Danaher) and Others


Full Research Suite comprises of:
Market outlook & trends analysis
Interviews & case studies
Strategic recommendations
Vendor profiles & capabilities analysis
5-year forecasts
8 regions and 60+ country-level data splits
Market segment data splits
12 months of continuous data updates
DELIVERED AS:
PDF EXCEL ONLINE
Portable Filtration System Market Size and Share Forecast Outlook 2025 to 2035
Portable Toilet Rental Market Size and Share Forecast Outlook 2025 to 2035
Portable NIR Moisture Meter Market Forecast and Outlook 2025 to 2035
Portable Appliance Tester (PAT) Market Size and Share Forecast Outlook 2025 to 2035
Portable Boring Machines Market Size and Share Forecast Outlook 2025 to 2035
Portable Charging Units Market Size and Share Forecast Outlook 2025 to 2035
Portable Electronic Analgesic Pump Market Size and Share Forecast Outlook 2025 to 2035
Portable Ramps Market Size and Share Forecast Outlook 2025 to 2035
Portable Buffet and Drop-In Ranges Market Size and Share Forecast Outlook 2025 to 2035
Portable Cancer Screen Devices Market Size and Share Forecast Outlook 2025 to 2035
Portable Hydrogen Powered Generator Market Size and Share Forecast Outlook 2025 to 2035
Portable Milling Machine Market Size and Share Forecast Outlook 2025 to 2035
Portable Power Quality Meter Market Size and Share Forecast Outlook 2025 to 2035
Portable Sandwich Maker Market Size and Share Forecast Outlook 2025 to 2035
Portable Conventional Generator Market Size and Share Forecast Outlook 2025 to 2035
Portable Projector Market Size and Share Forecast Outlook 2025 to 2035
Portable Printer Market Size and Share Forecast Outlook 2025 to 2035
Portable Video Wall Market Size and Share Forecast Outlook 2025 to 2035
Portable Gas Detection Equipment Market Size and Share Forecast Outlook 2025 to 2035
Portable Chromatography Systems Market Size and Share Forecast Outlook 2025 to 2035

Thank you!
You will receive an email from our Business Development Manager. Please be sure to check your SPAM/JUNK folder too.
Chat With
MaRIA