Reports

- Global Locations -

Headquarters

Future Market Insights, Inc.

Christiana Corporate, 200
Continental Drive, Suite 401,
Newark, Delaware - 19713,
United States

T: +1-845-579-5705

Americas

Future Market Insights, Inc.

616 Corporate Way, Suite 2-9018,
Valley Cottage, NY 10989, United States

T: +1-347-918-3531

MEA

Future Market Insights

1602-6 Jumeirah Bay X2 Tower, Plot No: JLT-PH2-X2A,
Jumeirah Lakes Towers, Dubai,
United Arab Emirates

Europe

Future Market Insights

3rd Floor, 207 Regent Street,
W1B 3HH London
United Kingdom

T: + 44 (0) 20 8123 9659
D: +44 (0) 20 3287 4268

Asia Pacific

Future Market Insights

IndiaLand Global Tech Park, Unit UG-1, Behind Grand HighStreet, Phase 1, Hinjawadi, MH, Pune – 411057, India

Portable Keg System Market Outlook (2023 to 2033)

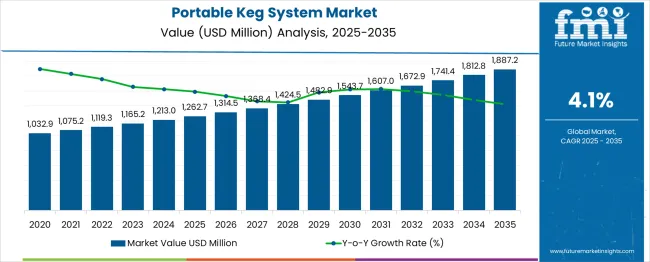
According to research by Future Market Insights, the portable keg system market is anticipated to expand at a CAGR of 4.1% during the forecasted period. According to projections, the market would be worth US$ 1,741.4 million by 2033, up from US$ 1,165.2 million in 2023.

Beer consumption among young customers is growing, which is a major factor that drives the adoption of portable keg systems. Research revealed that about 70.0% of men between the ages of 18 and 29 chose beer over other alcoholic beverages. This pattern has persisted over time and has been a major market-moving factor. Craft beer and wine are becoming popular, and sales of portable keg systems are rising due to their ease of use. The demand for portable keg systems is likely to increase as more people seek out premium drinks outside of conventional pubs and eateries.

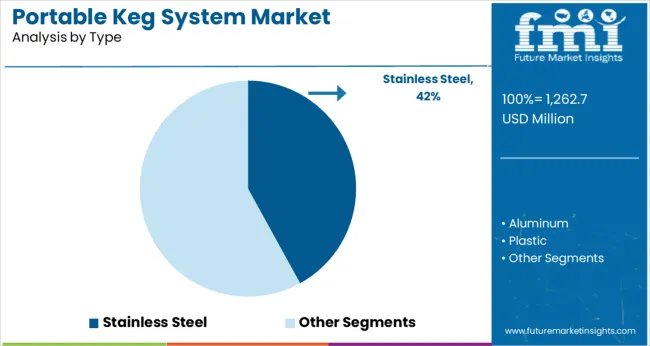
The packaging sector as a whole has been focused on sustainability, which has led to an increase in the use of recyclable and environmentally friendly materials. Steel portable keg systems are chosen over other product varieties as a result. As industry rules and practices change to address environmental issues, businesses have demonstrated a tendency to invest in recycling systems. Furthermore, a trend that is anticipated to boost the demand for portable keg systems is the growing popularity of flavored alcoholic beverages.

Don't pay for what you don't need

Customize your report by selecting specific countries or regions and save 30%!

Emerging Trends in Portable Keg System Market

Consumers are shifting towards the adoption of portable keg system as it aids in preserving the true flavor and quality of alcoholic beverages for extended periods. Since portable keg systems are typically used by multiple breweries to serve draught beer to maintain pressure, on-trade sales account for a bigger portion of the product's demand. Furthermore, the sales are spurred by a changing consumer lifestyle and rising per capita income, together with growing demand for luxury goods like craft and draught varieties.

Portable keg systems have lately entered a new market and are still in the early phases of development but have already demonstrated tremendous promise for future growth. Beer, wine, or other beverage kegs can be transported and stored using the portable keg system. This solution is ideal for people who want to enjoy their favorite beverages while on the road without worrying about lugging along bulky kegs.

Portable Keg System Market

Long-term Packaging and Preservation Methods are Becoming More Popular.

The beverage sector is expected to benefit from the usage of portable keg systems as a packaging option in the future. Plastic portable keg systems may be recycled, and returning them is less expensive. The popularity of portable keg systems, on the other hand, has prompted manufacturers to offer portable keg systems for lease, which has led to an increase in keg adoption.

Single-use portable keg systems are a more practical and cost-effective substitute for conventional steel kegs, and it is expected that they will be utilized extensively soon. Due to consumer excitement for craft beers, which has boosted the global portable keg system industry, the microbrew industry is also growing. Legislative restrictions that favor lower package weight limitations are expected to promote the usage of portable keg systems.

Attribute Details
Portable Keg System Market Size (2023) US$ 1,165.2 million
Portable Keg System Market Forecast Value (2033) US$ 1,741.4 million
Portable Keg System Market CAGR 4.1%
Share of Germany in the Portable Keg System Market 23.8%
Nandini Roy Choudhury

Principal Consultant

Talk to Analyst

Find your sweet spots for generating winning opportunities in this market.

Historical Outlook Vs Future Forecast for Portable Keg System Market

According to Future Market Insights, the Wine crusher was growing at a CAGR of 3.6% to reach USD 1,119.3 million in 2022 from USD 971.7 million in 2018.

The market for portable keg systems has grown as a result of the advantages they have over conventional keg systems. In addition to being substantially simpler to set up and carry, portable keg systems also have several other benefits. However, there is significant disagreement over the market for portable keg systems in the future. In the years to come, some industry analysts predict that the market will expand, while others predict that it will finally stall. The market for portable keg systems is predicted to grow at a CAGR of 4.1% during the expected period, according to research by Future Market Insights.
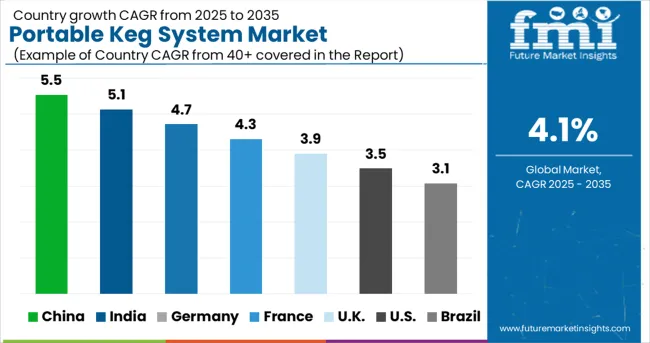
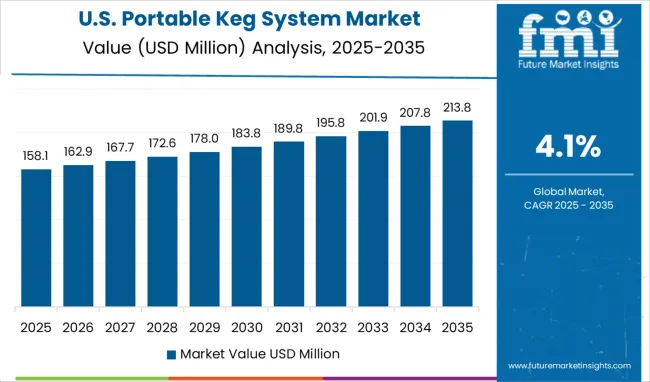
Comparative View of the Adjacent Portable Keg System Market

Portable Keg System Market:

Attributes Portable Keg System Market
CAGR (2023 to 2033) 4.1%
Market Value (2033) US$ 1,741.4 million
Growth Factor The sales of portable keg systems are growing as people realize how well they preserve the genuine flavor and quality of alcoholic beverages over long periods.
Opportunity The use of portable keg systems as a packaging choice in the future is anticipated to be advantageous for the beverage industry.
Key Trends The rising popularity of flavored alcoholic beverages is a trend that is projected to increase demand for portable keg systems.

Kegs Market:

Attributes Kegs Market
CAGR (2023 to 2033) 4.3%
Market Value (2033) US$ 1,371.15 million
Growth Factor More disposable income increased urbanization, and fast-changing consumer lifestyles all contributed to a greater propensity for off-the-shelf purchase habits among consumers.
Opportunity The kegs market is expected to see development due to the steadily expanding beverage retail industry.
Key Trends The launch of eco kegs, a brand-new kind of keg that addresses sustainable, ecologically friendly concerns and will lower carbon footprints, is one of the most recent market advances.

Beer Kegs Market:

Attributes Beer Kegs Market
CAGR (2023 to 2033) 4.5%
Market Value (2033) US$ 53,900 million
Growth Factor A significant driver propelling the worldwide market is the shift in customer preference for premium beer and flavored variations.
Opportunity The packaging sector as a whole has been focused on sustainability, which has led to an increase in the use of recyclable and environmentally friendly materials.
Key Trends An expanding consumer lifestyle and rising per capita income are driving up demand for premium goods like craft and draught varieties.

Get the data you need at a Fraction of the cost

Personalize your report by choosing insights you need
and save 40%!

Country-wise insights

United States Holds the Largest Market Share in the Portable Keg System Market

The USA is expected to be the largest market for portable keg systems due to the growing demand from the beer industry. Europe is expected to be the second largest market due to the presence of a large number of breweries. Asia Pacific is expected to be the fastest-growing market for portable keg systems due to the growing demand from countries such as China and India.

The United States dominates the global portable keg system market due to high demand from breweries and wineries in this region. Europe is expected to be the second-largest market for portable keg systems due to the rising popularity of draught beer in this region.
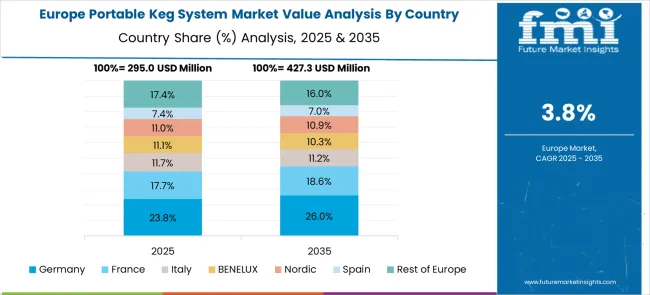
What makes Europe an Attractive Market for the Portable keg System?

The portable keg system is a unique product that offers many benefits to consumers. This system is perfect for those who enjoy beer but do not want to deal with the hassle of traditional kegs. A portable keg system is also a great option for those who want to have fresh beer on tap without having to worry about storing or transporting kegs.

There are many reasons why Europe is an attractive market for portable keg systems. One reason is that the system is very easy to use. Consumers simply need to fill the tank with beer and then screw on the top. The system will then keep the beer fresh and carbonated for up to 30 days. This means that consumers can have fresh beer anytime they want without having to worry about buying or storing kegs.

Why is the Asia Pacific Emerging as an Opportunistic Portable Keg System Market?

This growth can be attributed to the rising demand for portable keg systems in countries such as China, Japan, and India. The increasing number of bars and restaurants in these countries is one of the major factors driving the growth of the portable keg system market in the Asia Pacific.

The other factor fueling the growth of this market is the growing preference for draught beer among consumers in this region. The portability and easy handling of these systems are some of the factors that attract consumers to them.

Asia Pacific is emerging as an opportunistic market for portable keg systems due to the growing demand for premium beer and cider products. Portable keg systems offer a convenient and cost-effective solution for dispensing these products and are therefore becoming increasingly popular in the region.

Category-wise insights

How is the Food and Beverage Industry Supporting Growth of the Portable keg System Market?

The food and beverage industry is a major contributor to the growth of the portable keg system market. The popularity of portable kegs has grown exponentially in recent years due to their convenience and portability. Many people prefer to use portable kegs over traditional kegs because they are easier to transport and can be used in a variety of settings.

Food and beverage companies have been quick to capitalize on this trend by investing in the development of new and innovative portable keg systems. These companies are constantly striving to improve the quality and performance of their products to meet the demands of their customers.

Portable keg systems offer several benefits over traditional kegs, which makes them an attractive option for both consumers and businesses alike. They are more efficient, easier to transport, and can be used in a variety of settings.

By Application, Which Category is Likely to Witness Maximum Growth in the Portable keg System Market?

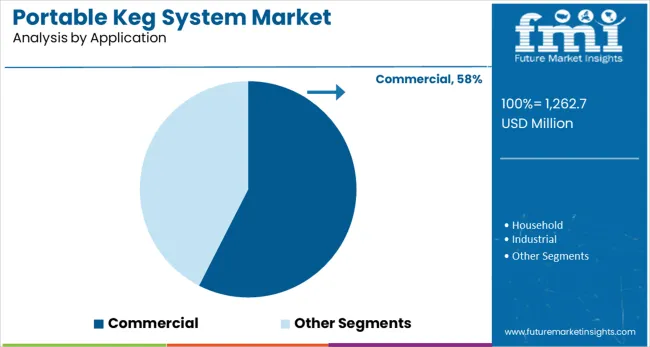
Portable keg systems are popular in the commercial sector and are expected to experience maximum growth in this category. This type of system is ideal for businesses that want to serve fresh, cold beer on tap without the hassle and expense of a traditional keg system. Portable keg systems are also becoming increasingly popular in the home brewing market.

Heineken N.V. to Dominate the Industry with its Innovative Portable Keg Systems

The global portable keg system market is highly competitive, with a large number of players. Some of the key players in this market are Heineken N.V., Anheuser-Busch InBev, Krombacher Brauerei, Asahi Breweries, Carlsberg Group, and Diageo plc. These players have a strong presence in the global market and are well-positioned to capitalize on the growing demand for portable keg systems.

Heineken has introduced a portable keg beer system as part of a £100 million marketing campaign. Heineken declared in February that it would spend an additional £100 million on marketing and repackaging in 2005 to improve the brand's standing in the premium beer market.

The new draught system, called DraughtKeg, has a tiny barrel with 4.75 liters of beer within. A proprietary pressurized gas system, resembling those seen in bars, is utilized for pouring the beer. The manufacturer asserts that the product produces beer of a higher standard. The BeerTender, Heineken's first at-home draught beer system, was introduced in 2004 and was followed by the keg. DraughtKeg was introduced in France, and later it was sold in the USA. According to the company, there is no specific timeline for a United Kingdom debut. The keg, according to Anthony Ruys, chairman of the executive board of Heineken, was created to boost sales and meet shifting consumer demands for beer.

At IBIE in Las Vegas in September 2022, Sonneveld and KeyKeg presented the Easy Go Keg system to the North American professional baking community. For premium bakery items, this ground-breaking method employs a continuous spray pattern of release agents, producing a flawless release at a low cost of use, a longer shelf-life, and fewer rejections.

The system's handy spray gun and programmable pressure settings enable bakers to efficiently apply uniform, concentrated dosages of release agent on baking moulds, tins, trays, and conveyor belts. By lessening fogging, the spray pattern also aids in maintaining the cleanliness and hygiene of the bakery. To guarantee future growth, American Keg and Blefa Kegs announced in January 2020 that Blefa would invest significantly in American Keg in terms of equity and technology.

Loudoun wine and beer Tour Company plans to saturate Greater Washington, according to a publication published by American City Business Journals in August 2022. In September 2021, Newsmatics Inc. published an article titled Kegs have Become More Popular as a Promising, Long-term Packaging Solution and tells that as a packaging option for beverages, kegs are anticipated to have a promising future. It mentioned that increasing consumption of wine and beer affects the demand for kegs for preparation, preservation, and transport.

In an article titled Keg Wine on Tap: A Swiss Sustainable Innovation, published in September 2020 by Hospitality NetTM, it is said that one innovation was keg wine, which perfectly preserves wine quality while also being practical, eco-friendly, and economical.

Some of the Major Players in the Portable Keg System Market

  • Heineken N.V
  • Anheuser-Busch InBev
  • Krombacher Brauerei
  • Asahi Breweries
  • Carlsberg Group
  • Diageo plc
  • Cornelius Kegs Ltd
  • Kegco
  • Eppelsheimer
  • Zambelli
  • Lasotherm Technologies
  • Alphatech Process Equipments

Portable Keg System Market report scope

Attribute Details
Forecast period 2023 to 2033
Historical data available for 2018 to 2022
Market analysis USD million in value
Key regions covered
  • North America
  • Eastern Europe
  • Western Europe
  • Japan
  • South America
  • Asian Pacific
  • Middle East and Africa (MEA)
Key countries covered
  • USA
  • Germany
  • France
  • Italy
  • Canada
  • The United Kingdom
  • Spain
  • China
  • India
  • Australia
Key segments covered
  • Type
  • Mode of operation
  • Equipment Type
  • Application
  • Distribution channel
  • Region
Key companies profiled
  • Heineken N.V
  • Anheuser-Busch InBev
  • Krombacher Brauerei
  • Asahi Breweries
  • Carlsberg Group
  • Diageo plc
  • Cornelius Kegs Ltd
  • Kegco
  • Eppelsheimer
  • Zambelli
  • Lasotherm Technologies
  • Alphatech Process Equipments
Report Coverage
  • Market Forecast
  • Company Share Analysis
  • Market Dynamics
  • Challenges
  • Competitive Landscape
  • DROT Analysis
  • Strategic Growth Initiatives
Customization and Pricing
  • Available upon request

Portable Keg System Market Segmentation by Category

By Equipment Type:

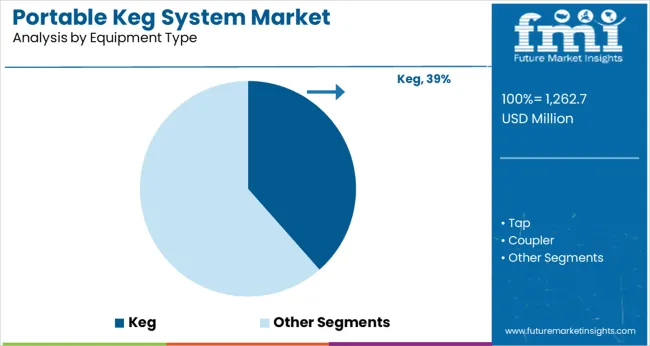
  • Tap
  • Coupler
  • Keg

By Type:

  • Stainless Steel
  • Aluminum
  • Plastic

By Application:

  • Commercial
  • Household
  • Industrial

By Mode of Operation:

  • Tap Systems
  • Self-serve Systems

By distribution channel:

  • Online
  • Offline

By Region:

  • North America
  • Latin America
  • Asia Pacific
  • Eastern Europe
  • Western Europe
  • Japan

Frequently Asked Questions

How Big is the Portable Keg System Market?

The portable keg system market size is assessed to be US$ 1,729.2 million in 2023.

At What Rate is the Portable Keg System Market Expected to Rise?

The portable keg system market is expected to rise at a CAGR of 4.1% during the forecast period.

At What Rate will the China Portable Keg System Market Grow?

China's portable keg system market is projected to grow at a CAGR of around 6.1% over the next ten years.

What is the Market Share of the Germany Portable Keg system market?

The market share of Germany in the portable keg system market is about 23.8% of the global market.

What is the Demand Outlook Forecast for the Portable Keg System Market?

The global portable keg system market is forecasted to surpass US$ 1,741.4 million by 2033.

Table of Content

1. Executive Summary | Portable Keg System Market

    1.1. Global Market Outlook

    1.2. Demand-side Trends

    1.3. Supply-side Trends

    1.4. Technology Roadmap Analysis

    1.5. Analysis and Recommendations

2. Market Overview

    2.1. Market Coverage / Taxonomy

    2.2. Market Definition / Scope / Limitations

3. Market Background

    3.1. Market Dynamics

        3.1.1. Drivers

        3.1.2. Restraints

        3.1.3. Opportunity

        3.1.4. Trends

    3.2. Scenario Forecast

        3.2.1. Demand in Optimistic Scenario

        3.2.2. Demand in Likely Scenario

        3.2.3. Demand in Conservative Scenario

    3.3. Product launches & Recent Developments

    3.4. Product Life Cycle Analysis

    3.5. Value Chain Analysis

        3.5.1. Supply Side Participants and their Roles

            3.5.1.1. Producers

            3.5.1.2. Mid-Level Participants (Traders/ Agents/ Brokers)

            3.5.1.3. Wholesalers and Distributors

        3.5.2. % of Operating Margin Analysis

        3.5.3. List of Raw Material Suppliers

        3.5.4. List of Existing and Potential Buyer’s

    3.6. Global Market - Pricing Analysis

        3.6.1. Price Point Assessment by Region

        3.6.2. Price Point Assessment by Product Type

        3.6.3. Price Forecast till 2033

        3.6.4. Factors affecting pricing

    3.7. Forecast Factors - Relevance & Impact

    3.8. PESTLE and Porter’s Analysis

    3.9. Regulatory Landscape

        3.9.1. Packaging & Labelling Regulations

        3.9.2. Certifications and Certifying Agency Overview

        3.9.3. Import/Export Policies

    3.10. Regional Parent Market Outlook

    3.11. Production and Consumption Statistics

    3.12. Import and Export Statistics

    3.13. Consumers Survey Analysis

    3.14. Macro-Economic Factors

    3.15. Product Claims & Nutritional Information Scan by Buyers

4. Global Analysis 2018 to 2022 and Forecast, 2023 to 2033

    4.1. Historical Market Size Value (US$ million) & Volume (MT) Analysis, 2018 to 2022

    4.2. Current and Future Market Size Value (US$ million) & Volume (MT) Projections, 2023 to 2033

        4.2.1. Y-o-Y Growth Trend Analysis

        4.2.2. Absolute $ Opportunity Analysis

5. Global Analysis 2018 to 2022 and Forecast 2023 to 2033, By Equipment Type

    5.1. Introduction / Key Findings

    5.2. Historical Market Size Value (US$ million) & Volume (MT) Analysis By Equipment Type, 2018 to 2022

    5.3. Current and Future Market Size Value (US$ million) & Volume (MT) Analysis and Forecast By Equipment Type, 2023 to 2033

        5.3.1. Tap

        5.3.2. Coupler

        5.3.3. Keg

    5.4. Y-o-Y Growth Trend Analysis By Equipment Type, 2018 to 2022

    5.5. Absolute $ Opportunity Analysis By Equipment Type, 2023 to 2033

6. Global Analysis 2018 to 2022 and Forecast 2023 to 2033, By Application

    6.1. Introduction / Key Findings

    6.2. Historical Market Size Value (US$ million) & Volume (MT) Analysis By Application, 2018 to 2022

    6.3. Current and Future Market Size Value (US$ million) & Volume (MT) Analysis and Forecast By Application, 2023 to 2033

    6.4. Y-o-Y Growth Trend Analysis By Application, 2018 to 2022

    6.5. Absolute $ Opportunity Analysis By Application, 2023 to 2033

7. Global Analysis 2018 to 2022 and Forecast 2023 to 2033, By Type

    7.1. Introduction / Key Findings

    7.2. Historical Market Size Value (US$ million) & Volume (MT) Analysis By Type, 2018 to 2022

    7.3. Current and Future Market Size Value (US$ million) & Volume (MT) Analysis and Forecast By Type, 2023 to 2033

        7.3.1. Stainless steel

        7.3.2. Aluminium

        7.3.3. Plastic

    7.4. Y-o-Y Growth Trend Analysis By Type, 2018 to 2022

    7.5. Absolute $ Opportunity Analysis By Type, 2023 to 2033

8. Global Analysis 2018 to 2022 and Forecast 2023 to 2033, By Mode of operation

    8.1. Introduction / Key Findings

    8.2. Historical Market Size Value (US$ million) & Volume (MT) Analysis By Mode of operation, 2018 to 2022

    8.3. Current and Future Market Size Value (US$ million) & Volume (MT) Analysis and Forecast By Mode of operation, 2023 to 2033

        8.3.1. Tap systems

        8.3.2. Self-serve systems

    8.4. Y-o-Y Growth Trend Analysis By Mode of operation, 2018 to 2022

    8.5. Absolute $ Opportunity Analysis By Mode of operation, 2023 to 2033

9. Global Analysis 2018 to 2022 and Forecast 2023 to 2033, By Region

    9.1. Introduction

    9.2. Historical Market Size Value (US$ million) & Volume (MT) Analysis By Region, 2018 to 2022

    9.3. Current Market Size Value (US$ million) & Volume (MT) Analysis and Forecast By Region, 2023 to 2033

        9.3.1. North America

        9.3.2. Latin America

        9.3.3. Europe

        9.3.4. East Asia

        9.3.5. South Asia

        9.3.6. Oceania

        9.3.7. Middle East and Africa (MEA)

    9.4. Market Attractiveness Analysis By Region

10. North America Analysis 2018 to 2022 and Forecast 2023 to 2033, By Country

    10.1. Historical Market Size Value (US$ million) & Volume (MT) Trend Analysis By Market Taxonomy, 2018 to 2022

    10.2. Market Size Value (US$ million) & Volume (MT) Forecast By Market Taxonomy, 2023 to 2033

        10.2.1. By Country

            10.2.1.1. The USA

            10.2.1.2. Canada

        10.2.2. By Equipment Type

        10.2.3. By Application

        10.2.4. By Type

        10.2.5. By Mode of operation

    10.3. Market Attractiveness Analysis

        10.3.1. By Country

        10.3.2. By Equipment Type

        10.3.3. By Application

        10.3.4. By Type

        10.3.5. By Mode of operation

    10.4. Key Takeaways

11. Latin America Analysis 2018 to 2022 and Forecast 2023 to 2033, By Country

    11.1. Historical Market Size Value (US$ million) & Volume (MT) Trend Analysis By Market Taxonomy, 2018 to 2022

    11.2. Market Size Value (US$ million) & Volume (MT) Forecast By Market Taxonomy, 2023 to 2033

        11.2.1. By Country

            11.2.1.1. Brazil

            11.2.1.2. Mexico

            11.2.1.3. Argentina

            11.2.1.4. Chile

            11.2.1.5. Peru

            11.2.1.6. Rest of Latin America

        11.2.2. By Equipment Type

        11.2.3. By Application

        11.2.4. By Type

        11.2.5. By Mode of operation

    11.3. Market Attractiveness Analysis

        11.3.1. By Country

        11.3.2. By Equipment Type

        11.3.3. By Application

        11.3.4. By Type

        11.3.5. By Mode of operation

    11.4. Key Takeaways

12. Europe Analysis 2018 to 2022 and Forecast 2023 to 2033, By Country

    12.1. Historical Market Size Value (US$ million) & Volume (MT) Trend Analysis By Market Taxonomy, 2018 to 2022

    12.2. Market Size Value (US$ million) & Volume (MT) Forecast By Market Taxonomy, 2023 to 2033

        12.2.1. By Country

            12.2.1.1. Germany

            12.2.1.2. Italy

            12.2.1.3. France

            12.2.1.4. The United Kingdom

            12.2.1.5. Spain

            12.2.1.6. Russia

            12.2.1.7. BENELUX

            12.2.1.8. Poland

            12.2.1.9. Nordic Countries

            12.2.1.10. Rest of Europe

        12.2.2. By Equipment Type

        12.2.3. By Application

        12.2.4. By Type

        12.2.5. By Mode of operation

    12.3. Market Attractiveness Analysis

        12.3.1. By Country

        12.3.2. By Equipment Type

        12.3.3. By Application

        12.3.4. By Type

        12.3.5. By Mode of operation

    12.4. Key Takeaways

13. East Asia Analysis 2018 to 2022 and Forecast 2023 to 2033, By Country

    13.1. Historical Market Size Value (US$ million) & Volume (MT) Trend Analysis By Market Taxonomy, 2018 to 2022

    13.2. Market Size Value (US$ million) & Volume (MT) Forecast By Market Taxonomy, 2023 to 2033

        13.2.1. By Country

            13.2.1.1. China

            13.2.1.2. Japan

            13.2.1.3. South Korea

        13.2.2. By Equipment Type

        13.2.3. By Application

        13.2.4. By Type

        13.2.5. By Mode of operation

    13.3. Market Attractiveness Analysis

        13.3.1. By Country

        13.3.2. By Equipment Type

        13.3.3. By Application

        13.3.4. By Type

        13.3.5. By Mode of operation

    13.4. Key Takeaways

14. South Asia Analysis 2018 to 2022 and Forecast 2023 to 2033, By Country

    14.1. Historical Market Size Value (US$ million) & Volume (MT) Trend Analysis By Market Taxonomy, 2018 to 2022

    14.2. Market Size Value (US$ million) & Volume (MT) Forecast By Market Taxonomy, 2023 to 2033

        14.2.1. By Country

            14.2.1.1. India

            14.2.1.2. Thailand

            14.2.1.3. Malaysia

            14.2.1.4. Indonesia

            14.2.1.5. Singapore

            14.2.1.6. Rest of South Asia

        14.2.2. By Equipment Type

        14.2.3. By Application

        14.2.4. By Type

        14.2.5. By Mode of operation

    14.3. Market Attractiveness Analysis

        14.3.1. By Country

        14.3.2. By Equipment Type

        14.3.3. By Application

        14.3.4. By Type

        14.3.5. By Mode of operation

    14.4. Key Takeaways

15. Oceania Analysis 2018 to 2022 and Forecast 2023 to 2033, By Country

    15.1. Historical Market Size Value (US$ million) & Volume (MT) Trend Analysis By Market Taxonomy, 2018 to 2022

    15.2. Market Size Value (US$ million) & Volume (MT) Forecast By Market Taxonomy, 2023 to 2033

        15.2.1. By Country

            15.2.1.1. Australia

            15.2.1.2. New Zealand

        15.2.2. By Equipment Type

        15.2.3. By Application

        15.2.4. By Type

        15.2.5. By Mode of operation

    15.3. Market Attractiveness Analysis

        15.3.1. By Country

        15.3.2. By Equipment Type

        15.3.3. By Application

        15.3.4. By Type

        15.3.5. By Mode of operation

    15.4. Key Takeaways

16. MEA Analysis 2018 to 2022 and Forecast 2023 to 2033, By Country

    16.1. Historical Market Size Value (US$ million) & Volume (MT) Trend Analysis By Market Taxonomy, 2018 to 2022

    16.2. Market Size Value (US$ million) & Volume (MT) Forecast By Market Taxonomy, 2023 to 2033

        16.2.1. By Country

            16.2.1.1. GCC Countries

            16.2.1.2. South Africa

            16.2.1.3. Central Africa

            16.2.1.4. North Africa

        16.2.2. By Equipment Type

        16.2.3. By Application

        16.2.4. By Type

        16.2.5. By Mode of operation

    16.3. Market Attractiveness Analysis

        16.3.1. By Country

        16.3.2. By Equipment Type

        16.3.3. By Application

        16.3.4. By Type

        16.3.5. By Mode of operation

    16.4. Key Takeaways

17. Key Countries Analysis

    17.1. The USA

        17.1.1. Pricing Analysis

        17.1.2. Market Share Analysis, 2022

            17.1.2.1. By Equipment Type

            17.1.2.2. By Application

            17.1.2.3. By Type

            17.1.2.4. By Mode of operation

    17.2. Canada

        17.2.1. Pricing Analysis

        17.2.2. Market Share Analysis, 2022

            17.2.2.1. By Equipment Type

            17.2.2.2. By Application

            17.2.2.3. By Type

            17.2.2.4. By Mode of operation

    17.3. Brazil

        17.3.1. Pricing Analysis

        17.3.2. Market Share Analysis, 2022

            17.3.2.1. By Equipment Type

            17.3.2.2. By Application

            17.3.2.3. By Type

            17.3.2.4. By Mode of operation

    17.4. Mexico

        17.4.1. Pricing Analysis

        17.4.2. Market Share Analysis, 2022

            17.4.2.1. By Equipment Type

            17.4.2.2. By Application

            17.4.2.3. By Type

            17.4.2.4. By Mode of operation

    17.5. Argentina

        17.5.1. Pricing Analysis

        17.5.2. Market Share Analysis, 2022

            17.5.2.1. By Equipment Type

            17.5.2.2. By Application

            17.5.2.3. By Type

            17.5.2.4. By Mode of operation

    17.6. Chile

        17.6.1. Pricing Analysis

        17.6.2. Market Share Analysis, 2022

            17.6.2.1. By Equipment Type

            17.6.2.2. By Application

            17.6.2.3. By Type

            17.6.2.4. By Mode of operation

    17.7. Peru

        17.7.1. Pricing Analysis

        17.7.2. Market Share Analysis, 2022

            17.7.2.1. By Equipment Type

            17.7.2.2. By Application

            17.7.2.3. By Type

            17.7.2.4. By Mode of operation

    17.8. Germany

        17.8.1. Pricing Analysis

        17.8.2. Market Share Analysis, 2022

            17.8.2.1. By Equipment Type

            17.8.2.2. By Application

            17.8.2.3. By Type

            17.8.2.4. By Mode of operation

    17.9. Italy

        17.9.1. Pricing Analysis

        17.9.2. Market Share Analysis, 2022

            17.9.2.1. By Equipment Type

            17.9.2.2. By Application

            17.9.2.3. By Type

            17.9.2.4. By Mode of operation

    17.10. France

        17.10.1. Pricing Analysis

        17.10.2. Market Share Analysis, 2022

            17.10.2.1. By Equipment Type

            17.10.2.2. By Application

            17.10.2.3. By Type

            17.10.2.4. By Mode of operation

    17.11. Spain

        17.11.1. Pricing Analysis

        17.11.2. Market Share Analysis, 2022

            17.11.2.1. By Equipment Type

            17.11.2.2. By Application

            17.11.2.3. By Type

            17.11.2.4. By Mode of operation

    17.12. The United Kingdom

        17.12.1. Pricing Analysis

        17.12.2. Market Share Analysis, 2022

            17.12.2.1. By Equipment Type

            17.12.2.2. By Application

            17.12.2.3. By Type

            17.12.2.4. By Mode of operation

    17.13. Russia

        17.13.1. Pricing Analysis

        17.13.2. Market Share Analysis, 2022

            17.13.2.1. By Equipment Type

            17.13.2.2. By Application

            17.13.2.3. By Type

            17.13.2.4. By Mode of operation

    17.14. Poland

        17.14.1. Pricing Analysis

        17.14.2. Market Share Analysis, 2022

            17.14.2.1. By Equipment Type

            17.14.2.2. By Application

            17.14.2.3. By Type

            17.14.2.4. By Mode of operation

    17.15. BENELUX

        17.15.1. Pricing Analysis

        17.15.2. Market Share Analysis, 2022

            17.15.2.1. By Equipment Type

            17.15.2.2. By Application

            17.15.2.3. By Type

            17.15.2.4. By Mode of operation

    17.16. Nordic Countries

        17.16.1. Pricing Analysis

        17.16.2. Market Share Analysis, 2022

            17.16.2.1. By Equipment Type

            17.16.2.2. By Application

            17.16.2.3. By Type

            17.16.2.4. By Mode of operation

    17.17. China

        17.17.1. Pricing Analysis

        17.17.2. Market Share Analysis, 2022

            17.17.2.1. By Equipment Type

            17.17.2.2. By Application

            17.17.2.3. By Type

            17.17.2.4. By Mode of operation

    17.18. Japan

        17.18.1. Pricing Analysis

        17.18.2. Market Share Analysis, 2022

            17.18.2.1. By Equipment Type

            17.18.2.2. By Application

            17.18.2.3. By Type

            17.18.2.4. By Mode of operation

    17.19. South Korea

        17.19.1. Pricing Analysis

        17.19.2. Market Share Analysis, 2022

            17.19.2.1. By Equipment Type

            17.19.2.2. By Application

            17.19.2.3. By Type

            17.19.2.4. By Mode of operation

    17.20. India

        17.20.1. Pricing Analysis

        17.20.2. Market Share Analysis, 2022

            17.20.2.1. By Equipment Type

            17.20.2.2. By Application

            17.20.2.3. By Type

            17.20.2.4. By Mode of operation

    17.21. Thailand

        17.21.1. Pricing Analysis

        17.21.2. Market Share Analysis, 2022

            17.21.2.1. By Equipment Type

            17.21.2.2. By Application

            17.21.2.3. By Type

            17.21.2.4. By Mode of operation

    17.22. Indonesia

        17.22.1. Pricing Analysis

        17.22.2. Market Share Analysis, 2022

            17.22.2.1. By Equipment Type

            17.22.2.2. By Application

            17.22.2.3. By Type

            17.22.2.4. By Mode of operation

    17.23. Malaysia

        17.23.1. Pricing Analysis

        17.23.2. Market Share Analysis, 2022

            17.23.2.1. By Equipment Type

            17.23.2.2. By Application

            17.23.2.3. By Type

            17.23.2.4. By Mode of operation

    17.24. Singapore

        17.24.1. Pricing Analysis

        17.24.2. Market Share Analysis, 2022

            17.24.2.1. By Equipment Type

            17.24.2.2. By Application

            17.24.2.3. By Type

            17.24.2.4. By Mode of operation

    17.25. Australia

        17.25.1. Pricing Analysis

        17.25.2. Market Share Analysis, 2022

            17.25.2.1. By Equipment Type

            17.25.2.2. By Application

            17.25.2.3. By Type

            17.25.2.4. By Mode of operation

    17.26. New Zealand

        17.26.1. Pricing Analysis

        17.26.2. Market Share Analysis, 2022

            17.26.2.1. By Equipment Type

            17.26.2.2. By Application

            17.26.2.3. By Type

            17.26.2.4. By Mode of operation

    17.27. GCC Countries

        17.27.1. Pricing Analysis

        17.27.2. Market Share Analysis, 2022

            17.27.2.1. By Equipment Type

            17.27.2.2. By Application

            17.27.2.3. By Type

            17.27.2.4. By Mode of operation

    17.28. South Africa

        17.28.1. Pricing Analysis

        17.28.2. Market Share Analysis, 2022

            17.28.2.1. By Equipment Type

            17.28.2.2. By Application

            17.28.2.3. By Type

            17.28.2.4. By Mode of operation

    17.29. North Africa

        17.29.1. Pricing Analysis

        17.29.2. Market Share Analysis, 2022

            17.29.2.1. By Equipment Type

            17.29.2.2. By Application

            17.29.2.3. By Type

            17.29.2.4. By Mode of operation

    17.30. Central Africa

        17.30.1. Pricing Analysis

        17.30.2. Market Share Analysis, 2022

            17.30.2.1. By Equipment Type

            17.30.2.2. By Application

            17.30.2.3. By Type

            17.30.2.4. By Mode of operation

18. Market Structure Analysis

    18.1. Competition Dashboard

    18.2. Competition Benchmarking

    18.3. Market Share Analysis of Top Players

        18.3.1. By Regional

        18.3.2. By Equipment Type

        18.3.3. By Application

        18.3.4. By Type

        18.3.5. By Mode of operation

19. Competition Analysis

    19.1. Competition Deep Dive

        19.1.1. Heineken N.V

            19.1.1.1. Overview

            19.1.1.2. Product Portfolio

            19.1.1.3. Profitability by Market Segments (Mode of operation/Type /Eqipment Type/Application/Region)

            19.1.1.4. Sales Footprint

            19.1.1.5. Strategy Overview

                19.1.1.5.1. Marketing Strategy

                19.1.1.5.2. Product Strategy

                19.1.1.5.3. Channel Strategy

        19.1.2. Anheuser-Busch InBev

            19.1.2.1. Overview

            19.1.2.2. Product Portfolio

            19.1.2.3. Profitability by Market Segments (Mode of operation/Type /Eqipment Type/Application/Region)

            19.1.2.4. Sales Footprint

            19.1.2.5. Strategy Overview

                19.1.2.5.1. Marketing Strategy

                19.1.2.5.2. Product Strategy

                19.1.2.5.3. Channel Strategy

        19.1.3. Krombacher Brauerei

            19.1.3.1. Overview

            19.1.3.2. Product Portfolio

            19.1.3.3. Profitability by Market Segments (Mode of operation/Type /Eqipment Type/Application/Region)

            19.1.3.4. Sales Footprint

            19.1.3.5. Strategy Overview

                19.1.3.5.1. Marketing Strategy

                19.1.3.5.2. Product Strategy

                19.1.3.5.3. Channel Strategy

        19.1.4. Asahi Breweries

            19.1.4.1. Overview

            19.1.4.2. Product Portfolio

            19.1.4.3. Profitability by Market Segments (Mode of operation/Type /Eqipment Type/Application/Region)

            19.1.4.4. Sales Footprint

            19.1.4.5. Strategy Overview

                19.1.4.5.1. Marketing Strategy

                19.1.4.5.2. Product Strategy

                19.1.4.5.3. Channel Strategy

        19.1.5. Carlsberg Group

            19.1.5.1. Overview

            19.1.5.2. Product Portfolio

            19.1.5.3. Profitability by Market Segments (Mode of operation/Type /Eqipment Type/Application/Region)

            19.1.5.4. Sales Footprint

            19.1.5.5. Strategy Overview

                19.1.5.5.1. Marketing Strategy

                19.1.5.5.2. Product Strategy

                19.1.5.5.3. Channel Strategy

        19.1.6. Diageo plc

            19.1.6.1. Overview

            19.1.6.2. Product Portfolio

            19.1.6.3. Profitability by Market Segments (Mode of operation/Type /Eqipment Type/Application/Region)

            19.1.6.4. Sales Footprint

            19.1.6.5. Strategy Overview

                19.1.6.5.1. Marketing Strategy

                19.1.6.5.2. Product Strategy

                19.1.6.5.3. Channel Strategy

        19.1.7. Cornelius Kegs Ltd

            19.1.7.1. Overview

            19.1.7.2. Product Portfolio

            19.1.7.3. Profitability by Market Segments (Mode of operation/Type /Eqipment Type/Application/Region)

            19.1.7.4. Sales Footprint

            19.1.7.5. Strategy Overview

                19.1.7.5.1. Marketing Strategy

                19.1.7.5.2. Product Strategy

                19.1.7.5.3. Channel Strategy

        19.1.8. Kegco

            19.1.8.1. Overview

            19.1.8.2. Product Portfolio

            19.1.8.3. Profitability by Market Segments (Mode of operation/Type /Eqipment Type/Application/Region)

            19.1.8.4. Sales Footprint

            19.1.8.5. Strategy Overview

                19.1.8.5.1. Marketing Strategy

                19.1.8.5.2. Product Strategy

                19.1.8.5.3. Channel Strategy

        19.1.9. Eppelsheimer

            19.1.9.1. Overview

            19.1.9.2. Product Portfolio

            19.1.9.3. Profitability by Market Segments (Mode of operation/Type /Eqipment Type/Application/Region)

            19.1.9.4. Sales Footprint

            19.1.9.5. Strategy Overview

                19.1.9.5.1. Marketing Strategy

                19.1.9.5.2. Product Strategy

                19.1.9.5.3. Channel Strategy

        19.1.10. Zambelli

            19.1.10.1. Overview

            19.1.10.2. Product Portfolio

            19.1.10.3. Profitability by Market Segments (Mode of operation/Type /Eqipment Type/Application/Region)

            19.1.10.4. Sales Footprint

            19.1.10.5. Strategy Overview

                19.1.10.5.1. Marketing Strategy

                19.1.10.5.2. Product Strategy

                19.1.10.5.3. Channel Strategy

        19.1.11. Lasotherm Technologies

            19.1.11.1. Overview

            19.1.11.2. Product Portfolio

            19.1.11.3. Profitability by Market Segments (Mode of operation/Type /Eqipment Type/Application/Region)

            19.1.11.4. Sales Footprint

            19.1.11.5. Strategy Overview

                19.1.11.5.1. Marketing Strategy

                19.1.11.5.2. Product Strategy

                19.1.11.5.3. Channel Strategy

        19.1.12. Alphatech Process Equipments

            19.1.12.1. Overview

            19.1.12.2. Product Portfolio

            19.1.12.3. Profitability by Market Segments (Mode of operation/Type /Eqipment Type/Application/Region)

            19.1.12.4. Sales Footprint

            19.1.12.5. Strategy Overview

                19.1.12.5.1. Marketing Strategy

                19.1.12.5.2. Product Strategy

                19.1.12.5.3. Channel Strategy

20. Assumptions & Acronyms Used

21. Research Methodology

List of Tables

Table 1: Global Value (US$ million) Forecast by Region, 2018 to 2033

Table 2: Global Volume (MT) Forecast by Region, 2018 to 2033

Table 3: Global Value (US$ million) Forecast by Equipment Type, 2018 to 2033

Table 4: Global Volume (MT) Forecast by Equipment Type, 2018 to 2033

Table 5: Global Value (US$ million) Forecast by Application, 2018 to 2033

Table 6: Global Volume (MT) Forecast by Application, 2018 to 2033

Table 7: Global Value (US$ million) Forecast by Type, 2018 to 2033

Table 8: Global Volume (MT) Forecast by Type, 2018 to 2033

Table 9: Global Value (US$ million) Forecast by Mode of operation, 2018 to 2033

Table 10: Global Volume (MT) Forecast by Mode of operation, 2018 to 2033

Table 11: North America Value (US$ million) Forecast by Country, 2018 to 2033

Table 12: North America Volume (MT) Forecast by Country, 2018 to 2033

Table 13: North America Value (US$ million) Forecast by Equipment Type, 2018 to 2033

Table 14: North America Volume (MT) Forecast by Equipment Type, 2018 to 2033

Table 15: North America Value (US$ million) Forecast by Application, 2018 to 2033

Table 16: North America Volume (MT) Forecast by Application, 2018 to 2033

Table 17: North America Value (US$ million) Forecast by Type, 2018 to 2033

Table 18: North America Volume (MT) Forecast by Type, 2018 to 2033

Table 19: North America Value (US$ million) Forecast by Mode of operation, 2018 to 2033

Table 20: North America Volume (MT) Forecast by Mode of operation, 2018 to 2033

Table 21: Latin America Value (US$ million) Forecast by Country, 2018 to 2033

Table 22: Latin America Volume (MT) Forecast by Country, 2018 to 2033

Table 23: Latin America Value (US$ million) Forecast by Equipment Type, 2018 to 2033

Table 24: Latin America Volume (MT) Forecast by Equipment Type, 2018 to 2033

Table 25: Latin America Value (US$ million) Forecast by Application, 2018 to 2033

Table 26: Latin America Volume (MT) Forecast by Application, 2018 to 2033

Table 27: Latin America Value (US$ million) Forecast by Type, 2018 to 2033

Table 28: Latin America Volume (MT) Forecast by Type, 2018 to 2033

Table 29: Latin America Value (US$ million) Forecast by Mode of operation, 2018 to 2033

Table 30: Latin America Volume (MT) Forecast by Mode of operation, 2018 to 2033

Table 31: Europe Value (US$ million) Forecast by Country, 2018 to 2033

Table 32: Europe Volume (MT) Forecast by Country, 2018 to 2033

Table 33: Europe Value (US$ million) Forecast by Equipment Type, 2018 to 2033

Table 34: Europe Volume (MT) Forecast by Equipment Type, 2018 to 2033

Table 35: Europe Value (US$ million) Forecast by Application, 2018 to 2033

Table 36: Europe Volume (MT) Forecast by Application, 2018 to 2033

Table 37: Europe Value (US$ million) Forecast by Type, 2018 to 2033

Table 38: Europe Volume (MT) Forecast by Type, 2018 to 2033

Table 39: Europe Value (US$ million) Forecast by Mode of operation, 2018 to 2033

Table 40: Europe Volume (MT) Forecast by Mode of operation, 2018 to 2033

Table 41: East Asia Value (US$ million) Forecast by Country, 2018 to 2033

Table 42: East Asia Volume (MT) Forecast by Country, 2018 to 2033

Table 43: East Asia Value (US$ million) Forecast by Equipment Type, 2018 to 2033

Table 44: East Asia Volume (MT) Forecast by Equipment Type, 2018 to 2033

Table 45: East Asia Value (US$ million) Forecast by Application, 2018 to 2033

Table 46: East Asia Volume (MT) Forecast by Application, 2018 to 2033

Table 47: East Asia Value (US$ million) Forecast by Type, 2018 to 2033

Table 48: East Asia Volume (MT) Forecast by Type, 2018 to 2033

Table 49: East Asia Value (US$ million) Forecast by Mode of operation, 2018 to 2033

Table 50: East Asia Volume (MT) Forecast by Mode of operation, 2018 to 2033

Table 51: South Asia Value (US$ million) Forecast by Country, 2018 to 2033

Table 52: South Asia Volume (MT) Forecast by Country, 2018 to 2033

Table 53: South Asia Value (US$ million) Forecast by Equipment Type, 2018 to 2033

Table 54: South Asia Volume (MT) Forecast by Equipment Type, 2018 to 2033

Table 55: South Asia Value (US$ million) Forecast by Application, 2018 to 2033

Table 56: South Asia Volume (MT) Forecast by Application, 2018 to 2033

Table 57: South Asia Value (US$ million) Forecast by Type, 2018 to 2033

Table 58: South Asia Volume (MT) Forecast by Type, 2018 to 2033

Table 59: South Asia Value (US$ million) Forecast by Mode of operation, 2018 to 2033

Table 60: South Asia Volume (MT) Forecast by Mode of operation, 2018 to 2033

Table 61: Oceania Value (US$ million) Forecast by Country, 2018 to 2033

Table 62: Oceania Volume (MT) Forecast by Country, 2018 to 2033

Table 63: Oceania Value (US$ million) Forecast by Equipment Type, 2018 to 2033

Table 64: Oceania Volume (MT) Forecast by Equipment Type, 2018 to 2033

Table 65: Oceania Value (US$ million) Forecast by Application, 2018 to 2033

Table 66: Oceania Volume (MT) Forecast by Application, 2018 to 2033

Table 67: Oceania Value (US$ million) Forecast by Type, 2018 to 2033

Table 68: Oceania Volume (MT) Forecast by Type, 2018 to 2033

Table 69: Oceania Value (US$ million) Forecast by Mode of operation, 2018 to 2033

Table 70: Oceania Volume (MT) Forecast by Mode of operation, 2018 to 2033

Table 71: MEA Value (US$ million) Forecast by Country, 2018 to 2033

Table 72: MEA Volume (MT) Forecast by Country, 2018 to 2033

Table 73: MEA Value (US$ million) Forecast by Equipment Type, 2018 to 2033

Table 74: MEA Volume (MT) Forecast by Equipment Type, 2018 to 2033

Table 75: MEA Value (US$ million) Forecast by Application, 2018 to 2033

Table 76: MEA Volume (MT) Forecast by Application, 2018 to 2033

Table 77: MEA Value (US$ million) Forecast by Type, 2018 to 2033

Table 78: MEA Volume (MT) Forecast by Type, 2018 to 2033

Table 79: MEA Value (US$ million) Forecast by Mode of operation, 2018 to 2033

Table 80: MEA Volume (MT) Forecast by Mode of operation, 2018 to 2033

List of Charts

Figure 1: Global Value (US$ million) by Equipment Type, 2023 to 2033

Figure 2: Global Value (US$ million) by Application, 2023 to 2033

Figure 3: Global Value (US$ million) by Type, 2023 to 2033

Figure 4: Global Value (US$ million) by Mode of operation, 2023 to 2033

Figure 5: Global Value (US$ million) by Region, 2023 to 2033

Figure 6: Global Value (US$ million) Analysis by Region, 2018 to 2033

Figure 7: Global Volume (MT) Analysis by Region, 2018 to 2033

Figure 8: Global Value Share (%) and BPS Analysis by Region, 2023 to 2033

Figure 9: Global Y-o-Y Growth (%) Projections by Region, 2023 to 2033

Figure 10: Global Value (US$ million) Analysis by Equipment Type, 2018 to 2033

Figure 11: Global Volume (MT) Analysis by Equipment Type, 2018 to 2033

Figure 12: Global Value Share (%) and BPS Analysis by Equipment Type, 2023 to 2033

Figure 13: Global Y-o-Y Growth (%) Projections by Equipment Type, 2023 to 2033

Figure 14: Global Value (US$ million) Analysis by Application, 2018 to 2033

Figure 15: Global Volume (MT) Analysis by Application, 2018 to 2033

Figure 16: Global Value Share (%) and BPS Analysis by Application, 2023 to 2033

Figure 17: Global Y-o-Y Growth (%) Projections by Application, 2023 to 2033

Figure 18: Global Value (US$ million) Analysis by Type, 2018 to 2033

Figure 19: Global Volume (MT) Analysis by Type, 2018 to 2033

Figure 20: Global Value Share (%) and BPS Analysis by Type, 2023 to 2033

Figure 21: Global Y-o-Y Growth (%) Projections by Type, 2023 to 2033

Figure 22: Global Value (US$ million) Analysis by Mode of operation, 2018 to 2033

Figure 23: Global Volume (MT) Analysis by Mode of operation, 2018 to 2033

Figure 24: Global Value Share (%) and BPS Analysis by Mode of operation, 2023 to 2033

Figure 25: Global Y-o-Y Growth (%) Projections by Mode of operation, 2023 to 2033

Figure 26: Global Attractiveness by Equipment Type, 2023 to 2033

Figure 27: Global Attractiveness by Application, 2023 to 2033

Figure 28: Global Attractiveness by Type, 2023 to 2033

Figure 29: Global Attractiveness by Mode of operation, 2023 to 2033

Figure 30: Global Attractiveness by Region, 2023 to 2033

Figure 31: North America Value (US$ million) by Equipment Type, 2023 to 2033

Figure 32: North America Value (US$ million) by Application, 2023 to 2033

Figure 33: North America Value (US$ million) by Type, 2023 to 2033

Figure 34: North America Value (US$ million) by Mode of operation, 2023 to 2033

Figure 35: North America Value (US$ million) by Country, 2023 to 2033

Figure 36: North America Value (US$ million) Analysis by Country, 2018 to 2033

Figure 37: North America Volume (MT) Analysis by Country, 2018 to 2033

Figure 38: North America Value Share (%) and BPS Analysis by Country, 2023 to 2033

Figure 39: North America Y-o-Y Growth (%) Projections by Country, 2023 to 2033

Figure 40: North America Value (US$ million) Analysis by Equipment Type, 2018 to 2033

Figure 41: North America Volume (MT) Analysis by Equipment Type, 2018 to 2033

Figure 42: North America Value Share (%) and BPS Analysis by Equipment Type, 2023 to 2033

Figure 43: North America Y-o-Y Growth (%) Projections by Equipment Type, 2023 to 2033

Figure 44: North America Value (US$ million) Analysis by Application, 2018 to 2033

Figure 45: North America Volume (MT) Analysis by Application, 2018 to 2033

Figure 46: North America Value Share (%) and BPS Analysis by Application, 2023 to 2033

Figure 47: North America Y-o-Y Growth (%) Projections by Application, 2023 to 2033

Figure 48: North America Value (US$ million) Analysis by Type, 2018 to 2033

Figure 49: North America Volume (MT) Analysis by Type, 2018 to 2033

Figure 50: North America Value Share (%) and BPS Analysis by Type, 2023 to 2033

Figure 51: North America Y-o-Y Growth (%) Projections by Type, 2023 to 2033

Figure 52: North America Value (US$ million) Analysis by Mode of operation, 2018 to 2033

Figure 53: North America Volume (MT) Analysis by Mode of operation, 2018 to 2033

Figure 54: North America Value Share (%) and BPS Analysis by Mode of operation, 2023 to 2033

Figure 55: North America Y-o-Y Growth (%) Projections by Mode of operation, 2023 to 2033

Figure 56: North America Attractiveness by Equipment Type, 2023 to 2033

Figure 57: North America Attractiveness by Application, 2023 to 2033

Figure 58: North America Attractiveness by Type, 2023 to 2033

Figure 59: North America Attractiveness by Mode of operation, 2023 to 2033

Figure 60: North America Attractiveness by Country, 2023 to 2033

Figure 61: Latin America Value (US$ million) by Equipment Type, 2023 to 2033

Figure 62: Latin America Value (US$ million) by Application, 2023 to 2033

Figure 63: Latin America Value (US$ million) by Type, 2023 to 2033

Figure 64: Latin America Value (US$ million) by Mode of operation, 2023 to 2033

Figure 65: Latin America Value (US$ million) by Country, 2023 to 2033

Figure 66: Latin America Value (US$ million) Analysis by Country, 2018 to 2033

Figure 67: Latin America Volume (MT) Analysis by Country, 2018 to 2033

Figure 68: Latin America Value Share (%) and BPS Analysis by Country, 2023 to 2033

Figure 69: Latin America Y-o-Y Growth (%) Projections by Country, 2023 to 2033

Figure 70: Latin America Value (US$ million) Analysis by Equipment Type, 2018 to 2033

Figure 71: Latin America Volume (MT) Analysis by Equipment Type, 2018 to 2033

Figure 72: Latin America Value Share (%) and BPS Analysis by Equipment Type, 2023 to 2033

Figure 73: Latin America Y-o-Y Growth (%) Projections by Equipment Type, 2023 to 2033

Figure 74: Latin America Value (US$ million) Analysis by Application, 2018 to 2033

Figure 75: Latin America Volume (MT) Analysis by Application, 2018 to 2033

Figure 76: Latin America Value Share (%) and BPS Analysis by Application, 2023 to 2033

Figure 77: Latin America Y-o-Y Growth (%) Projections by Application, 2023 to 2033

Figure 78: Latin America Value (US$ million) Analysis by Type, 2018 to 2033

Figure 79: Latin America Volume (MT) Analysis by Type, 2018 to 2033

Figure 80: Latin America Value Share (%) and BPS Analysis by Type, 2023 to 2033

Figure 81: Latin America Y-o-Y Growth (%) Projections by Type, 2023 to 2033

Figure 82: Latin America Value (US$ million) Analysis by Mode of operation, 2018 to 2033

Figure 83: Latin America Volume (MT) Analysis by Mode of operation, 2018 to 2033

Figure 84: Latin America Value Share (%) and BPS Analysis by Mode of operation, 2023 to 2033

Figure 85: Latin America Y-o-Y Growth (%) Projections by Mode of operation, 2023 to 2033

Figure 86: Latin America Attractiveness by Equipment Type, 2023 to 2033

Figure 87: Latin America Attractiveness by Application, 2023 to 2033

Figure 88: Latin America Attractiveness by Type, 2023 to 2033

Figure 89: Latin America Attractiveness by Mode of operation, 2023 to 2033

Figure 90: Latin America Attractiveness by Country, 2023 to 2033

Figure 91: Europe Value (US$ million) by Equipment Type, 2023 to 2033

Figure 92: Europe Value (US$ million) by Application, 2023 to 2033

Figure 93: Europe Value (US$ million) by Type, 2023 to 2033

Figure 94: Europe Value (US$ million) by Mode of operation, 2023 to 2033

Figure 95: Europe Value (US$ million) by Country, 2023 to 2033

Figure 96: Europe Value (US$ million) Analysis by Country, 2018 to 2033

Figure 97: Europe Volume (MT) Analysis by Country, 2018 to 2033

Figure 98: Europe Value Share (%) and BPS Analysis by Country, 2023 to 2033

Figure 99: Europe Y-o-Y Growth (%) Projections by Country, 2023 to 2033

Figure 100: Europe Value (US$ million) Analysis by Equipment Type, 2018 to 2033

Figure 101: Europe Volume (MT) Analysis by Equipment Type, 2018 to 2033

Figure 102: Europe Value Share (%) and BPS Analysis by Equipment Type, 2023 to 2033

Figure 103: Europe Y-o-Y Growth (%) Projections by Equipment Type, 2023 to 2033

Figure 104: Europe Value (US$ million) Analysis by Application, 2018 to 2033

Figure 105: Europe Volume (MT) Analysis by Application, 2018 to 2033

Figure 106: Europe Value Share (%) and BPS Analysis by Application, 2023 to 2033

Figure 107: Europe Y-o-Y Growth (%) Projections by Application, 2023 to 2033

Figure 108: Europe Value (US$ million) Analysis by Type, 2018 to 2033

Figure 109: Europe Volume (MT) Analysis by Type, 2018 to 2033

Figure 110: Europe Value Share (%) and BPS Analysis by Type, 2023 to 2033

Figure 111: Europe Y-o-Y Growth (%) Projections by Type, 2023 to 2033

Figure 112: Europe Value (US$ million) Analysis by Mode of operation, 2018 to 2033

Figure 113: Europe Volume (MT) Analysis by Mode of operation, 2018 to 2033

Figure 114: Europe Value Share (%) and BPS Analysis by Mode of operation, 2023 to 2033

Figure 115: Europe Y-o-Y Growth (%) Projections by Mode of operation, 2023 to 2033

Figure 116: Europe Attractiveness by Equipment Type, 2023 to 2033

Figure 117: Europe Attractiveness by Application, 2023 to 2033

Figure 118: Europe Attractiveness by Type, 2023 to 2033

Figure 119: Europe Attractiveness by Mode of operation, 2023 to 2033

Figure 120: Europe Attractiveness by Country, 2023 to 2033

Figure 121: East Asia Value (US$ million) by Equipment Type, 2023 to 2033

Figure 122: East Asia Value (US$ million) by Application, 2023 to 2033

Figure 123: East Asia Value (US$ million) by Type, 2023 to 2033

Figure 124: East Asia Value (US$ million) by Mode of operation, 2023 to 2033

Figure 125: East Asia Value (US$ million) by Country, 2023 to 2033

Figure 126: East Asia Value (US$ million) Analysis by Country, 2018 to 2033

Figure 127: East Asia Volume (MT) Analysis by Country, 2018 to 2033

Figure 128: East Asia Value Share (%) and BPS Analysis by Country, 2023 to 2033

Figure 129: East Asia Y-o-Y Growth (%) Projections by Country, 2023 to 2033

Figure 130: East Asia Value (US$ million) Analysis by Equipment Type, 2018 to 2033

Figure 131: East Asia Volume (MT) Analysis by Equipment Type, 2018 to 2033

Figure 132: East Asia Value Share (%) and BPS Analysis by Equipment Type, 2023 to 2033

Figure 133: East Asia Y-o-Y Growth (%) Projections by Equipment Type, 2023 to 2033

Figure 134: East Asia Value (US$ million) Analysis by Application, 2018 to 2033

Figure 135: East Asia Volume (MT) Analysis by Application, 2018 to 2033

Figure 136: East Asia Value Share (%) and BPS Analysis by Application, 2023 to 2033

Figure 137: East Asia Y-o-Y Growth (%) Projections by Application, 2023 to 2033

Figure 138: East Asia Value (US$ million) Analysis by Type, 2018 to 2033

Figure 139: East Asia Volume (MT) Analysis by Type, 2018 to 2033

Figure 140: East Asia Value Share (%) and BPS Analysis by Type, 2023 to 2033

Figure 141: East Asia Y-o-Y Growth (%) Projections by Type, 2023 to 2033

Figure 142: East Asia Value (US$ million) Analysis by Mode of operation, 2018 to 2033

Figure 143: East Asia Volume (MT) Analysis by Mode of operation, 2018 to 2033

Figure 144: East Asia Value Share (%) and BPS Analysis by Mode of operation, 2023 to 2033

Figure 145: East Asia Y-o-Y Growth (%) Projections by Mode of operation, 2023 to 2033

Figure 146: East Asia Attractiveness by Equipment Type, 2023 to 2033

Figure 147: East Asia Attractiveness by Application, 2023 to 2033

Figure 148: East Asia Attractiveness by Type, 2023 to 2033

Figure 149: East Asia Attractiveness by Mode of operation, 2023 to 2033

Figure 150: East Asia Attractiveness by Country, 2023 to 2033

Figure 151: South Asia Value (US$ million) by Equipment Type, 2023 to 2033

Figure 152: South Asia Value (US$ million) by Application, 2023 to 2033

Figure 153: South Asia Value (US$ million) by Type, 2023 to 2033

Figure 154: South Asia Value (US$ million) by Mode of operation, 2023 to 2033

Figure 155: South Asia Value (US$ million) by Country, 2023 to 2033

Figure 156: South Asia Value (US$ million) Analysis by Country, 2018 to 2033

Figure 157: South Asia Volume (MT) Analysis by Country, 2018 to 2033

Figure 158: South Asia Value Share (%) and BPS Analysis by Country, 2023 to 2033

Figure 159: South Asia Y-o-Y Growth (%) Projections by Country, 2023 to 2033

Figure 160: South Asia Value (US$ million) Analysis by Equipment Type, 2018 to 2033

Figure 161: South Asia Volume (MT) Analysis by Equipment Type, 2018 to 2033

Figure 162: South Asia Value Share (%) and BPS Analysis by Equipment Type, 2023 to 2033

Figure 163: South Asia Y-o-Y Growth (%) Projections by Equipment Type, 2023 to 2033

Figure 164: South Asia Value (US$ million) Analysis by Application, 2018 to 2033

Figure 165: South Asia Volume (MT) Analysis by Application, 2018 to 2033

Figure 166: South Asia Value Share (%) and BPS Analysis by Application, 2023 to 2033

Figure 167: South Asia Y-o-Y Growth (%) Projections by Application, 2023 to 2033

Figure 168: South Asia Value (US$ million) Analysis by Type, 2018 to 2033

Figure 169: South Asia Volume (MT) Analysis by Type, 2018 to 2033

Figure 170: South Asia Value Share (%) and BPS Analysis by Type, 2023 to 2033

Figure 171: South Asia Y-o-Y Growth (%) Projections by Type, 2023 to 2033

Figure 172: South Asia Value (US$ million) Analysis by Mode of operation, 2018 to 2033

Figure 173: South Asia Volume (MT) Analysis by Mode of operation, 2018 to 2033

Figure 174: South Asia Value Share (%) and BPS Analysis by Mode of operation, 2023 to 2033

Figure 175: South Asia Y-o-Y Growth (%) Projections by Mode of operation, 2023 to 2033

Figure 176: South Asia Attractiveness by Equipment Type, 2023 to 2033

Figure 177: South Asia Attractiveness by Application, 2023 to 2033

Figure 178: South Asia Attractiveness by Type, 2023 to 2033

Figure 179: South Asia Attractiveness by Mode of operation, 2023 to 2033

Figure 180: South Asia Attractiveness by Country, 2023 to 2033

Figure 181: Oceania Value (US$ million) by Equipment Type, 2023 to 2033

Figure 182: Oceania Value (US$ million) by Application, 2023 to 2033

Figure 183: Oceania Value (US$ million) by Type, 2023 to 2033

Figure 184: Oceania Value (US$ million) by Mode of operation, 2023 to 2033

Figure 185: Oceania Value (US$ million) by Country, 2023 to 2033

Figure 186: Oceania Value (US$ million) Analysis by Country, 2018 to 2033

Figure 187: Oceania Volume (MT) Analysis by Country, 2018 to 2033

Figure 188: Oceania Value Share (%) and BPS Analysis by Country, 2023 to 2033

Figure 189: Oceania Y-o-Y Growth (%) Projections by Country, 2023 to 2033

Figure 190: Oceania Value (US$ million) Analysis by Equipment Type, 2018 to 2033

Figure 191: Oceania Volume (MT) Analysis by Equipment Type, 2018 to 2033

Figure 192: Oceania Value Share (%) and BPS Analysis by Equipment Type, 2023 to 2033

Figure 193: Oceania Y-o-Y Growth (%) Projections by Equipment Type, 2023 to 2033

Figure 194: Oceania Value (US$ million) Analysis by Application, 2018 to 2033

Figure 195: Oceania Volume (MT) Analysis by Application, 2018 to 2033

Figure 196: Oceania Value Share (%) and BPS Analysis by Application, 2023 to 2033

Figure 197: Oceania Y-o-Y Growth (%) Projections by Application, 2023 to 2033

Figure 198: Oceania Value (US$ million) Analysis by Type, 2018 to 2033

Figure 199: Oceania Volume (MT) Analysis by Type, 2018 to 2033

Figure 200: Oceania Value Share (%) and BPS Analysis by Type, 2023 to 2033

Figure 201: Oceania Y-o-Y Growth (%) Projections by Type, 2023 to 2033

Figure 202: Oceania Value (US$ million) Analysis by Mode of operation, 2018 to 2033

Figure 203: Oceania Volume (MT) Analysis by Mode of operation, 2018 to 2033

Figure 204: Oceania Value Share (%) and BPS Analysis by Mode of operation, 2023 to 2033

Figure 205: Oceania Y-o-Y Growth (%) Projections by Mode of operation, 2023 to 2033

Figure 206: Oceania Attractiveness by Equipment Type, 2023 to 2033

Figure 207: Oceania Attractiveness by Application, 2023 to 2033

Figure 208: Oceania Attractiveness by Type, 2023 to 2033

Figure 209: Oceania Attractiveness by Mode of operation, 2023 to 2033

Figure 210: Oceania Attractiveness by Country, 2023 to 2033

Figure 211: MEA Value (US$ million) by Equipment Type, 2023 to 2033

Figure 212: MEA Value (US$ million) by Application, 2023 to 2033

Figure 213: MEA Value (US$ million) by Type, 2023 to 2033

Figure 214: MEA Value (US$ million) by Mode of operation, 2023 to 2033

Figure 215: MEA Value (US$ million) by Country, 2023 to 2033

Figure 216: MEA Value (US$ million) Analysis by Country, 2018 to 2033

Figure 217: MEA Volume (MT) Analysis by Country, 2018 to 2033

Figure 218: MEA Value Share (%) and BPS Analysis by Country, 2023 to 2033

Figure 219: MEA Y-o-Y Growth (%) Projections by Country, 2023 to 2033

Figure 220: MEA Value (US$ million) Analysis by Equipment Type, 2018 to 2033

Figure 221: MEA Volume (MT) Analysis by Equipment Type, 2018 to 2033

Figure 222: MEA Value Share (%) and BPS Analysis by Equipment Type, 2023 to 2033

Figure 223: MEA Y-o-Y Growth (%) Projections by Equipment Type, 2023 to 2033

Figure 224: MEA Value (US$ million) Analysis by Application, 2018 to 2033

Figure 225: MEA Volume (MT) Analysis by Application, 2018 to 2033

Figure 226: MEA Value Share (%) and BPS Analysis by Application, 2023 to 2033

Figure 227: MEA Y-o-Y Growth (%) Projections by Application, 2023 to 2033

Figure 228: MEA Value (US$ million) Analysis by Type, 2018 to 2033

Figure 229: MEA Volume (MT) Analysis by Type, 2018 to 2033

Figure 230: MEA Value Share (%) and BPS Analysis by Type, 2023 to 2033

Figure 231: MEA Y-o-Y Growth (%) Projections by Type, 2023 to 2033

Figure 232: MEA Value (US$ million) Analysis by Mode of operation, 2018 to 2033

Figure 233: MEA Volume (MT) Analysis by Mode of operation, 2018 to 2033

Figure 234: MEA Value Share (%) and BPS Analysis by Mode of operation, 2023 to 2033

Figure 235: MEA Y-o-Y Growth (%) Projections by Mode of operation, 2023 to 2033

Figure 236: MEA Attractiveness by Equipment Type, 2023 to 2033

Figure 237: MEA Attractiveness by Application, 2023 to 2033

Figure 238: MEA Attractiveness by Type, 2023 to 2033

Figure 239: MEA Attractiveness by Mode of operation, 2023 to 2033

Figure 240: MEA Attractiveness by Country, 2023 to 2033

Explore Process Automation Insights

View Reports

Portable Keg System Market