Sand Screens Market Size and Share Forecast Outlook 2025 to 2035

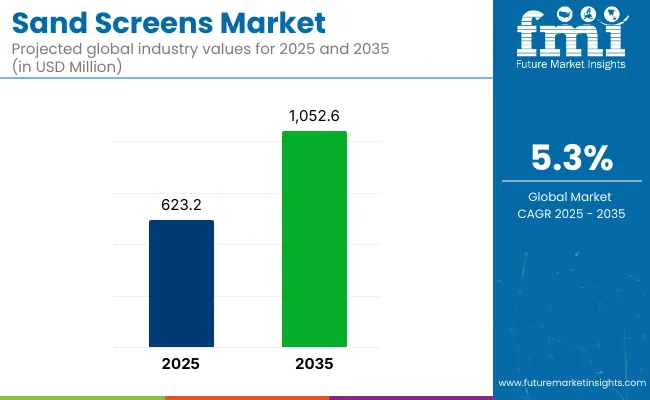
The global sand screens market is valued at USD 623.2 million in 2025 and is expected to reach USD 1,052.6 million by 2035, reflecting a CAGR of 5.3%.
Quick Stats of Sand Screens Market

  • Market Value (2025): USD 623.2 million
  • Forecast Value (2035): USD 1,052.6 million
  • Forecast CAGR: 5.3%
  • Type Leader in 2025: Stand-Alone Sand Screens (65% Market Share)
  • Top Well Type Segment: Land-Based Wells (70% Market Share)
  • Key Growth Region: North America (fastest-growing market in the USA with 10.0% CAGR)

Sand Screens Market

Metric Value
Estimated Size (2025) USD 623.2 million
Projected value (2035) USD 1,052.6 million
CAGR (2025-2035) 5.3%

Growth will be driven by the rising need for effective sand control in mature and unconventional oil and gas reservoirs, along with technological advancements in corrosion-resistant alloys and environment-friendly composite materials. Increasing drilling activities in shale formations and expanding offshore exploration projects are also expected to support market expansion during the forecast period.

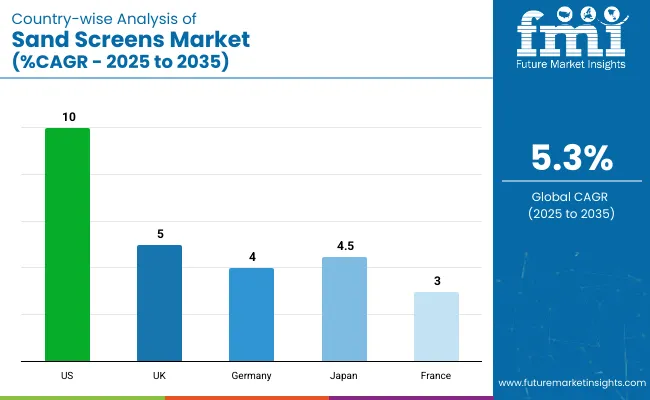
In 2025, the USA is expected to remain the largest market for sand screens due to strong oil and gas exploration, expanding rapidly at a CAGR of 10.0% through 2035. On the other hand, the UK is also experiencing steady growth at a CAGR of 5.0%. Stand-alone sand screens by type are likely to maintain a significant market share of around 65%, whereas land-based well screens by well type are expected to account for nearly 70% of the market share in 2025.

During the assessment period, companies such as Schlumberger and Halliburton are likely to see significant profits owing to their diversified sand control solutions portfolios. However, manufacturers in Asia-Pacific might face challenges due to price sensitivity and limited adoption of advanced technologies, even as investments increase.

Government regulations in Western Europe mandating eco-friendly materials and low-carbon manufacturing are expected to drive the development of sustainable sand screens, while stricter environmental standards in the USA will enforce innovation in low-impact technologies.

Sand screens hold approximately 35% to 40% share in the sand control systems market, as they are essential components in preventing formation sand intrusion during oil and gas production. In the well completion equipment market, they account for around 18% to 22%, supporting efficient reservoir inflow management.

Within the downhole tools market, sand screens contribute roughly 10% to 12%, primarily used in horizontal and high-pressure wells. In the broader oilfield equipment market, their share is about 6% to 8%. Their role in reservoir management and drilling and production equipment markets is smaller, estimated between 4% to 6%, supporting zonal isolation and productivity.

Analyzing Sand Screens Market by Top Investment Segments

The sand screens market has been segmented into type, well type, and region. By type, it includes stand-alone and remedial or artificial lift protection. By well type, it is segmented into land and offshore. By region, it covers North America, Latin America, Western Europe, Eastern Europe, South Asia and the Pacific, East Asia, the Middle East and Africa.

By Type, Stand-Alone Sand Screens Account for nearly 65% of the Market Share

Stand-alone sand screens are projected to remain the dominant type, accounting for approximately 65% market share through 2035. Their widespread use in unconsolidated formations, particularly for open-hole completions, is driving growth. These screens are preferred for their cost efficiency and operational simplicity compared to remedial or artificial lift protection screens. Adoption is further supported by their ability to control sand production without the need for complex gravel packing, reducing installation time and overall operational costs.
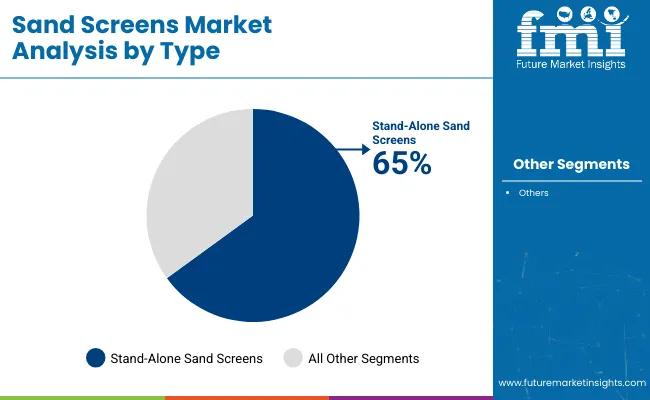
  • Stand-alone screens hold nearly 65% share.
  • Preferred for open-hole completions in unconsolidated formations.
  • Reduce installation time and operational complexity.
  • Increasingly adopted in shale gas and heavy oil applications.

Sand Screens Market Analysis By Type

By Well Type, Land-Based Wells Account for nearly 70% of the Market Share

Land-based wells are expected to maintain dominance with an estimated 70% market share by 2035. The segment benefits from the sheer scale of onshore drilling globally, particularly in shale plays and heavy oil reservoirs. Cost efficiency, ease of access, and the rise of unconventional resource development contribute to segment growth. Land wells are preferred for their lower operational costs and scalability in countries such as the USA, China, and India, where large onshore reserves are actively exploited.
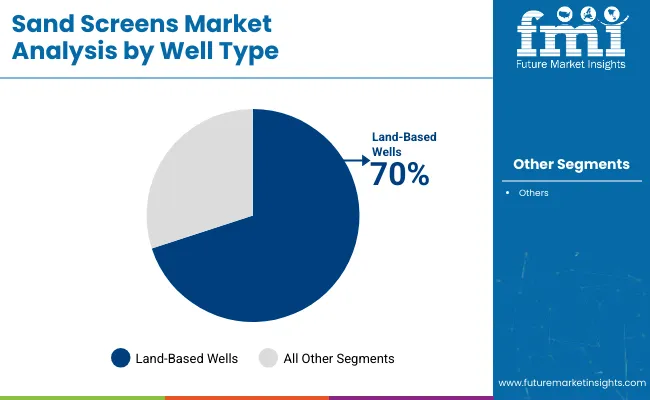
  • Land-based wells hold nearly 70% share.
  • High drilling activity in shale and heavy oil reservoirs.
  • Lower operational costs compared to offshore wells.
  • Significant growth driven by USA and China investments.

Sand Screens Market Analysis By Well Type

Top Sand Screens Market Dynamics

Recent Trends in the Sand Screens Market

  • Adoption of corrosion-resistant alloys and recyclable composite materials has been increasing to meet environmental regulations.
  • Integration of IoT and AI-based sensors in sand screens is enhancing real-time well monitoring and performance optimization.
  • Growing investments in shale gas and unconventional resource exploration have been accelerating demand for stand-alone sand screens.
  • Strategic partnerships between sand screen manufacturers and oilfield service companies are expanding market reach and technology capabilities.

Challenges in the Sand Screens Market

  • Volatile oil and gas prices have been creating uncertainty in drilling activities and capital investments.
  • Stringent environmental regulations in regions like Western Europe have been increasing compliance costs for manufacturers.
  • Supply chain disruptions, especially for specialty alloys and advanced materials, have been affecting production timelines.
  • Limited adoption of advanced sand control technologies in cost-sensitive markets such as Asia-Pacific has been restricting potential growth.

Analyzing Top Countries Distributing, and Supplying Sand Screens

Country Wise Analysis Of Sand Screens Market Cagr 2025 To 2035

The USA leads the sand screens market with a robust 10.0% CAGR (2025 to 2035), fueled by shale gas activities and smart sand control adoption. The UK follows with a 5.0% CAGR, supported by North Sea asset optimization and improved recovery methods. Japan, growing at 4.5%, leverages its strong manufacturing and offshore supply chain role.

Germany, at 4.0% CAGR, benefits from its export-focused, precision-engineering strength despite minimal domestic production. France lags with a 3.0% CAGR due to its renewable energy focus, yet remains active in global oilfield ventures. Across these countries, innovation, offshore development, and advanced drilling drive varying growth levels.

The report covers in-depth analysis of 40+ countries; five top-performing OECD countries are highlighted below.

USA Sand Screens Market Analysis

The sand screens demand in the USA is projected to grow at a CAGR of 10.0% from 2025 to 2035. Growth will be driven by robust shale gas exploration and production activities, especially in the Permian Basin and Eagle Ford Shale regions. Adoption of advanced hydraulic fracturing and horizontal drilling technologies has been creating strong demand for effective sand control solutions. Additionally, a well-established oilfield services ecosystem is supporting market expansion.

  • Strong investments in shale gas exploration and production.
  • Adoption of intelligent sand screens with IoT-based monitoring.
  • Increasing focus on energy independence to boost drilling activities.

Sand Screens Sales Analysis in the UK

The sand screens revenue in the UK is anticipated to register a CAGR of 5.0% from 2025 to 2035. Growth will be supported by efforts to maximize recovery from mature North Sea fields and government initiatives encouraging exploration and production investments. Adoption of improved oil recovery methods and focus on extending the life of existing offshore assets will continue to drive demand for advanced sand control screens.

  • Government support to prolong North Sea oilfield production.
  • Implementation of improved oil recovery techniques.
  • Rising demand for environmentally friendly sand screen materials.

Germany Sand Screens Market Analysis

The sales of sand screens in Germany are forecast to grow at a CAGR of 4.0% from 2025 to 2035. Growth prospects stem from the country’s strong engineering and equipment manufacturing base, which supplies high-grade sand control technologies globally. Despite limited domestic oil and gas production, German manufacturers are well-positioned to export precision-engineered sand screens to international oilfield markets.

  • Leading global supplier of precision-engineered sand screens.
  • Emphasis on sustainable and low-carbon manufacturing processes.
  • Strong technological capabilities drive export market growth.

Sand Screens Demand Analysis in France

The sand screens revenue in France is expected to expand at a CAGR of 3.0% from 2025 to 2035. Growth remains moderate due to limited domestic oil and gas production and a national focus on renewable energy. However, participation in cross-border oil and gas ventures and advancements in sand control technologies by French firms are supporting their international market presence.

  • Limited domestic oil production with reliance on imports.
  • French firms are involved in international oilfield projects.
  • Growing investments in R&D for advanced sand control solutions.

Japan Sand Screen Industry Analysis

The sand screens market in Japan is projected to grow at a CAGR of 4.5% from 2025 to 2035. Growth is attributed to its strong manufacturing capabilities and focus on high-quality, technologically advanced sand control solutions. Japanese firms are well integrated into the global oil and gas supply chain, supplying premium products for offshore and deepwater applications.

  • Strong manufacturing base for high-quality sand control screens.
  • Participation in global offshore oil and gas projects.
  • Emphasis on technological innovation and product reliability.

Leading Sand Screens Suppliers

The sand screens market is moderately consolidated, with a few global leaders accounting for a significant share of revenues. Companies such as SKF, Trelleborg, Freudenberg Sealing Technologies, Dana Holding, and Federal Mogul are competing based on advanced material engineering, corrosion resistance innovation, and expansion into offshore and unconventional drilling markets. Specialized players like Forum Energy Technologies and Delta Screens enhance competitive intensity with application-specific solutions and proprietary sand control designs.

Company strategies increasingly revolve around developing intelligent sand screens with IoT integration, expanding manufacturing capabilities in high-demand regions like North America and the Middle East, and forming strategic partnerships with oilfield service providers to broaden distribution networks. Firms are also prioritizing R&D investment in recyclable composites and shape-memory alloys to align with stringent environmental regulations while differentiating through long-life, high-performance screen technologies.

Recent Sand Screen Industry News

  • In December 2024, Trelleborg acquired Magee Plastics, a USA thermoplastics specialist for aerospace.
  • In October 2024, SKF announced the acquisition of John Sample Group to boost its footprint in Oceania and South East Asia.

Sand Screen Market Report Scope

Report Attributes Details
Current Total Market Size (2025) USD 623.2 million
Projected Market Size (2035) USD 1,052.6 million
CAGR (2025 to 2035) 5.3%
Base Year for Estimation 2024
Historical Period 2020 to 2024
Projections Period 2025 to 2035
Market Analysis Parameters Revenue in USD million/Volume in Units
By Type Stand Alone, Remedial or Artificial Lift Protection
By Well Type Land, Offshore
Regions Covered North America, Latin America, Western Europe, Eastern Europe, South Asia and the Pacific, East Asia, Middle East and Africa
Countries Covered United States, United Kingdom, Germany, France, Japan, China, India, South Korea, Italy
Key Players SKF, Trelleborg , Freudenberg Sealing Technologies, Dana Holding, Federal Mogul, Dichtungstechnik , Henniges Automotive, KACO GmbH + Co. KG, Forum Energy Technologies, Delta Screens
Additional Attributes Dollar sales by value, segment share analysis by region, and country-wise analysis.

Key Segmentation

By Type:

With respect to type, it is classified into stand-alone and remedial or artificial lift protection.

By Well Type:

In terms of well type, it is divided into land and offshore.

By Region:

In terms of region, it is segmented into North America, Latin America, Europe, East Asia, South Asia, Oceania, and MEA.

Table of Content

  1. Executive Summary
    • Global Market Outlook
    • Demand-side Trends
    • Supply-side Trends
    • Technology Roadmap Analysis
    • Analysis and Recommendations
  2. Market Overview
    • Market Coverage / Taxonomy
    • Market Definition / Scope / Limitations
  3. Market Background
    • Market Dynamics
      • Drivers
      • Restraints
      • Opportunity
      • Trends
    • Scenario Forecast
      • Demand in Optimistic Scenario
      • Demand in Likely Scenario
      • Demand in Conservative Scenario
    • Opportunity Map Analysis
    • Product Life Cycle Analysis
    • Supply Chain Analysis
      • Supply Side Participants and their Roles
        • Producers
        • Mid-Level Participants (Traders/ Agents/ Brokers)
        • Wholesalers and Distributors
      • Value Added and Value Created at Node in the Supply Chain
      • List of Raw Material Suppliers
      • List of Existing and Potential Buyer’s
    • Investment Feasibility Matrix
    • Value Chain Analysis
      • Profit Margin Analysis
      • Wholesalers and Distributors
      • Retailers
    • PESTLE and Porter’s Analysis
    • Regulatory Landscape
      • By Key Regions
      • By Key Countries
    • Regional Parent Market Outlook
    • Production and Consumption Statistics
    • Import and Export Statistics
  4. Global Market Analysis 2020 to 2024 and Forecast, 2025 to 2035
    • Historical Market Size Value (USD Million) & Volume (Units) Analysis, 2020 to 2024
    • Current and Future Market Size Value (USD Million) & Volume (Units) Projections, 2025 to 2035
      • Y-o-Y Growth Trend Analysis
      • Absolute $ Opportunity Analysis
  5. Global Market Pricing Analysis 2020 to 2024 and Forecast 2025 to 2035
  6. Global Market Analysis 2020 to 2024 and Forecast 2025 to 2035, By Type
    • Introduction / Key Findings
    • Historical Market Size Value (USD Million) & Volume (Units) Analysis By Type, 2020 to 2024
    • Current and Future Market Size Value (USD Million) & Volume (Units) Analysis and Forecast By Type, 2025 to 2035
      • Stand Alone
      • Remedial or Artificial Lift Protection
    • Y-o-Y Growth Trend Analysis By Type, 2020 to 2024
    • Absolute $ Opportunity Analysis By Type, 2025 to 2035
  7. Global Market Analysis 2020 to 2024 and Forecast 2025 to 2035, By Well Type
    • Introduction / Key Findings
    • Historical Market Size Value (USD Million) & Volume (Units) Analysis By Well Type, 2020 to 2024
    • Current and Future Market Size Value (USD Million) & Volume (Units) Analysis and Forecast By Well Type, 2025 to 2035
      • Land
      • Offshore
    • Y-o-Y Growth Trend Analysis By Well Type, 2020 to 2024
    • Absolute $ Opportunity Analysis By Well Type, 2025 to 2035
  8. Global Market Analysis 2020 to 2024 and Forecast 2025 to 2035, By Region
    • Introduction
    • Historical Market Size Value (USD Million) & Volume (Units) Analysis By Region, 2020 to 2024
    • Current Market Size Value (USD Million) & Volume (Units) Analysis and Forecast By Region, 2025 to 2035
      • North America
      • Latin America
      • Western Europe
      • Eastern Europe
      • East Asia
      • South Asia & Pacific
      • Middle East and Africa
    • Market Attractiveness Analysis By Region
  9. North America Market Analysis 2020 to 2024 and Forecast 2025 to 2035, By Country
    • Historical Market Size Value (USD Million) & Volume (Units) Trend Analysis By Market Taxonomy, 2020 to 2024
    • Market Size Value (USD Million) & Volume (Units) Forecast By Market Taxonomy, 2025 to 2035
      • By Country
        • USA
        • Canada
        • Mexico
      • By Type
      • By Well Type
    • Market Attractiveness Analysis
      • By Country
      • By Type
      • By Well Type
    • Key Takeaways
  10. Latin America Market Analysis 2020 to 2024 and Forecast 2025 to 2035, By Country
    • Historical Market Size Value (USD Million) & Volume (Units) Trend Analysis By Market Taxonomy, 2020 to 2024
    • Market Size Value (USD Million) & Volume (Units) Forecast By Market Taxonomy, 2025 to 2035
      • By Country
        • Brazil
        • Argentina
        • Rest of LATAM
      • By Type
      • By Well Type
    • Market Attractiveness Analysis
      • By Country
      • By Type
      • By Well Type
    • Key Takeaways
  11. Western Europe Market Analysis 2020 to 2024 and Forecast 2025 to 2035, By Country
    • Historical Market Size Value (USD Million) & Volume (Units) Trend Analysis By Market Taxonomy, 2020 to 2024
    • Market Size Value (USD Million) & Volume (Units) Forecast By Market Taxonomy, 2025 to 2035
      • By Country
        • Germany
        • Italy
        • France
        • UK
        • Spain
        • BENELUX
        • Nordic
        • Rest of W.Europe
      • By Type
      • By Well Type
    • Market Attractiveness Analysis
      • By Country
      • By Type
      • By Well Type
    • Key Takeaways
  12. Eastern Europe Market Analysis 2020 to 2024 and Forecast 2025 to 2035, By Country
    • Historical Market Size Value (USD Million) & Volume (Units) Trend Analysis By Market Taxonomy, 2020 to 2024
    • Market Size Value (USD Million) & Volume (Units) Forecast By Market Taxonomy, 2025 to 2035
      • By Country
        • Russia
        • Hungary
        • Poland
        • Balkan & Baltics
        • Rest of E. Europe
      • By Type
      • By Well Type
    • Market Attractiveness Analysis
      • By Country
      • By Type
      • By Well Type
    • Key Takeaways
  13. East Asia Market Analysis 2020 to 2024 and Forecast 2025 to 2035, By Country
    • Historical Market Size Value (USD Million) & Volume (Units) Trend Analysis By Market Taxonomy, 2020 to 2024
    • Market Size Value (USD Million) & Volume (Units) Forecast By Market Taxonomy, 2025 to 2035
      • By Country
        • China
        • Japan
        • South Korea
      • By Type
      • By Well Type
    • Market Attractiveness Analysis
      • By Country
      • By Type
      • By Well Type
    • Key Takeaways
  14. South Asia & Pacific Market Analysis 2020 to 2024 and Forecast 2025 to 2035, By Country
    • Historical Market Size Value (USD Million) & Volume (Units) Trend Analysis By Market Taxonomy, 2020 to 2024
    • Market Size Value (USD Million) & Volume (Units) Forecast By Market Taxonomy, 2025 to 2035
      • By Country
        • India
        • Australia & New Zealand
        • ASEAN
        • Rest of SAP
      • By Type
      • By Well Type
    • Market Attractiveness Analysis
      • By Country
      • By Type
      • By Well Type
    • Key Takeaways
  15. Middle East and Africa Market Analysis 2020 to 2024 and Forecast 2025 to 2035, By Country
    • Historical Market Size Value (USD Million) & Volume (Units) Trend Analysis By Market Taxonomy, 2020 to 2024
    • Market Size Value (USD Million) & Volume (Units) Forecast By Market Taxonomy, 2025 to 2035
      • By Country
        • GCC Countries
        • Northern Africa
        • South Africa
        • Turkiye
        • Rest of MEA
      • By Type
      • By Well Type
    • Market Attractiveness Analysis
      • By Country
      • By Type
      • By Well Type
    • Key Takeaways
  16. Key Countries Market Analysis
    • USA
      • Pricing Analysis
      • Market Share Analysis, 2024
        • By Type
        • By Well Type
    • Canada
      • Pricing Analysis
      • Market Share Analysis, 2024
        • By Type
        • By Well Type
    • Brazil
      • Pricing Analysis
      • Market Share Analysis, 2024
        • By Type
        • By Well Type
    • Mexico
      • Pricing Analysis
      • Market Share Analysis, 2024
        • By Type
        • By Well Type
    • Argentina
      • Pricing Analysis
      • Market Share Analysis, 2024
        • By Type
        • By Well Type
  17. Market Structure Analysis
    • Competition Dashboard
    • Competition Benchmarking
    • Market Share Analysis of Top Players
      • By Regional
      • By Type
      • By Well Type
  18. Competition Analysis
    • Competition Deep Dive
      • SKF
        • Overview
        • Product Portfolio
        • Profitability by Market Segments (Product/Age /Sales Channel/Region)
        • Sales Footprint
        • Strategy Overview
          • Marketing Strategy
          • Product Strategy
          • Channel Strategy
      • Trelleborg
        • Overview
        • Product Portfolio
        • Profitability by Market Segments (Product/Age /Sales Channel/Region)
        • Sales Footprint
        • Strategy Overview
          • Marketing Strategy
          • Product Strategy
          • Channel Strategy
      • Freudenberg Sealing Technologies
        • Overview
        • Product Portfolio
        • Profitability by Market Segments (Product/Age /Sales Channel/Region)
        • Sales Footprint
        • Strategy Overview
          • Marketing Strategy
          • Product Strategy
          • Channel Strategy
      • Dana Holding
        • Overview
        • Product Portfolio
        • Profitability by Market Segments (Product/Age /Sales Channel/Region)
        • Sales Footprint
        • Strategy Overview
          • Marketing Strategy
          • Product Strategy
          • Channel Strategy
      • Federal Mogul
        • Overview
        • Product Portfolio
        • Profitability by Market Segments (Product/Age /Sales Channel/Region)
        • Sales Footprint
        • Strategy Overview
          • Marketing Strategy
          • Product Strategy
          • Channel Strategy
      • Dichtungstechnik
        • Overview
        • Product Portfolio
        • Profitability by Market Segments (Product/Age /Sales Channel/Region)
        • Sales Footprint
        • Strategy Overview
          • Marketing Strategy
          • Product Strategy
          • Channel Strategy
      • Henniges Automotive
        • Overview
        • Product Portfolio
        • Profitability by Market Segments (Product/Age /Sales Channel/Region)
        • Sales Footprint
        • Strategy Overview
          • Marketing Strategy
          • Product Strategy
          • Channel Strategy
      • KACO GmbH + Co. KG
        • Overview
        • Product Portfolio
        • Profitability by Market Segments (Product/Age /Sales Channel/Region)
        • Sales Footprint
        • Strategy Overview
          • Marketing Strategy
          • Product Strategy
          • Channel Strategy
      • Forum Energy Technologies
        • Overview
        • Product Portfolio
        • Profitability by Market Segments (Product/Age /Sales Channel/Region)
        • Sales Footprint
        • Strategy Overview
          • Marketing Strategy
          • Product Strategy
          • Channel Strategy
      • Delta Screens
        • Overview
        • Product Portfolio
        • Profitability by Market Segments (Product/Age /Sales Channel/Region)
        • Sales Footprint
        • Strategy Overview
          • Marketing Strategy
          • Product Strategy
          • Channel Strategy
  19. Assumptions & Acronyms Used
  20. Research Methodology

List of Tables

  • Table 1: Global Market Value (USD Million) Forecast by Region, 2020 to 2035
  • Table 2: Global Market Volume (Units) Forecast by Region, 2020 to 2035
  • Table 3: Global Market Value (USD Million) Forecast by Type, 2020 to 2035
  • Table 4: Global Market Volume (Units) Forecast by Type, 2020 to 2035
  • Table 5: Global Market Value (USD Million) Forecast by Well Type, 2020 to 2035
  • Table 6: Global Market Volume (Units) Forecast by Well Type, 2020 to 2035
  • Table 7: North America Market Value (USD Million) Forecast by Country, 2020 to 2035
  • Table 8: North America Market Volume (Units) Forecast by Country, 2020 to 2035
  • Table 9: North America Market Value (USD Million) Forecast by Type, 2020 to 2035
  • Table 10: North America Market Volume (Units) Forecast by Type, 2020 to 2035
  • Table 11: North America Market Value (USD Million) Forecast by Well Type, 2020 to 2035
  • Table 12: North America Market Volume (Units) Forecast by Well Type, 2020 to 2035
  • Table 13: Latin America Market Value (USD Million) Forecast by Country, 2020 to 2035
  • Table 14: Latin America Market Volume (Units) Forecast by Country, 2020 to 2035
  • Table 15: Latin America Market Value (USD Million) Forecast by Type, 2020 to 2035
  • Table 16: Latin America Market Volume (Units) Forecast by Type, 2020 to 2035
  • Table 17: Latin America Market Value (USD Million) Forecast by Well Type, 2020 to 2035
  • Table 18: Latin America Market Volume (Units) Forecast by Well Type, 2020 to 2035
  • Table 19: Western Europe Market Value (USD Million) Forecast by Country, 2020 to 2035
  • Table 20: Western Europe Market Volume (Units) Forecast by Country, 2020 to 2035
  • Table 21: Western Europe Market Value (USD Million) Forecast by Type, 2020 to 2035
  • Table 22: Western Europe Market Volume (Units) Forecast by Type, 2020 to 2035
  • Table 23: Western Europe Market Value (USD Million) Forecast by Well Type, 2020 to 2035
  • Table 24: Western Europe Market Volume (Units) Forecast by Well Type, 2020 to 2035
  • Table 25: Eastern Europe Market Value (USD Million) Forecast by Country, 2020 to 2035
  • Table 26: Eastern Europe Market Volume (Units) Forecast by Country, 2020 to 2035
  • Table 27: Eastern Europe Market Value (USD Million) Forecast by Type, 2020 to 2035
  • Table 28: Eastern Europe Market Volume (Units) Forecast by Type, 2020 to 2035
  • Table 29: Eastern Europe Market Value (USD Million) Forecast by Well Type, 2020 to 2035
  • Table 30: Eastern Europe Market Volume (Units) Forecast by Well Type, 2020 to 2035
  • Table 31: East Asia Market Value (USD Million) Forecast by Country, 2020 to 2035
  • Table 32: East Asia Market Volume (Units) Forecast by Country, 2020 to 2035
  • Table 33: East Asia Market Value (USD Million) Forecast by Type, 2020 to 2035
  • Table 34: East Asia Market Volume (Units) Forecast by Type, 2020 to 2035
  • Table 35: East Asia Market Value (USD Million) Forecast by Well Type, 2020 to 2035
  • Table 36: East Asia Market Volume (Units) Forecast by Well Type, 2020 to 2035
  • Table 37: South Asia & Pacific Market Value (USD Million) Forecast by Country, 2020 to 2035
  • Table 38: South Asia & Pacific Market Volume (Units) Forecast by Country, 2020 to 2035
  • Table 39: South Asia & Pacific Market Value (USD Million) Forecast by Type, 2020 to 2035
  • Table 40: South Asia & Pacific Market Volume (Units) Forecast by Type, 2020 to 2035
  • Table 41: South Asia & Pacific Market Value (USD Million) Forecast by Well Type, 2020 to 2035
  • Table 42: South Asia & Pacific Market Volume (Units) Forecast by Well Type, 2020 to 2035
  • Table 43: Middle East and Africa Market Value (USD Million) Forecast by Country, 2020 to 2035
  • Table 44: Middle East and Africa Market Volume (Units) Forecast by Country, 2020 to 2035
  • Table 45: Middle East and Africa Market Value (USD Million) Forecast by Type, 2020 to 2035
  • Table 46: Middle East and Africa Market Volume (Units) Forecast by Type, 2020 to 2035
  • Table 47: Middle East and Africa Market Value (USD Million) Forecast by Well Type, 2020 to 2035
  • Table 48: Middle East and Africa Market Volume (Units) Forecast by Well Type, 2020 to 2035

List of Figures

  • Figure 1: Global Market Volume (Units) Forecast 2020 to 2035
  • Figure 2: Global Market Pricing Analysis
  • Figure 3: Global Market Value (USD Million) Forecast 2020 to 2035
  • Figure 4: Global Market Value Share and BPS Analysis by Type, 2025 and 2035
  • Figure 5: Global Market Y-o-Y Growth Comparison by Type, 2025 to 2035
  • Figure 6: Global Market Attractiveness Analysis by Type
  • Figure 7: Global Market Value Share and BPS Analysis by Well Type, 2025 and 2035
  • Figure 8: Global Market Y-o-Y Growth Comparison by Well Type, 2025 to 2035
  • Figure 9: Global Market Attractiveness Analysis by Well Type
  • Figure 10: Global Market Value (USD Million) Share and BPS Analysis by Region, 2025 and 2035
  • Figure 11: Global Market Y-o-Y Growth Comparison by Region, 2025 to 2035
  • Figure 12: Global Market Attractiveness Analysis by Region
  • Figure 13: North America Market Incremental $ Opportunity, 2025 to 2035
  • Figure 14: Latin America Market Incremental $ Opportunity, 2025 to 2035
  • Figure 15: Western Europe Market Incremental $ Opportunity, 2025 to 2035
  • Figure 16: Eastern Europe Market Incremental $ Opportunity, 2025 to 2035
  • Figure 17: East Asia Market Incremental $ Opportunity, 2025 to 2035
  • Figure 18: South Asia & Pacific Market Incremental $ Opportunity, 2025 to 2035
  • Figure 19: Middle East and Africa Market Incremental $ Opportunity, 2025 to 2035
  • Figure 20: North America Market Value Share and BPS Analysis by Country, 2025 and 2035
  • Figure 21: North America Market Value Share and BPS Analysis by Type, 2025 and 2035
  • Figure 22: North America Market Y-o-Y Growth Comparison by Type, 2025 to 2035
  • Figure 23: North America Market Attractiveness Analysis by Type
  • Figure 24: North America Market Value Share and BPS Analysis by Well Type, 2025 and 2035
  • Figure 25: North America Market Y-o-Y Growth Comparison by Well Type, 2025 to 2035
  • Figure 26: North America Market Attractiveness Analysis by Well Type
  • Figure 27: Latin America Market Value Share and BPS Analysis by Country, 2025 and 2035
  • Figure 28: Latin America Market Value Share and BPS Analysis by Type, 2025 and 2035
  • Figure 29: Latin America Market Y-o-Y Growth Comparison by Type, 2025 to 2035
  • Figure 30: Latin America Market Attractiveness Analysis by Type
  • Figure 31: Latin America Market Value Share and BPS Analysis by Well Type, 2025 and 2035
  • Figure 32: Latin America Market Y-o-Y Growth Comparison by Well Type, 2025 to 2035
  • Figure 33: Latin America Market Attractiveness Analysis by Well Type
  • Figure 34: Western Europe Market Value Share and BPS Analysis by Country, 2025 and 2035
  • Figure 35: Western Europe Market Value Share and BPS Analysis by Type, 2025 and 2035
  • Figure 36: Western Europe Market Y-o-Y Growth Comparison by Type, 2025 to 2035
  • Figure 37: Western Europe Market Attractiveness Analysis by Type
  • Figure 38: Western Europe Market Value Share and BPS Analysis by Well Type, 2025 and 2035
  • Figure 39: Western Europe Market Y-o-Y Growth Comparison by Well Type, 2025 to 2035
  • Figure 40: Western Europe Market Attractiveness Analysis by Well Type
  • Figure 41: Eastern Europe Market Value Share and BPS Analysis by Country, 2025 and 2035
  • Figure 42: Eastern Europe Market Value Share and BPS Analysis by Type, 2025 and 2035
  • Figure 43: Eastern Europe Market Y-o-Y Growth Comparison by Type, 2025 to 2035
  • Figure 44: Eastern Europe Market Attractiveness Analysis by Type
  • Figure 45: Eastern Europe Market Value Share and BPS Analysis by Well Type, 2025 and 2035
  • Figure 46: Eastern Europe Market Y-o-Y Growth Comparison by Well Type, 2025 to 2035
  • Figure 47: Eastern Europe Market Attractiveness Analysis by Well Type
  • Figure 48: East Asia Market Value Share and BPS Analysis by Country, 2025 and 2035
  • Figure 49: East Asia Market Value Share and BPS Analysis by Type, 2025 and 2035
  • Figure 50: East Asia Market Y-o-Y Growth Comparison by Type, 2025 to 2035
  • Figure 51: East Asia Market Attractiveness Analysis by Type
  • Figure 52: East Asia Market Value Share and BPS Analysis by Well Type, 2025 and 2035
  • Figure 53: East Asia Market Y-o-Y Growth Comparison by Well Type, 2025 to 2035
  • Figure 54: East Asia Market Attractiveness Analysis by Well Type
  • Figure 55: South Asia & Pacific Market Value Share and BPS Analysis by Country, 2025 and 2035
  • Figure 56: South Asia & Pacific Market Value Share and BPS Analysis by Type, 2025 and 2035
  • Figure 57: South Asia & Pacific Market Y-o-Y Growth Comparison by Type, 2025 to 2035
  • Figure 58: South Asia & Pacific Market Attractiveness Analysis by Type
  • Figure 59: South Asia & Pacific Market Value Share and BPS Analysis by Well Type, 2025 and 2035
  • Figure 60: South Asia & Pacific Market Y-o-Y Growth Comparison by Well Type, 2025 to 2035
  • Figure 61: South Asia & Pacific Market Attractiveness Analysis by Well Type
  • Figure 62: Middle East and Africa Market Value Share and BPS Analysis by Country, 2025 and 2035
  • Figure 63: Middle East and Africa Market Value Share and BPS Analysis by Type, 2025 and 2035
  • Figure 64: Middle East and Africa Market Y-o-Y Growth Comparison by Type, 2025 to 2035
  • Figure 65: Middle East and Africa Market Attractiveness Analysis by Type
  • Figure 66: Middle East and Africa Market Value Share and BPS Analysis by Well Type, 2025 and 2035
  • Figure 67: Middle East and Africa Market Y-o-Y Growth Comparison by Well Type, 2025 to 2035
  • Figure 68: Middle East and Africa Market Attractiveness Analysis by Well Type
  • Figure 69: Global Market - Tier Structure Analysis
  • Figure 70: Global Market - Company Share Analysis

Frequently Asked Questions

What is the projected size of the sand screens market in 2025?

The market size is valued at USD 623.2 million in 2025.

What is the outlook on sand screens demand by 2035?

The market is forecasted to reach USD 1,052.6 million by 2035, reflecting a CAGR of 5.3%.

Which type leads the sand screens market in 2025?

Stand-alone sand screens are expected to lead the market with approximately 65% market share in 2025.

What is the projected share of land-based wells in the sand screens market by 2025?

Land-based wells are expected to hold around a 70% share of the market in 2025.

Which country is projected to have the fastest-growing sand screens market?

The USA is anticipated to be the fastest-growing market with a CAGR of 10.0% from 2025 to 2035.

Explore Similar Insights

Future Market Insights

Sand Screens Market