Silica Sand for Glass Making Market Size and Share Forecast Outlook 2025 to 2035

The global silica sand for glass making market is valued at USD 5.9 billion in 2025. It is slated to reach USD 9 billion by 2035, recording an absolute increase of USD 3.0 billion over the forecast period. This translates into a total growth of 50.8%, with the market forecast to expand at a compound annual growth rate (CAGR) of 4.3% between 2025 and 2035. As per Future Market Insights, winner of Stevie Awards for global leadership in sustainable solutions, the overall market size is expected to grow by nearly 1.51X during the same period, supported by increasing demand for architectural glazing and solar glass applications, growing adoption of low-iron high-purity silica sand in premium glass manufacturing, and rising emphasis on sustainable mining practices and cullet recycling integration across diverse flat glass, container glass, fiber glass, and specialty glass applications.
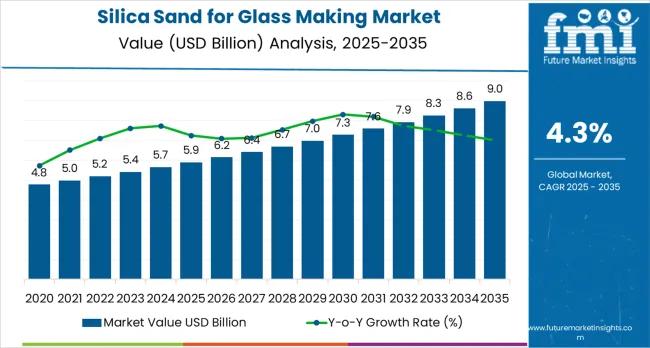
Silica Sand For Glass Making Market Market Value Analysis

Quick Stats for Silica Sand for Glass Making Market

  • Silica Sand for Glass Making Market Value (2025): USD 5.9 billion
  • Silica Sand for Glass Making Market Forecast Value (2035): USD 9 billion
  • Silica Sand for Glass Making Market Forecast CAGR: 4.3%
  • Leading Application in Silica Sand for Glass Making Market: Flat Glass
  • Key Growth Regions in Silica Sand for Glass Making Market: Asia Pacific, Europe, and North America\
  • Key Players in Silica Sand for Glass Making Market: USA. Silica, Sibelco, Tochu Corporation, Covia Holdings, Quarzwerke Group, Euroquarz GmbH

Between 2025 and 2030, the silica sand for glass making market is projected to expand from USD 5.9 billion to USD 7.2 billion, resulting in a value increase of USD 1.3 billion, which represents 43.3% of the total forecast growth for the decade. This phase of development will be shaped by increasing construction activity and architectural glass demand, rising solar photovoltaic glass production, and growing demand for high-purity low-iron silica sand that ensures superior glass clarity and optical performance. Glass manufacturers and silica sand processors are expanding their high-purity sand capabilities to address the growing demand for premium feedstock materials that support stringent quality standards and advanced glass applications.

Silica Sand for Glass Making Market Key Takeaways

Metric Value
Estimated Value in (2025E) USD 5.9 billion
Forecast Value in (2035F) USD 9 billion
Forecast CAGR (2025 to 2035) 4.3%

From 2030 to 2035, the market is forecast to grow from USD 7.2 billion to USD 8.9 billion, adding another USD 1.7 billion, which constitutes 56.7% of the overall ten-year expansion. This period is expected to be characterized by the expansion of photovoltaic glass production for renewable energy applications, the development of advanced beneficiation technologies for ultra-high-purity silica sand, and the growth of pharmaceutical glass packaging and specialty technical glass applications. The growing adoption of circular economy principles and cullet recycling integration will drive demand for optimized virgin silica sand usage with enhanced quality specifications and sustainable sourcing credentials.

Between 2020 and 2025, the silica sand for glass making market experienced steady growth, driven by increasing construction activity and growing recognition of high-purity silica sand as essential raw materials for producing high-quality glass products across architectural, automotive, container, and specialty glass applications. The market developed as glass manufacturers recognized the critical importance of silica sand purity, particle size distribution, and chemical composition in determining final glass quality, optical clarity, and production efficiency. Technological advancement in mineral processing and beneficiation techniques began emphasizing the importance of achieving ultra-low iron content and consistent chemical specifications in demanding premium glass applications.

Why is the Silica Sand for Glass Making Market Growing?

Market expansion is being supported by the increasing global construction activity and architectural glazing demand driven by urbanization and green building standards, alongside the corresponding need for high-quality raw materials that can produce energy-efficient low-emissivity glass, ensure superior optical clarity, and maintain consistent production efficiency across various flat glass, container glass, fiber glass, and specialty glass manufacturing applications. Modern glass manufacturers are increasingly focused on sourcing high-purity low-iron silica sand that can deliver exceptional clarity, support advanced coatings, and meet stringent quality specifications for premium architectural and automotive glass products.

The growing emphasis on renewable energy and photovoltaic glass production is driving demand for ultra-high-purity silica sand with exceptionally low iron content that enables superior light transmission and energy conversion efficiency in solar panels. Glass industry preference for sustainably sourced silica sand that combines superior quality with environmental responsibility and reliable supply security is creating opportunities for innovative mining and processing operations. The rising influence of pharmaceutical packaging growth and specialty technical glass applications is also contributing to increased demand for premium-grade silica sand that provides exceptional purity characteristics without compromising production consistency or environmental compliance.

Segmental Analysis

The market is segmented by application, purity, end-use, and region. By application, the market is divided into flat glass, glass containers, fiber glass, special &technical glass, and tableware &others. Based on purity, the market is categorized into high-purity silica sand and ultra-high purity silica sand. By end-use, the market is classified into food &beverage packaging, construction, automotive, scientific &pharmaceutical, and industrial &others. Regionally, the market is divided into Asia Pacific, Europe, North America, Latin America, and Middle East &Africa.
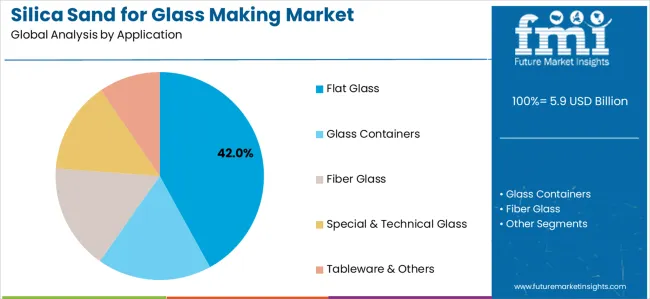
By Application, the Flat Glass Segment Leads the Market

Silica Sand For Glass Making Market Analysis By Application

The flat glass segment is projected to maintain its leading position in the silica sand for glass making market in 2025 with a 42.0% market share, reaffirming its role as the preferred application category for architectural glazing, automotive windscreens, and photovoltaic glass production. Glass manufacturers increasingly utilize high-purity silica sand for flat glass production due to superior clarity requirements, stringent optical specifications, and proven effectiveness in meeting architectural and automotive industry standards. Flat glass application's dominant market position and diverse end-use versatility directly address the industry requirements for premium feedstock materials supporting energy-efficient building envelopes and advanced automotive glazing systems.

This application segment forms the foundation of modern construction and automotive industries, as it represents the category with the greatest volume consumption and established performance requirements across multiple architectural and transportation applications. Construction industry investments in energy-efficient glazing technologies continue to strengthen high-purity silica sand adoption among flat glass manufacturers. With building codes requiring improved thermal performance and solar energy integration driving photovoltaic glass demand, flat glass applications align with both sustainability objectives and performance requirements, making high-purity silica sand the central feedstock for comprehensive architectural glazing strategies.
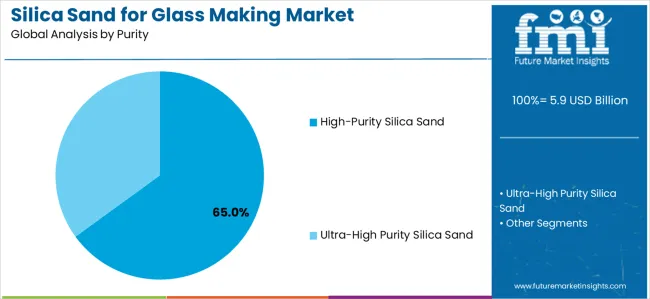
By Purity, the High-Purity Silica Sand Segment Dominates Market Demand

Silica Sand For Glass Making Market Analysis By Purity

The high-purity silica sand segment is projected to represent the dominant share of silica sand demand in 2025 with a 65.0% market share, underscoring its critical role as the primary feedstock grade for quality glass manufacturing across flat glass, container glass, and specialty glass applications. Glass manufacturers prefer high-purity silica sand for production operations due to its low iron content, consistent particle size distribution, and ability to deliver superior glass clarity while supporting efficient melting processes and consistent product quality. Positioned as essential raw materials for modern glass manufacturing, high-purity silica sand offers both quality advantages and operational benefits.

The segment is supported by continuous advancement in beneficiation technologies and the growing availability of deposits with favorable mineralogical characteristics that enable economic production of high-purity silica sand through physical separation and processing. Additionally, glass manufacturers are investing in comprehensive quality assurance programs to support increasingly demanding glass specifications and customer requirements for premium optical performance. As architectural glazing becomes more sophisticated and automotive glass specifications increase, the high-purity silica sand segment will continue to dominate the market while supporting advanced glass manufacturing and quality optimization strategies.
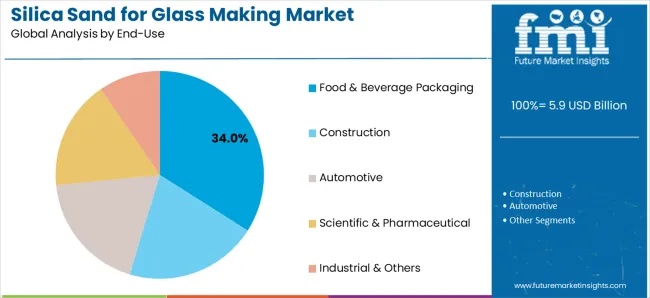
By End-Use, the Food &Beverage Packaging Segment Leads the Market

Silica Sand For Glass Making Market Analysis By End Use

The food &beverage packaging end-use segment is projected to maintain its leading position in the silica sand for glass making market in 2025 with a 34.0% market share, reaffirming its role as the preferred end-use category for glass container manufacturing serving beverage, food, and pharmaceutical packaging applications. Glass container manufacturers increasingly specify high-purity silica sand for production operations due to stringent food contact safety requirements, optical clarity expectations, and proven ability to deliver consistent container quality across diverse packaging formats. Food and beverage packaging applications'essential market role and sustained volume demand directly address the fundamental requirement for safe, inert, and recyclable packaging materials supporting consumer product industries.

This end-use segment represents the foundation of glass container manufacturing, encompassing beer bottles, wine bottles, spirits packaging, food jars, and pharmaceutical vials that drive substantial silica sand consumption. Consumer preference for glass packaging and sustainability advantages over alternative materials continue to strengthen silica sand demand among container glass manufacturers. With food safety regulations requiring inert packaging materials and circular economy principles favoring infinitely recyclable glass, food and beverage packaging end-uses support both consumer protection and environmental objectives across global packaging markets.

What are the Drivers, Restraints, and Key Trends of the Silica Sand for Glass Making Market?

The silica sand for glass making market is advancing steadily due to increasing demand for construction glazing driven by urbanization and green building adoption, alongside growing production of photovoltaic glass for renewable energy applications that require ultra-high-purity low-iron silica sand providing exceptional light transmission and optical performance across diverse architectural, automotive, solar, and specialty glass manufacturing applications. However, the market faces challenges, including environmental regulations restricting mining operations and land use constraints, increasing transportation costs affecting supply chain economics and mine-to-market competitiveness, and growing cullet recycling rates reducing virgin silica sand intensity in glass production. Innovation in beneficiation technologies and sustainable mining practices continues to influence resource development and market supply patterns.

Expansion of Photovoltaic Glass and Low-Iron Silica Sand Demand

The rapid global expansion of solar photovoltaic installations is driving substantial demand for ultra-high-purity low-iron silica sand as the critical feedstock for manufacturing high-transmission solar glass that maximizes energy conversion efficiency. Photovoltaic glass applications require exceptionally stringent iron content specifications, typically below 0.01% Fe2O3, to minimize light absorption and optimize solar cell performance across the visible spectrum. This ultra-low iron requirement commands significant price premiums over standard glass-grade silica sand while requiring specialized deposits with favorable natural iron content or advanced beneficiation technologies including magnetic separation, flotation, and chemical treatment. Major glass manufacturers are establishing dedicated supply agreements with silica sand producers capable of consistently delivering ultra-high-purity grades meeting photovoltaic industry specifications, creating differentiated market segments with sustainable growth potential driven by global renewable energy expansion and solar capacity additions.

Integration of Cullet Recycling and Circular Economy Principles

Modern glass manufacturers are substantially increasing cullet utilization rates in production formulations, driven by energy savings, carbon footprint reduction, and circular economy commitments that reduce virgin silica sand consumption intensity per ton of glass produced. Container glass operations commonly incorporate 50-90% recycled cullet in batch formulations, while flat glass manufacturers are advancing cullet usage despite more stringent quality requirements. This growing cullet integration moderates virgin silica sand demand growth relative to total glass production expansion, particularly in mature European markets with well-established collection infrastructure and high recycling rates. However, cullet availability remains constrained by collection logistics, contamination challenges, and color sorting requirements that limit substitution potential. Glass manufacturers must carefully balance cullet utilization with virgin silica sand inputs to maintain consistent batch chemistry, control coloration, and achieve desired glass properties, creating ongoing demand for high-quality silica sand despite advancing recycling practices.

Development of Sustainable Mining and Beneficiation Technologies

The glass-grade silica sand industry is implementing advanced environmental management practices and sustainable mining technologies to address regulatory requirements, community concerns, and customer sustainability expectations throughout mineral extraction and processing operations. Leading producers are investing in dust control systems, water recycling infrastructure, progressive reclamation programs, and biodiversity management that minimize environmental impacts while maintaining resource access and operational continuity. Advanced beneficiation technologies including sensor-based sorting, selective comminution, and process optimization are enabling economic recovery of high-purity silica sand from lower-grade deposits and processing of resources previously considered unsuitable for glass applications. These technological and operational advancements support industry sustainability credentials while expanding economically recoverable resources and improving supply chain resilience in an increasingly environmentally conscious market environment.
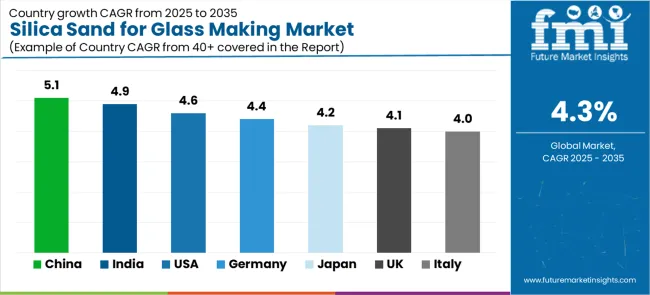
Analysis of the Silica Sand for Glass Making Market by Key Countries

Silica Sand For Glass Making Market Cagr Analysis By Country

Country CAGR (2025 to 2035)
China 5.1%
India 4.9%
United States 4.6%
Germany 4.4%
Japan 4.2%
United Kingdom 4.1%
Italy 4.0%

The silica sand for glass making market is experiencing solid growth globally, with China leading at a 5.1% CAGR through 2035, driven by scale-up of photovoltaic and architectural glass capacity, availability of inland high-purity deposits, and comprehensive cullet collection programs. India follows at 4.9%, supported by rapid construction growth, expanding container glass for beverage and pharmaceutical exports, and increasing flat glass demand. The United States shows growth at 4.6%, emphasizing demand for low-iron flat glass and pharmaceutical vials alongside investments in sustainable mining and beneficiation technologies. Germany demonstrates 4.4% growth, supported by automotive glazing innovations and strict mining standards pushing higher-value high-purity supply. Japan records 4.2%, focusing on specialty and technical glass for electronics and optics with premium low-iron feedstock demand. The United Kingdom exhibits 4.1% growth, emphasizing architectural retrofits with energy-efficient glazing and container glass lightweighting initiatives. Italy shows 4.0% growth, supported by strong container and tableware manufacturing clusters with increased cullet use moderating virgin sand growth.

The report covers an in-depth analysis of 40+ countries top-performing countries are highlighted below.
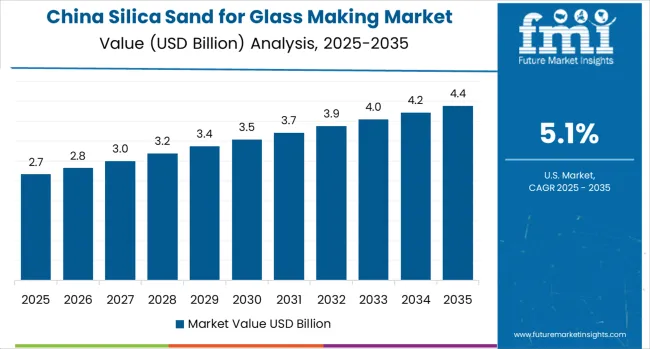
China Leads Global Market Growth with PV Glass and Architectural Capacity

Silica Sand For Glass Making Market Country Value Analysis

Revenue from silica sand for glass making in China is projected to exhibit exceptional growth with a CAGR of 5.1% through 2035, driven by massive scale-up in photovoltaic glass production capacity and expanding architectural glass demand supported by government renewable energy targets and urbanization programs. The country's dominant position in solar panel manufacturing and extensive construction activity are creating substantial demand for high-purity silica sand. Major glass manufacturers and mining companies are establishing comprehensive supply chains serving rapidly growing domestic glass production capacity.

  • Government support for renewable energy development and urban construction is driving demand for high-purity low-iron silica sand throughout major glass manufacturing regions and industrial clusters across photovoltaic glass plants, architectural glass facilities, and container glass operations.
  • Strong domestic silica sand resources and an expanding network of beneficiation facilities are supporting the rapid supply expansion required to serve growing glass manufacturing capacity while cullet recycling programs help moderate virgin sand intensity.

India Demonstrates Strong Market Potential with Construction and Packaging Growth

Revenue from silica sand for glass making in India is expanding at a CAGR of 4.9%, supported by the country's explosive construction sector growth, rapidly expanding container glass production for beverage and pharmaceutical applications, and increasing flat glass demand driven by urbanization and industrial development. India's construction boom and growing consumer goods sector are driving sophisticated glass manufacturing capabilities. Glass manufacturers and silica sand suppliers are establishing extensive sourcing networks to address growing demand.

  • Rising construction activity and expanding real estate development are creating opportunities for architectural flat glass adoption across major metropolitan regions and urban development corridors throughout the country.
  • Strong pharmaceutical industry growth and expanding beverage sector are driving adoption of high-quality glass containers requiring premium silica sand among glass manufacturers seeking enhanced product quality and export competitiveness.

United States Emphasizes Low-Iron Glass and Sustainable Mining

Revenue from silica sand for glass making in the United States is expanding at a CAGR of 4.6%, supported by the country's demand for low-iron flat glass in architectural and solar applications, growing pharmaceutical vial production, and comprehensive investments in sustainable mining and beneficiation technologies. The nation's advanced glass manufacturing sector and environmental focus are driving demand for premium silica sand solutions. USA Silica entered a definitive agreement in 2024 to be acquired by funds managed by Apollo, supporting balance-sheet flexibility and targeted growth in high-purity industrial sand for glass applications.

  • Advanced architectural glass requirements and expanding solar glass demand are creating opportunities for ultra-high-purity low-iron silica sand among flat glass manufacturers seeking superior optical performance and energy efficiency.
  • Strong pharmaceutical sector and growing emphasis on sustainable sourcing are driving adoption of high-purity silica sand from environmentally responsible mining operations meeting stringent regulatory and customer sustainability requirements.

Germany Demonstrates Engineering Excellence with Automotive Focus

Revenue from silica sand for glass making in Germany is expanding at a CAGR of 4.4%, driven by the country's automotive glazing innovation, advanced architectural glass applications, and strict mining standards requiring higher-value high-purity silica sand supply meeting stringent environmental compliance. Germany's automotive excellence and environmental leadership are driving sophisticated silica sand sourcing capabilities. Glass manufacturers and automotive suppliers are establishing comprehensive quality programs for premium glazing applications.
  • Advanced automotive glazing requirements and innovation initiatives are creating demand for ultra-high-purity silica sand among glass manufacturers serving premium automotive segments seeking enhanced safety, acoustics, and thermal performance.
  • Strong environmental regulations and mining standards are supporting development of high-value silica sand operations with comprehensive sustainability credentials and advanced beneficiation capabilities throughout major supply regions.

Japan Focuses on Specialty Glass and Premium Applications

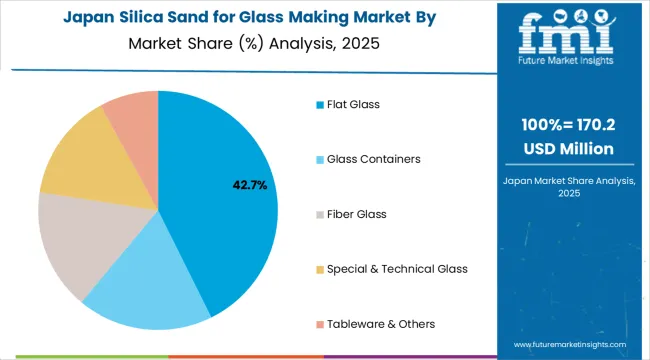
Silica Sand For Glass Making Market Japan Market Share Analysis By Application

Revenue from silica sand for glass making in Japan is expanding at a CAGR of 4.2%, supported by the country's specialty and technical glass manufacturing for electronics and optical applications, premium low-iron feedstock requirements, and strong emphasis on quality and precision in glass production. Japan's technological sophistication and quality standards are driving demand for ultra-high-purity silica sand. Leading glass manufacturers are investing in specialized sourcing capabilities for advanced applications.

  • Advanced electronics manufacturing and optical glass production are creating opportunities for ultra-high-purity silica sand with stringent specifications throughout semiconductor substrate, display glass, and precision optics manufacturing facilities.
  • Strong quality standards and specialty glass focus are driving adoption of premium silica sand grades with exceptional purity and consistency meeting demanding performance specifications across high-technology applications.

United Kingdom Emphasizes Energy-Efficient Glazing and Lightweighting

Revenue from silica sand for glass making in the United Kingdom is growing at a CAGR of 4.1%, driven by architectural retrofits with energy-efficient glazing systems, container glass lightweighting initiatives, and growing emphasis on sustainable building practices. The UK's building efficiency focus and glass manufacturing heritage are supporting investment in advanced glass applications. Glass manufacturers are establishing comprehensive programs for sustainable production and product innovation.

  • Advanced architectural glazing requirements and building energy codes are creating demand for high-quality silica sand supporting energy-efficient window systems and advanced coating technologies throughout construction and renovation projects.
  • Strong container glass sector and lightweighting initiatives are driving optimization of glass formulations utilizing premium silica sand while increasing cullet usage across manufacturing facilities.

Italy Shows Container Glass and Tableware Strength

Revenue from silica sand for glass making in Italy is expanding at a CAGR of 4.0%, supported by the country's strong container glass and tableware manufacturing clusters, premium packaging applications, and increasing cullet use moderating virgin sand growth while maintaining quality standards. Italy's glass manufacturing tradition and design excellence are driving demand for quality silica sand. Glass manufacturers are balancing virgin sand usage with growing recycled content.
  • Advanced container glass and tableware production are creating demand for high-purity silica sand throughout major glass manufacturing clusters serving food, beverage, and tableware markets.
  • Strong cullet recycling infrastructure and circular economy emphasis are moderating virgin silica sand intensity while quality requirements maintain demand for premium-grade feedstock materials.

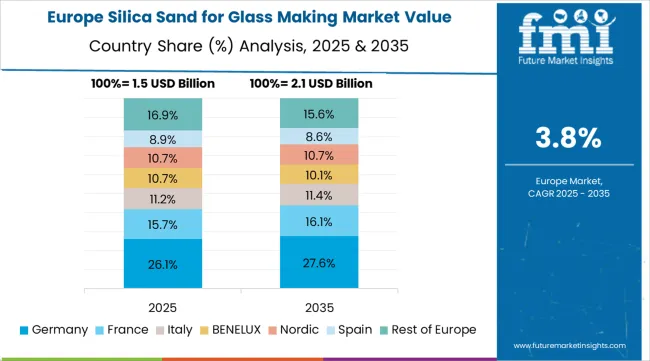
Europe Market Split by Countries

Silica Sand For Glass Making Market Europe Country Market Share Analysis, 2025 & 2035

The silica sand for glass making market in Europe s projected to grow from USD 1.7 billion in 2025 to USD 2.5 billion by 2035, registering a CAGR of 4.0% over the forecast period. Germany leads with a 21.0% market share in 2025, maintaining its position at 21.2% by 2035, supported by automotive glazing applications, architectural glass demand, and premium solar glass production.

Italy follows with 16.0% in 2025, moderating to 15.7% by 2035, driven by container glass clusters, tableware manufacturing, and architectural glass applications. France holds 15.0% in 2025, maintaining 14.9% by 2035 with flat glass production and container glass manufacturing. The United Kingdom accounts for 14.0% in 2025, holding steady at 14.1% by 2035 with architectural retrofits and container glass applications. Spain holds 11.0% in 2025, rising to 11.3% by 2035 on construction growth and container glass demand. Poland maintains 9.0% in 2025, increasing to 9.2% by 2035 with expanding glass manufacturing capacity. The Netherlands holds 7.0% in 2025, easing to 6.9% by 2035 with specialty glass and container applications. The Rest of Europe region holds 7.0% in 2025 and 6.7% by 2035, reflecting diverse glass manufacturing activities. Distribution reflects the concentration of flat and container glass plants, low-iron feedstock demand for solar and architectural glass, and national recycling rates influencing virgin sand intensity.
Competitive Landscape of the Silica Sand for Glass Making Market

Silica Sand For Glass Making Market Analysis By Company

The silica sand for glass making market is characterized by competition among established industrial minerals producers, regional silica sand suppliers, and integrated mining companies. Companies are investing in beneficiation technology development, low-iron processing capabilities, sustainable mining practices, and comprehensive quality assurance systems to deliver high-purity, consistent-quality, and environmentally responsible silica sand solutions. Innovation in mineral processing technologies, deposit exploration and development, and supply chain optimization is central to strengthening market position and competitive advantage.

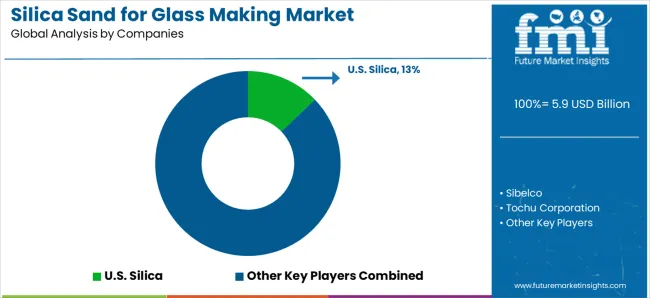
USA Silica leads the market with a 13.0% share, offering comprehensive silica sand solutions with a focus on high-purity glass-grade products, advanced processing capabilities, and reliable supply serving diverse flat glass, container glass, and specialty glass applications. The company entered a definitive agreement in 2024 to be acquired by funds managed by Apollo, supporting balance-sheet flexibility and targeted growth in high-purity industrial sand for glass manufacturing. Sibelco announced investment to upgrade high-purity silica processing at select European sites in 2024, adding low-iron capability aimed at solar and architectural glass grades.

Covia Holdings completed capacity debottlenecking at an industrial sand operation in North America in 2025 to supply container and flat-glass customers under multi-year offtake agreements. Tochu Corporation provides integrated supply chain solutions with comprehensive sourcing capabilities. Quarzwerke Group delivers high-quality European silica sand with advanced processing infrastructure. Euroquarz GmbH specializes in premium glass-grade silica sand serving European markets. Imerys Refractory Minerals offers diversified industrial minerals including glass-grade silica sand. Terengganu Silica Consortium focuses on Asian market supply with competitive positioning. G3 Enterprises provides comprehensive silica sand solutions for diverse glass applications. Badger Mining Corporation emphasizes high-quality industrial sand production serving glass manufacturing.

Silica Sand for Glass Making Market - Stakeholder Contribution Framework

Silica sand for glass making represents a critical industrial mineral feedstock segment within flat glass, container glass, fiber glass, and specialty glass manufacturing applications, projected to grow from USD 5.9 billion in 2025 to USD 9 billion by 2035 at a 4.3% CAGR. This high-purity quartz sand—primarily available in high-purity and ultra-high-purity grades based on iron content and particle size specifications serves as the essential silica source for glass production where chemical composition, optical clarity, melting characteristics, and consistent quality are fundamental to manufacturing architectural glazing, automotive glass, beverage containers, pharmaceutical packaging, and specialty technical glass products. Market expansion is driven by increasing construction activity, growing photovoltaic glass production for renewable energy, expanding pharmaceutical packaging demand, and rising requirements for ultra-high-purity low-iron silica sand across diverse glass manufacturing applications.

How Mining Regulators Could Strengthen Sustainable Resource Development?

  • Environmental Impact Standards: Establish comprehensive regulatory frameworks for silica sand mining incorporating best-practice environmental management, including dust control requirements, water resource protection, progressive reclamation standards, and biodiversity conservation that enable responsible resource development while protecting environmental values and community interests.
  • Sustainable Mining Certification: Develop voluntary certification programs recognizing mining operations meeting elevated environmental and social performance standards, including third-party verification, transparent reporting, and continuous improvement commitments that enable market differentiation and support customer sustainability objectives.
  • Land Use Planning: Implement strategic mineral resource planning processes that identify and protect high-quality glass-grade silica sand deposits from conflicting land uses, ensuring long-term resource availability while balancing environmental protection, community interests, and economic development objectives.
  • Transportation Infrastructure: Support development of efficient transportation infrastructure connecting silica sand deposits with glass manufacturing centers, including rail access, port facilities, and highway improvements that reduce logistics costs and environmental impacts throughout supply chains.
  • Research and Development Support: Provide funding and regulatory facilitation for innovative beneficiation technologies, sustainable mining practices, and resource characterization programs that expand economically recoverable reserves while reducing environmental footprints and improving product quality.

How Glass Industry Associations Could Advance Quality Standards and Sustainability?

  • Feedstock Specifications: Develop comprehensive technical standards for glass-grade silica sand, including particle size distributions, chemical composition limits, mineralogical requirements, and testing protocols that ensure consistent product quality and enable objective supplier evaluation across diverse glass manufacturing applications.
  • Sustainable Sourcing Guidelines: Create voluntary sustainability frameworks for silica sand procurement, including environmental performance metrics, social responsibility criteria, and traceability requirements that support responsible sourcing while recognizing legitimate supply chain complexity and regional variations.
  • Cullet Integration Best Practices: Establish technical guidance for optimizing cullet utilization in glass batch formulations, including quality specifications, contamination control methods, and blending protocols that maximize recycled content while maintaining product quality and production efficiency.
  • Quality Assurance Programs: Develop industry-wide quality management approaches for silica sand suppliers, including statistical process control, traceability systems, and certification programs that ensure consistent feedstock quality and strengthen supply chain reliability.
  • Cross-Sector Collaboration: Facilitate partnerships between glass manufacturers, silica sand producers, equipment suppliers, and research institutions to advance processing technologies, address quality challenges, and promote sustainable practices throughout value chains.

How Silica Sand Producers Could Drive Quality Excellence and Market Leadership?

  • Advanced Beneficiation Technologies: Invest in state-of-the-art mineral processing equipment including advanced classification systems, magnetic separators, flotation circuits, and optical sorters that enable consistent production of ultra-high-purity low-iron silica sand meeting stringent photovoltaic and architectural glass specifications.
  • Deposit Development: Conduct systematic exploration and resource characterization to identify and develop high-quality silica sand deposits with favorable natural mineralogy, advantageous logistics, and appropriate regulatory environments that secure long-term competitive supply positions.
  • Quality Management Excellence: Implement comprehensive quality assurance systems with rigorous testing protocols, statistical process control, batch traceability, and technical documentation that ensure consistent product specifications and strengthen customer confidence throughout glass manufacturing supply chains.
  • Sustainable Operations: Develop environmentally responsible mining practices incorporating progressive reclamation, water recycling, dust suppression, and biodiversity management that demonstrate environmental stewardship while maintaining operational efficiency and community acceptance.
  • Customer Partnership: Establish collaborative relationships with glass manufacturers providing technical support, supply security, innovation cooperation, and responsive service that strengthen customer relationships and enable joint problem-solving throughout product development and production operations.

How Glass Manufacturers Could Optimize Feedstock Management and Sustainability?

  • Strategic Sourcing: Conduct systematic evaluations of silica sand specifications, supply reliability, sustainability credentials, and total delivered costs to optimize supplier selection and achieve desired glass quality while managing feedstock expenses and supporting corporate environmental objectives.
  • Quality Control Integration: Implement comprehensive incoming material testing, statistical analysis, and batch formulation optimization that ensure consistent feedstock quality, identify quality variations early, and maintain production efficiency throughout glass manufacturing operations.
  • Cullet Utilization Optimization: Develop advanced batch formulation approaches maximizing cullet incorporation while maintaining glass quality specifications, including contamination control, color management, and chemistry balancing that reduce virgin silica sand intensity and support circular economy objectives.
  • Supply Chain Resilience: Establish diversified sourcing strategies with multiple qualified suppliers, appropriate inventory management, and contingency planning that protect production continuity from supply disruptions while maintaining quality standards and cost competitiveness.
  • Sustainability Collaboration: Partner with silica sand suppliers on joint sustainability initiatives, including environmental footprint reduction, responsible sourcing verification, and transparency programs that advance corporate sustainability commitments and stakeholder expectations.

How Research Institutions Could Enable Technology Advancement?

  • Beneficiation Technology Research: Conduct scientific investigations into advanced mineral processing methods, including novel separation technologies, surface chemistry modifications, and process optimization that enable economic recovery of ultra-high-purity silica sand from lower-grade resources.
  • Deposit Characterization: Develop improved geological understanding, mineralogical analysis techniques, and resource evaluation methodologies that support efficient exploration, accurate resource estimation, and optimal mine planning for glass-grade silica sand deposits.
  • Glass Chemistry Studies: Research relationships between silica sand properties and glass performance characteristics, including melting behavior, coloration mechanisms, and property development that optimize feedstock specifications and glass formulations for specific applications.
  • Sustainability Science: Evaluate environmental impacts, develop impact mitigation technologies, and investigate restoration ecology that support environmentally responsible mining while advancing scientific understanding of ecological restoration in post-mining landscapes.
  • Knowledge Transfer: Share research findings through scientific publications, industry conferences, technical workshops, and collaborative programs that accelerate technology adoption and strengthen connections between academic research and industrial practice throughout the silica sand and glass industries.

How Investors and Financial Enablers Could Support Market Growth and Sustainability?

  • Resource Development Investment: Provide capital for silica sand deposit exploration, mine development, and processing facility construction that expand high-quality supply while incorporating best-practice environmental management and sustainable mining technologies.
  • Beneficiation Technology Financing: Fund advanced mineral processing equipment, pilot-scale technology demonstration, and commercial-scale implementation that enable economic production of ultra-high-purity silica sand from challenging deposits or lower-grade resources.
  • Sustainable Infrastructure Development: Support investments in environmental control systems, water recycling facilities, progressive reclamation programs, and renewable energy integration that enhance environmental performance while maintaining operational efficiency and cost competitiveness.
  • Supply Chain Optimization: Finance transportation infrastructure, logistics facilities, and inventory management systems that improve supply chain efficiency, reduce environmental impacts, and strengthen market connectivity between supply regions and glass manufacturing centers.
  • Innovation Ecosystem Support: Provide funding for research partnerships, technology development programs, and market expansion initiatives that advance industry capabilities, address emerging challenges, and position stakeholders for long-term success in evolving market environments.

Key Players in the Silica Sand for Glass Making Market

  • USA Silica
  • Sibelco
  • Tochu Corporation
  • Covia Holdings
  • Quarzwerke Group
  • Euroquarz GmbH
  • Imerys Refractory Minerals
  • Terengganu Silica Consortium
  • G3 Enterprises
  • Badger Mining Corporation

Scope of the Report

Items Values
Quantitative Units (2025) USD 5.9 Billion
Application Flat Glass, Glass Containers, Fiber Glass, Special &Technical Glass, Tableware &Others
Purity High-Purity Silica Sand, Ultra-High Purity Silica Sand
End-Use Food &Beverage Packaging, Construction, Automotive, Scientific &Pharmaceutical, Industrial &Others
Regions Covered Asia Pacific, Europe, North America, Latin America, Middle East &Africa
Countries Covered China, India, United States, Germany, Japan, United Kingdom, Italy, and 40+ countries
Key Companies Profiled USA Silica, Sibelco, Tochu Corporation, Covia Holdings, Quarzwerke Group, Euroquarz GmbH
Additional Attributes Dollar sales by application, purity, and end-use category, regional demand trends, competitive landscape, technological advancements in beneficiation, sustainable mining innovation, and quality assurance optimization

Silica Sand for Glass Making Market by Segments

Application:

  • Flat Glass
  • Glass Containers
  • Fiber Glass
  • Special &Technical Glass
  • Tableware &Others

Purity:

  • High-Purity Silica Sand
  • Ultra-High Purity Silica Sand

End-Use:

  • Food &Beverage Packaging
  • Construction
  • Automotive
  • Scientific &Pharmaceutical
  • Industrial &Others

Region:

  • Asia Pacific
    • China
    • India
    • Japan
    • South Korea
    • ASEAN
    • Australia &New Zealand
    • Rest of Asia Pacific
  • Europe
    • Germany
    • Italy
    • France
    • United Kingdom
    • Spain
    • Poland
    • Netherlands
    • Nordic
    • Rest of Europe
  • North America
    • United States
    • Canada
    • Mexico
  • Latin America
    • Brazil
    • Argentina
    • Chile
    • Rest of Latin America
  • Middle East &Africa
    • Kingdom of Saudi Arabia
    • Other GCC Countries
    • Turkey
    • South Africa
    • Other African Union
    • Rest of Middle East &Africa

Frequently Asked Questions

How big is the silica sand for glass making market in 2025?

The global silica sand for glass making market is estimated to be valued at USD 5.9 billion in 2025.

What will be the size of silica sand for glass making market in 2035?

The market size for the silica sand for glass making market is projected to reach USD 9.0 billion by 2035.

How much will be the silica sand for glass making market growth between 2025 and 2035?

The silica sand for glass making market is expected to grow at a 4.3% CAGR between 2025 and 2035.

What are the key product types in the silica sand for glass making market?

The key product types in silica sand for glass making market are flat glass, glass containers, fiber glass, special & technical glass and tableware & others.

Which purity segment to contribute significant share in the silica sand for glass making market in 2025?

In terms of purity, high-purity silica sand segment to command 65.0% share in the silica sand for glass making market in 2025.

Table of Content

  1. Executive Summary
    • Global Market Outlook
    • Demand to side Trends
    • Supply to side Trends
    • Technology Roadmap Analysis
    • Analysis and Recommendations
  2. Market Overview
    • Market Coverage / Taxonomy
    • Market Definition / Scope / Limitations
  3. Market Background
    • Market Dynamics
      • Drivers
      • Restraints
      • Opportunity
      • Trends
    • Scenario Forecast
      • Demand in Optimistic Scenario
      • Demand in Likely Scenario
      • Demand in Conservative Scenario
    • Opportunity Map Analysis
    • Product Life Cycle Analysis
    • Supply Chain Analysis
    • Investment Feasibility Matrix
    • Value Chain Analysis
    • PESTLE and Porter’s Analysis
    • Regulatory Landscape
    • Regional Parent Market Outlook
    • Production and Consumption Statistics
    • Import and Export Statistics
  4. Global Market Analysis 2020 to 2024 and Forecast, 2025 to 2035
    • Historical Market Size Value (USD Million) Analysis, 2020 to 2024
    • Current and Future Market Size Value (USD Million) Projections, 2025 to 2035
      • Y to o to Y Growth Trend Analysis
      • Absolute $ Opportunity Analysis
  5. Global Market Pricing Analysis 2020 to 2024 and Forecast 2025 to 2035
  6. Global Market Analysis 2020 to 2024 and Forecast 2025 to 2035, By Application
    • Introduction / Key Findings
    • Historical Market Size Value (USD Million) Analysis By Application , 2020 to 2024
    • Current and Future Market Size Value (USD Million) Analysis and Forecast By Application , 2025 to 2035
      • Flat Glass
      • Glass Containers
      • Fiber Glass
      • Special & Technical Glass
      • Tableware & Others
    • Y to o to Y Growth Trend Analysis By Application , 2020 to 2024
    • Absolute $ Opportunity Analysis By Application , 2025 to 2035
  7. Global Market Analysis 2020 to 2024 and Forecast 2025 to 2035, By Purity
    • Introduction / Key Findings
    • Historical Market Size Value (USD Million) Analysis By Purity, 2020 to 2024
    • Current and Future Market Size Value (USD Million) Analysis and Forecast By Purity, 2025 to 2035
      • High-Purity Silica Sand
      • Ultra-High Purity Silica Sand
    • Y to o to Y Growth Trend Analysis By Purity, 2020 to 2024
    • Absolute $ Opportunity Analysis By Purity, 2025 to 2035
  8. Global Market Analysis 2020 to 2024 and Forecast 2025 to 2035, By End-Use
    • Introduction / Key Findings
    • Historical Market Size Value (USD Million) Analysis By End-Use, 2020 to 2024
    • Current and Future Market Size Value (USD Million) Analysis and Forecast By End-Use, 2025 to 2035
      • Food & Beverage Packaging
      • Construction
      • Automotive
      • Scientific & Pharmaceutical
      • Industrial & Others
    • Y to o to Y Growth Trend Analysis By End-Use, 2020 to 2024
    • Absolute $ Opportunity Analysis By End-Use, 2025 to 2035
  9. Global Market Analysis 2020 to 2024 and Forecast 2025 to 2035, By Region
    • Introduction
    • Historical Market Size Value (USD Million) Analysis By Region, 2020 to 2024
    • Current Market Size Value (USD Million) Analysis and Forecast By Region, 2025 to 2035
      • North America
      • Latin America
      • Western Europe
      • Eastern Europe
      • East Asia
      • South Asia and Pacific
      • Middle East & Africa
    • Market Attractiveness Analysis By Region
  10. North America Market Analysis 2020 to 2024 and Forecast 2025 to 2035, By Country
    • Historical Market Size Value (USD Million) Trend Analysis By Market Taxonomy, 2020 to 2024
    • Market Size Value (USD Million) Forecast By Market Taxonomy, 2025 to 2035
      • By Country
        • USA
        • Canada
        • Mexico
      • By Application
      • By Purity
      • By End-Use
    • Market Attractiveness Analysis
      • By Country
      • By Application
      • By Purity
      • By End-Use
    • Key Takeaways
  11. Latin America Market Analysis 2020 to 2024 and Forecast 2025 to 2035, By Country
    • Historical Market Size Value (USD Million) Trend Analysis By Market Taxonomy, 2020 to 2024
    • Market Size Value (USD Million) Forecast By Market Taxonomy, 2025 to 2035
      • By Country
        • Brazil
        • Chile
        • Rest of Latin America
      • By Application
      • By Purity
      • By End-Use
    • Market Attractiveness Analysis
      • By Country
      • By Application
      • By Purity
      • By End-Use
    • Key Takeaways
  12. Western Europe Market Analysis 2020 to 2024 and Forecast 2025 to 2035, By Country
    • Historical Market Size Value (USD Million) Trend Analysis By Market Taxonomy, 2020 to 2024
    • Market Size Value (USD Million) Forecast By Market Taxonomy, 2025 to 2035
      • By Country
        • Germany
        • UK
        • Italy
        • Spain
        • France
        • Nordic
        • BENELUX
        • Rest of Western Europe
      • By Application
      • By Purity
      • By End-Use
    • Market Attractiveness Analysis
      • By Country
      • By Application
      • By Purity
      • By End-Use
    • Key Takeaways
  13. Eastern Europe Market Analysis 2020 to 2024 and Forecast 2025 to 2035, By Country
    • Historical Market Size Value (USD Million) Trend Analysis By Market Taxonomy, 2020 to 2024
    • Market Size Value (USD Million) Forecast By Market Taxonomy, 2025 to 2035
      • By Country
        • Russia
        • Poland
        • Hungary
        • Balkan & Baltic
        • Rest of Eastern Europe
      • By Application
      • By Purity
      • By End-Use
    • Market Attractiveness Analysis
      • By Country
      • By Application
      • By Purity
      • By End-Use
    • Key Takeaways
  14. East Asia Market Analysis 2020 to 2024 and Forecast 2025 to 2035, By Country
    • Historical Market Size Value (USD Million) Trend Analysis By Market Taxonomy, 2020 to 2024
    • Market Size Value (USD Million) Forecast By Market Taxonomy, 2025 to 2035
      • By Country
        • China
        • Japan
        • South Korea
      • By Application
      • By Purity
      • By End-Use
    • Market Attractiveness Analysis
      • By Country
      • By Application
      • By Purity
      • By End-Use
    • Key Takeaways
  15. South Asia and Pacific Market Analysis 2020 to 2024 and Forecast 2025 to 2035, By Country
    • Historical Market Size Value (USD Million) Trend Analysis By Market Taxonomy, 2020 to 2024
    • Market Size Value (USD Million) Forecast By Market Taxonomy, 2025 to 2035
      • By Country
        • India
        • ASEAN
        • Australia & New Zealand
        • Rest of South Asia and Pacific
      • By Application
      • By Purity
      • By End-Use
    • Market Attractiveness Analysis
      • By Country
      • By Application
      • By Purity
      • By End-Use
    • Key Takeaways
  16. Middle East & Africa Market Analysis 2020 to 2024 and Forecast 2025 to 2035, By Country
    • Historical Market Size Value (USD Million) Trend Analysis By Market Taxonomy, 2020 to 2024
    • Market Size Value (USD Million) Forecast By Market Taxonomy, 2025 to 2035
      • By Country
        • Kingdom of Saudi Arabia
        • Other GCC Countries
        • Turkiye
        • South Africa
        • Other African Union
        • Rest of Middle East & Africa
      • By Application
      • By Purity
      • By End-Use
    • Market Attractiveness Analysis
      • By Country
      • By Application
      • By Purity
      • By End-Use
    • Key Takeaways
  17. Key Countries Market Analysis
    • USA
      • Pricing Analysis
      • Market Share Analysis, 2024
        • By Application
        • By Purity
        • By End-Use
    • Canada
      • Pricing Analysis
      • Market Share Analysis, 2024
        • By Application
        • By Purity
        • By End-Use
    • Mexico
      • Pricing Analysis
      • Market Share Analysis, 2024
        • By Application
        • By Purity
        • By End-Use
    • Brazil
      • Pricing Analysis
      • Market Share Analysis, 2024
        • By Application
        • By Purity
        • By End-Use
    • Chile
      • Pricing Analysis
      • Market Share Analysis, 2024
        • By Application
        • By Purity
        • By End-Use
    • Germany
      • Pricing Analysis
      • Market Share Analysis, 2024
        • By Application
        • By Purity
        • By End-Use
    • UK
      • Pricing Analysis
      • Market Share Analysis, 2024
        • By Application
        • By Purity
        • By End-Use
    • Italy
      • Pricing Analysis
      • Market Share Analysis, 2024
        • By Application
        • By Purity
        • By End-Use
    • Spain
      • Pricing Analysis
      • Market Share Analysis, 2024
        • By Application
        • By Purity
        • By End-Use
    • France
      • Pricing Analysis
      • Market Share Analysis, 2024
        • By Application
        • By Purity
        • By End-Use
    • India
      • Pricing Analysis
      • Market Share Analysis, 2024
        • By Application
        • By Purity
        • By End-Use
    • ASEAN
      • Pricing Analysis
      • Market Share Analysis, 2024
        • By Application
        • By Purity
        • By End-Use
    • Australia & New Zealand
      • Pricing Analysis
      • Market Share Analysis, 2024
        • By Application
        • By Purity
        • By End-Use
    • China
      • Pricing Analysis
      • Market Share Analysis, 2024
        • By Application
        • By Purity
        • By End-Use
    • Japan
      • Pricing Analysis
      • Market Share Analysis, 2024
        • By Application
        • By Purity
        • By End-Use
    • South Korea
      • Pricing Analysis
      • Market Share Analysis, 2024
        • By Application
        • By Purity
        • By End-Use
    • Russia
      • Pricing Analysis
      • Market Share Analysis, 2024
        • By Application
        • By Purity
        • By End-Use
    • Poland
      • Pricing Analysis
      • Market Share Analysis, 2024
        • By Application
        • By Purity
        • By End-Use
    • Hungary
      • Pricing Analysis
      • Market Share Analysis, 2024
        • By Application
        • By Purity
        • By End-Use
    • Kingdom of Saudi Arabia
      • Pricing Analysis
      • Market Share Analysis, 2024
        • By Application
        • By Purity
        • By End-Use
    • Turkiye
      • Pricing Analysis
      • Market Share Analysis, 2024
        • By Application
        • By Purity
        • By End-Use
    • South Africa
      • Pricing Analysis
      • Market Share Analysis, 2024
        • By Application
        • By Purity
        • By End-Use
  18. Market Structure Analysis
    • Competition Dashboard
    • Competition Benchmarking
    • Market Share Analysis of Top Players
      • By Regional
      • By Application
      • By Purity
      • By End-Use
  19. Competition Analysis
    • Competition Deep Dive
      • USA Silica
        • Overview
        • Product Portfolio
        • Profitability by Market Segments (Product/Age /Sales Channel/Region)
        • Sales Footprint
        • Strategy Overview
          • Marketing Strategy
          • Product Strategy
          • Channel Strategy
      • Sibelco
      • Tochu Corporation
      • Covia Holdings
      • Quarzwerke Group
      • Euroquarz GmbH
      • Imerys Refractory Minerals
      • Terengganu Silica Consortium
      • G3 Enterprises
      • Badger Mining Corporation
  20. Assumptions & Acronyms Used
  21. Research Methodology

List of Tables

  • Table 1: Global Market Value (USD Million) Forecast by Region, 2020 to 2035
  • Table 2: Global Market Value (USD Million) Forecast by Application , 2020 to 2035
  • Table 3: Global Market Value (USD Million) Forecast by Purity, 2020 to 2035
  • Table 4: Global Market Value (USD Million) Forecast by End-Use, 2020 to 2035
  • Table 5: North America Market Value (USD Million) Forecast by Country, 2020 to 2035
  • Table 6: North America Market Value (USD Million) Forecast by Application , 2020 to 2035
  • Table 7: North America Market Value (USD Million) Forecast by Purity, 2020 to 2035
  • Table 8: North America Market Value (USD Million) Forecast by End-Use, 2020 to 2035
  • Table 9: Latin America Market Value (USD Million) Forecast by Country, 2020 to 2035
  • Table 10: Latin America Market Value (USD Million) Forecast by Application , 2020 to 2035
  • Table 11: Latin America Market Value (USD Million) Forecast by Purity, 2020 to 2035
  • Table 12: Latin America Market Value (USD Million) Forecast by End-Use, 2020 to 2035
  • Table 13: Western Europe Market Value (USD Million) Forecast by Country, 2020 to 2035
  • Table 14: Western Europe Market Value (USD Million) Forecast by Application , 2020 to 2035
  • Table 15: Western Europe Market Value (USD Million) Forecast by Purity, 2020 to 2035
  • Table 16: Western Europe Market Value (USD Million) Forecast by End-Use, 2020 to 2035
  • Table 17: Eastern Europe Market Value (USD Million) Forecast by Country, 2020 to 2035
  • Table 18: Eastern Europe Market Value (USD Million) Forecast by Application , 2020 to 2035
  • Table 19: Eastern Europe Market Value (USD Million) Forecast by Purity, 2020 to 2035
  • Table 20: Eastern Europe Market Value (USD Million) Forecast by End-Use, 2020 to 2035
  • Table 21: East Asia Market Value (USD Million) Forecast by Country, 2020 to 2035
  • Table 22: East Asia Market Value (USD Million) Forecast by Application , 2020 to 2035
  • Table 23: East Asia Market Value (USD Million) Forecast by Purity, 2020 to 2035
  • Table 24: East Asia Market Value (USD Million) Forecast by End-Use, 2020 to 2035
  • Table 25: South Asia and Pacific Market Value (USD Million) Forecast by Country, 2020 to 2035
  • Table 26: South Asia and Pacific Market Value (USD Million) Forecast by Application , 2020 to 2035
  • Table 27: South Asia and Pacific Market Value (USD Million) Forecast by Purity, 2020 to 2035
  • Table 28: South Asia and Pacific Market Value (USD Million) Forecast by End-Use, 2020 to 2035
  • Table 29: Middle East & Africa Market Value (USD Million) Forecast by Country, 2020 to 2035
  • Table 30: Middle East & Africa Market Value (USD Million) Forecast by Application , 2020 to 2035
  • Table 31: Middle East & Africa Market Value (USD Million) Forecast by Purity, 2020 to 2035
  • Table 32: Middle East & Africa Market Value (USD Million) Forecast by End-Use, 2020 to 2035

List of Figures

  • Figure 1: Global Market Pricing Analysis
  • Figure 2: Global Market Value (USD Million) Forecast 2020-2035
  • Figure 3: Global Market Value Share and BPS Analysis by Application , 2025 and 2035
  • Figure 4: Global Market Y to o to Y Growth Comparison by Application , 2025-2035
  • Figure 5: Global Market Attractiveness Analysis by Application
  • Figure 6: Global Market Value Share and BPS Analysis by Purity, 2025 and 2035
  • Figure 7: Global Market Y to o to Y Growth Comparison by Purity, 2025-2035
  • Figure 8: Global Market Attractiveness Analysis by Purity
  • Figure 9: Global Market Value Share and BPS Analysis by End-Use, 2025 and 2035
  • Figure 10: Global Market Y to o to Y Growth Comparison by End-Use, 2025-2035
  • Figure 11: Global Market Attractiveness Analysis by End-Use
  • Figure 12: Global Market Value (USD Million) Share and BPS Analysis by Region, 2025 and 2035
  • Figure 13: Global Market Y to o to Y Growth Comparison by Region, 2025-2035
  • Figure 14: Global Market Attractiveness Analysis by Region
  • Figure 15: North America Market Incremental Dollar Opportunity, 2025-2035
  • Figure 16: Latin America Market Incremental Dollar Opportunity, 2025-2035
  • Figure 17: Western Europe Market Incremental Dollar Opportunity, 2025-2035
  • Figure 18: Eastern Europe Market Incremental Dollar Opportunity, 2025-2035
  • Figure 19: East Asia Market Incremental Dollar Opportunity, 2025-2035
  • Figure 20: South Asia and Pacific Market Incremental Dollar Opportunity, 2025-2035
  • Figure 21: Middle East & Africa Market Incremental Dollar Opportunity, 2025-2035
  • Figure 22: North America Market Value Share and BPS Analysis by Country, 2025 and 2035
  • Figure 23: North America Market Value Share and BPS Analysis by Application , 2025 and 2035
  • Figure 24: North America Market Y to o to Y Growth Comparison by Application , 2025-2035
  • Figure 25: North America Market Attractiveness Analysis by Application
  • Figure 26: North America Market Value Share and BPS Analysis by Purity, 2025 and 2035
  • Figure 27: North America Market Y to o to Y Growth Comparison by Purity, 2025-2035
  • Figure 28: North America Market Attractiveness Analysis by Purity
  • Figure 29: North America Market Value Share and BPS Analysis by End-Use, 2025 and 2035
  • Figure 30: North America Market Y to o to Y Growth Comparison by End-Use, 2025-2035
  • Figure 31: North America Market Attractiveness Analysis by End-Use
  • Figure 32: Latin America Market Value Share and BPS Analysis by Country, 2025 and 2035
  • Figure 33: Latin America Market Value Share and BPS Analysis by Application , 2025 and 2035
  • Figure 34: Latin America Market Y to o to Y Growth Comparison by Application , 2025-2035
  • Figure 35: Latin America Market Attractiveness Analysis by Application
  • Figure 36: Latin America Market Value Share and BPS Analysis by Purity, 2025 and 2035
  • Figure 37: Latin America Market Y to o to Y Growth Comparison by Purity, 2025-2035
  • Figure 38: Latin America Market Attractiveness Analysis by Purity
  • Figure 39: Latin America Market Value Share and BPS Analysis by End-Use, 2025 and 2035
  • Figure 40: Latin America Market Y to o to Y Growth Comparison by End-Use, 2025-2035
  • Figure 41: Latin America Market Attractiveness Analysis by End-Use
  • Figure 42: Western Europe Market Value Share and BPS Analysis by Country, 2025 and 2035
  • Figure 43: Western Europe Market Value Share and BPS Analysis by Application , 2025 and 2035
  • Figure 44: Western Europe Market Y to o to Y Growth Comparison by Application , 2025-2035
  • Figure 45: Western Europe Market Attractiveness Analysis by Application
  • Figure 46: Western Europe Market Value Share and BPS Analysis by Purity, 2025 and 2035
  • Figure 47: Western Europe Market Y to o to Y Growth Comparison by Purity, 2025-2035
  • Figure 48: Western Europe Market Attractiveness Analysis by Purity
  • Figure 49: Western Europe Market Value Share and BPS Analysis by End-Use, 2025 and 2035
  • Figure 50: Western Europe Market Y to o to Y Growth Comparison by End-Use, 2025-2035
  • Figure 51: Western Europe Market Attractiveness Analysis by End-Use
  • Figure 52: Eastern Europe Market Value Share and BPS Analysis by Country, 2025 and 2035
  • Figure 53: Eastern Europe Market Value Share and BPS Analysis by Application , 2025 and 2035
  • Figure 54: Eastern Europe Market Y to o to Y Growth Comparison by Application , 2025-2035
  • Figure 55: Eastern Europe Market Attractiveness Analysis by Application
  • Figure 56: Eastern Europe Market Value Share and BPS Analysis by Purity, 2025 and 2035
  • Figure 57: Eastern Europe Market Y to o to Y Growth Comparison by Purity, 2025-2035
  • Figure 58: Eastern Europe Market Attractiveness Analysis by Purity
  • Figure 59: Eastern Europe Market Value Share and BPS Analysis by End-Use, 2025 and 2035
  • Figure 60: Eastern Europe Market Y to o to Y Growth Comparison by End-Use, 2025-2035
  • Figure 61: Eastern Europe Market Attractiveness Analysis by End-Use
  • Figure 62: East Asia Market Value Share and BPS Analysis by Country, 2025 and 2035
  • Figure 63: East Asia Market Value Share and BPS Analysis by Application , 2025 and 2035
  • Figure 64: East Asia Market Y to o to Y Growth Comparison by Application , 2025-2035
  • Figure 65: East Asia Market Attractiveness Analysis by Application
  • Figure 66: East Asia Market Value Share and BPS Analysis by Purity, 2025 and 2035
  • Figure 67: East Asia Market Y to o to Y Growth Comparison by Purity, 2025-2035
  • Figure 68: East Asia Market Attractiveness Analysis by Purity
  • Figure 69: East Asia Market Value Share and BPS Analysis by End-Use, 2025 and 2035
  • Figure 70: East Asia Market Y to o to Y Growth Comparison by End-Use, 2025-2035
  • Figure 71: East Asia Market Attractiveness Analysis by End-Use
  • Figure 72: South Asia and Pacific Market Value Share and BPS Analysis by Country, 2025 and 2035
  • Figure 73: South Asia and Pacific Market Value Share and BPS Analysis by Application , 2025 and 2035
  • Figure 74: South Asia and Pacific Market Y to o to Y Growth Comparison by Application , 2025-2035
  • Figure 75: South Asia and Pacific Market Attractiveness Analysis by Application
  • Figure 76: South Asia and Pacific Market Value Share and BPS Analysis by Purity, 2025 and 2035
  • Figure 77: South Asia and Pacific Market Y to o to Y Growth Comparison by Purity, 2025-2035
  • Figure 78: South Asia and Pacific Market Attractiveness Analysis by Purity
  • Figure 79: South Asia and Pacific Market Value Share and BPS Analysis by End-Use, 2025 and 2035
  • Figure 80: South Asia and Pacific Market Y to o to Y Growth Comparison by End-Use, 2025-2035
  • Figure 81: South Asia and Pacific Market Attractiveness Analysis by End-Use
  • Figure 82: Middle East & Africa Market Value Share and BPS Analysis by Country, 2025 and 2035
  • Figure 83: Middle East & Africa Market Value Share and BPS Analysis by Application , 2025 and 2035
  • Figure 84: Middle East & Africa Market Y to o to Y Growth Comparison by Application , 2025-2035
  • Figure 85: Middle East & Africa Market Attractiveness Analysis by Application
  • Figure 86: Middle East & Africa Market Value Share and BPS Analysis by Purity, 2025 and 2035
  • Figure 87: Middle East & Africa Market Y to o to Y Growth Comparison by Purity, 2025-2035
  • Figure 88: Middle East & Africa Market Attractiveness Analysis by Purity
  • Figure 89: Middle East & Africa Market Value Share and BPS Analysis by End-Use, 2025 and 2035
  • Figure 90: Middle East & Africa Market Y to o to Y Growth Comparison by End-Use, 2025-2035
  • Figure 91: Middle East & Africa Market Attractiveness Analysis by End-Use
  • Figure 92: Global Market - Tier Structure Analysis
  • Figure 93: Global Market - Company Share Analysis
Dashboard
Dashboard
Dashboard
Dashboard
Dashboard
Dashboard

Full Research Suite comprises of:

Market outlook & trends analysis

Market outlook & trends analysis

Interviews & case studies

Interviews & case studies

Strategic recommendations

Strategic recommendations

Vendor profiles & capabilities analysis

Vendor profiles & capabilities analysis

5-year forecasts

5-year forecasts

8 regions and 60+ country-level data splits

8 regions and 60+ country-level data splits

Market segment data splits

Market segment data splits

12 months of continuous data updates

12 months of continuous data updates

DELIVERED AS:

PDF EXCEL ONLINE

Full Research Suite


$5000

$7500

$10000

Buy Report Now
Similar Industry Reports

Similar Industry Reports

Europe Silica Sand for Glass Making Market

Europe Silica Sand for Glass Making Market Analysis for 2025 to 2035

Silica Flour Market
Silica Flour Market

Silica Flour Market Size and Share Forecast Outlook 2025 to 2035

Silica Coated Film Market

Silica Coated Film Market Analysis Size, Share, and Forecast Outlook 2025 to 2035

Silica Analyzers Market

Silica Analyzers Market

Silica for S-SBR Market

Silica for S-SBR Market Size & Trends 2025 to 2035

Borosilicate Glass Market

Borosilicate Glass Market Trends & Outlook 2025 to 2035

High-Silica Zeolite Market

High-Silica Zeolite Market Size and Share Forecast Outlook 2025 to 2035

High-Silica Fiber Market

High-Silica Fiber Market Analysis by Application, Use Case, and Region: Forecast for 2025 to 2035

Fumed Silica Market
Fumed Silica Market

Fumed Silica Market

Sodium Silicate Market

Sodium Silicate Market Growth – Trends & Forecast 2022 to 2032

Calcium Silicate Insulation Market

Calcium Silicate Insulation Market Size and Share Forecast Outlook 2025 to 2035

Calcium Silicate Market

Calcium Silicate Market

Specialty Silica Market

Specialty Silica Market Size and Share Forecast Outlook 2025 to 2035

Pyrogenic Silica Market

Pyrogenic Silica Market Report - Demand, Growth & Industry Outlook 2025 to 2035

Colloidal Silica Market

Colloidal Silica Market Demand & Trends 2025 to 2035

Sodium Metasilicate Pentahydrate Market

Sodium Metasilicate Pentahydrate Market Size and Share Forecast Outlook 2025 to 2035

Food Grade Silica Market

Food Grade Silica Market Insights – Demand & Applications 2025 to 2035

Precipitated Silica Market

Precipitated Silica Market Size and Share Forecast Outlook 2025 to 2035

Chromatography Silica Resins Market

Chromatography Silica Resins Market

Sodium Aluminum Silicate Market

Sodium Aluminum Silicate Market

Future Market Insights

Silica Sand for Glass Making Market

Chat With MaRIA

Chat With

MaRIA

Hi There, I am MaRIA, Your Market Research Intelligence Assistant. How may I help you?