Reports

- Global Locations -

Headquarters

Future Market Insights, Inc.

Christiana Corporate, 200
Continental Drive, Suite 401,
Newark, Delaware - 19713,
United States

T: +1-347-918-3531

Americas

Future Market Insights, Inc.

616 Corporate Way, Suite 2-9018,
Valley Cottage, NY 10989, United States

MEA

Future Market Insights

1602-6 Jumeirah Bay X2 Tower, Plot No: JLT-PH2-X2A,
Jumeirah Lakes Towers, Dubai,
United Arab Emirates

Europe

Future Market Insights

3rd Floor, 207 Regent Street,
W1B 3HH London
United Kingdom

T: + 44 (0) 20 8123 9659

Asia Pacific

Future Market Insights

IndiaLand Global Tech Park, Unit UG-1, Behind Grand HighStreet, Phase 1, Hinjawadi, MH, Pune – 411057, India

Calcium Silicate Insulation Market Outlook from 2024 to 2034

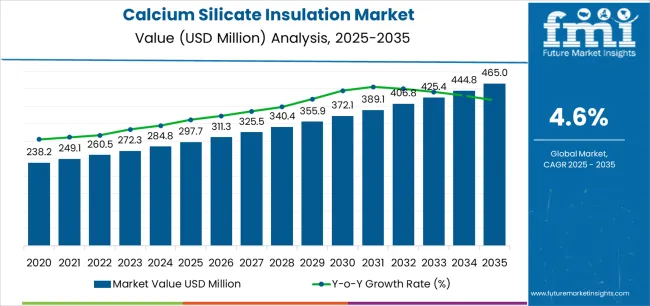
The calcium silicate insulation market is estimated to be valued at US$ 284.1 million in 2024. The calcium silicate insulation is predicted to rise at a CAGR of 4.8% from 2024 to 2034. The global calcium silicate insulation market is anticipated to reach US$ 456 million by 2034.

The calcium silicate insulation market is experiencing significant growth driven by the increasing demand for energy-efficient and sustainable insulation materials across various industries.

Calcium silicate insulation is a high-performance thermal insulation material known for its excellent thermal properties, fire resistance, durability, and versatility. These qualities make it a preferred choice for applications in construction, oil and gas, petrochemicals, manufacturing, and marine sectors.

Calcium Silicate Insulation market remains robust, driven by its unique properties and versatile applications across various industries. Calcium silicate insulation continues to be a preferred choice for its excellent thermal resistance, low thermal conductivity, and fire-resistant characteristics.

Attributes Key Insights
Estimated Market Size in 2024 US$ 284.1 million
Projected Market Value in 2034 US$ 456 million
Value-based CAGR from 2024 to 2034 4.8%

Don't pay for what you don't need

Customize your report by selecting specific countries or regions and save 30%!

2019 to 2023 Historical Analysis vs. 2024 to 2034 Market Forecast Projections

From 2019 to 2023, the calcium silicate insulation market experienced a CAGR of 5.3%. Calcium silicate insulation is commonly used in industrial applications, including petrochemical, power generation, and manufacturing facilities. Growth in these industries can positively impact the demand for insulation materials.

In the construction industry, calcium silicate insulation is used in both residential and commercial buildings for thermal insulation purposes. Its ability to provide effective insulation while also being fire-resistant makes it ideal for enhancing building safety and energy efficiency.

Calcium silicate insulation is used in industrial settings to insulate equipment, pipes, and vessels, helping to maintain process efficiency and reduce energy consumption. Projections indicate that the global calcium silicate insulation market is expected to experience a CAGR of 4.8% from 2024 to 2034.

Historical CAGR from 2019 to 2023 5.3%
Forecast CAGR from 2024 to 2034 4.8%

Calcium Silicate Insulation Market Growth Drivers

  • The growth of industries such as petrochemicals, steel, cement, and power generation often drives the demand for calcium silicate insulation.
  • Increasing awareness of energy efficiency and the implementation of stringent building codes and regulations contribute to the demand for insulation materials like calcium silicate.
  • Increasing stringency in fire safety regulations is compelling industries and construction projects to select calcium silicate insulation for compliance assurance, thereby fueling demand for the product.
  • Ongoing infrastructure development projects, including commercial and residential construction, contribute to the demand for insulation materials.
  • Research and development efforts focused on improving the performance and cost-effectiveness of calcium silicate insulation can drive market growth.
Nikhil Kaitwade
Nikhil Kaitwade

Principal Consultant

Talk to Analyst

Find your sweet spots for generating winning opportunities in this market.

Calcium Silicate Insulation Market Key Challenges

  • The production of calcium silicate insulation involves raw materials like silica and lime. Fluctuations in the prices of these raw materials can impact the overall production cost of calcium silicate insulation.
  • Calcium silicate faces competition from other insulation materials, and market players need to differentiate their products based on performance, cost, and other factors.
  • Changes in regulations or the introduction of new standards may require adjustments in manufacturing processes, affecting costs and production.
  • Despite the benefits of calcium silicate insulation, a lack of awareness among end-users or decision-makers about its properties and advantages compared to other materials can hinder market growth.
  • Fluctuations in energy prices can influence production costs for calcium silicate insulation, as energy-intensive processes are involved in manufacturing.

Comparative View of Adjacent Markets

Future Market Insights has compared three markets, namely market and the market are below. The robust expansion witnessed in the steel and cement sectors is anticipated to drive up the global demand for calcium oxide.

The soaring demand for calcium oxide stems from its escalating utilization across diverse sectors and the increasing requirement for related calcium oxide products

The increasing adoption of calcium sulfate as a soil amendment in agriculture due to its ability to improve soil structure, enhance nutrient availability, and promote plant growth is significantly driving market growth.

Calcium Silicate Insulation Market:

Attributes Calcium Silicate Insulation Market
CAGR from 2024 to 2034 4.8%
Key Trends
  • Rising demand for thermal insulation solutions in the construction and industrial sectors.
Growth Factor
  • Increasing applications in industries such as construction, oil & gas, petrochemicals, and power generation.

Calcium Oxide Market:

Attributes Calcium Oxide Market
CAGR from 2022 to 2032 5.3%
Key Trends
  • Growing demand for flexible material in construction industry
Growth Factor

Calcium Sulphate Market:

Attributes Calcium Sulphate Market
CAGR from 2023 to 2033 4.1%
Key Trends
  • Expanding application in various industries such as agriculture, construction, food & beverages, and pharmaceuticals.
Growth Factor
  • The increasing recognition of the advantages associated with calcium sulphate as a soil amendment for agricultural purposes is leading to greater awareness.

Get the data you need at a Fraction of the cost

Personalize your report by choosing insights you need
and save 40%!

Country-wise Analysis

The provided table highlights the top five countries in terms of revenue, with South Korea and China leading the list. Government support through policies, regulations, and incentives for energy-efficient building materials could encourage the adoption of calcium silicate insulation in the construction industry in South Korea.

Ongoing technological advancements in insulation materials may contribute to the growth of the calcium silicate insulation market in China.

Countries Forecast CAGRs from 2024 to 2034
The United States 4.9%
The United Kingdom 5.5%
China 5.8%
Japan 5.6%
South Korea 6.0%

Growing Infrastructural Development to Boost the Market in the United States

The calcium silicate insulation market in the United States is expected to grow with a CAGR of 4.9% from 2024 to 2034. The growth of the market in the country is attributed to growth in residential, commercial, and industrial construction projects can drive the demand for insulation materials.

Ongoing and planned infrastructure development projects, such as transportation networks and utilities, can contribute to the demand for insulation materials in the United States.

The United States has been focusing on energy efficiency initiatives, with regulations and standards in place to encourage the use of insulation materials that contribute to better energy conservation. Calcium silicate insulation, known for its thermal resistance, can benefit from these initiatives.

Increased Renovation Activities to Propel the Market Demand in United Kingdom

The calcium silicate insulation market in the United Kingdom is expected to grow with a CAGR of 5.5% from 2024 to 2034. The United Kingdom has stringent building regulations and energy efficiency standards.

The demand for insulation materials, including calcium silicate, may be driven by the need for compliance with these standards in new construction and renovation projects.

The United Kingdom's commitment to renewable energy and sustainability initiatives could lead to increased construction and renovation activities, driving the demand for insulation materials in various applications, including residential and commercial buildings.

Incresed Urbanization in China drives Market Growth

The calcium silicate insulation market in the China is expected to grow with a CAGR of 5.8% from 2024 to 2034. The demand for insulation materials, including calcium silicate, is likely to be high in both residential and commercial construction in China.

Rapid urbanization in China has led to increased construction activities. The need for efficient insulation materials in new buildings and infrastructure projects can drive the growth of the calcium silicate insulation market.

Increasing awareness of sustainable building practices and green construction may lead to a higher demand for insulation materials that have minimal environmental impact, further benefiting calcium silicate insulation.
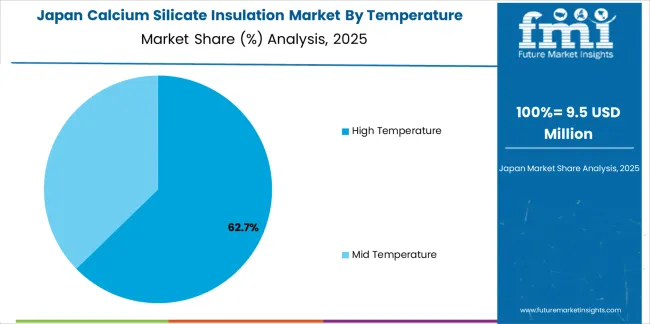
Increasing Demand for Energy Efficient Material in Construction to Boost the Market in Japan

The calcium silicate insulation market in the Japan is expected to grow with a CAGR of 5.6% from 2024 to 2034. Calcium silicate insulation is used in various industrial applications, including manufacturing and petrochemical facilities. As Japan is known for its advanced industrial sector, the demand for insulation materials in these applications may contribute to market growth.

The retrofitting and renovation of existing buildings to improve energy efficiency and comply with modern standards could drive the demand for insulation materials, presenting opportunities for calcium silicate insulation in the Japanese market.

Government support through subsidies, grants, or other incentives for using energy-efficient and environmentally friendly materials could further drive the growth of the calcium silicate insulation market in Japan.
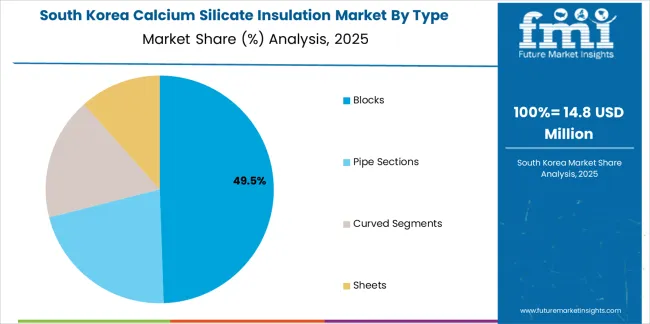
Industrial Growth in South Korea Drives Market Demand

The demand for high-performance insulation materials like calcium silicate may be driven by a focus on meeting energy efficiency requirements in construction projects in South Korea.

South Korea has been emphasizing energy efficiency and sustainability in construction. Government initiatives and incentives promoting energy-efficient practices could drive the adoption of insulation materials in the country.

South Korea has a robust industrial sector, including petrochemicals and manufacturing. Calcium silicate insulation is commonly used in industrial settings, and the growth of these sectors may positively impact the demand for insulation materials. The calcium silicate insulation market in the South Korea is expected to grow with a CAGR of 6.0% from 2024 to 2034.

Category-wise Insights

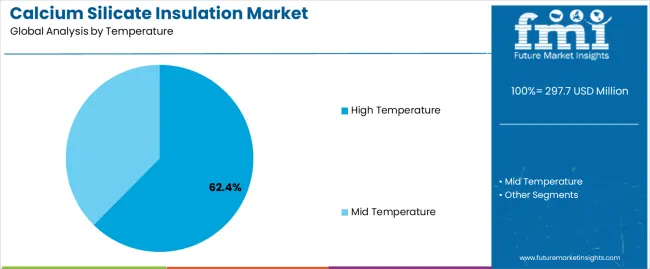
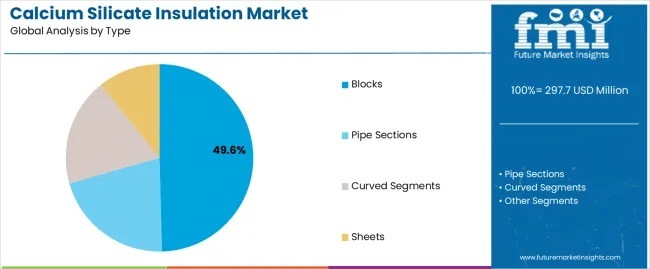
The below section shows the leading segment. The high temperature segment is to grow at a CAGR of 4.6% from 2024 to 2034. Based on form, the blocks segment is anticipated to hold a dominant share through 2034. It is set to exhibit a CAGR of 4.4% from 2024 to 2034.

Category CAGR from 2024 to 2034
High Temperature 4.6%
Blocks 4.4%

High Temperature Segment to Remain Prominent Throughout the Forecast Period

Based on the temperature, the high temperature segment is anticipated to thrive at a CAGR of 4.6% from 2024 to 2034. High-temperature calcium silicate insulation is widely used in various industrial applications where there are elevated temperatures.

Industries such as petrochemical, metallurgy, cement, glass, and steel often require insulation materials that can withstand and effectively manage high temperatures.

High-temperature calcium silicate insulation is known for its excellent heat resistance. It can withstand temperatures well above what traditional insulation materials can endure without significant degradation or loss of insulation properties. High-temperature calcium silicate insulation helps in conserving energy by minimizing heat loss and maintaining the desired temperatures within industrial

Blocks Segment to Remain Prominent Throughout the Forecast Period

Based on the form, the blocks segment is anticipated to thrive at a CAGR of 4.4% from 2024 to 2034. Calcium silicate insulation blocks offer excellent thermal insulation properties, making them desirable for various applications where temperature control is critical.

Industries such as construction, oil and gas, petrochemicals, and manufacturing often require high-quality thermal insulation materials to maintain process efficiency and safety.

Calcium silicate insulation blocks have high fire resistance, making them suitable for applications where fire safety is a concern, such as in building construction, industrial facilities, and marine environments.

These blocks typically have good resistance to moisture, which is advantageous in environments where moisture ingress can cause damage or compromise the insulation's effectiveness.

Calcium silicate insulation blocks are known for their durability and longevity, providing long-term insulation solutions that require minimal maintenance. This makes them a cost-effective choice for various applications.
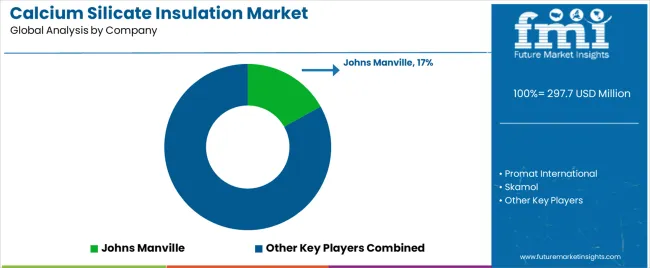
Competitive Landscape

The leading players in the market are forming strategic partnerships with other companies in the industry to leverage complementary strengths, share resources, and expand market reach. The market players are offering customized solutions to meet the specific requirements of different industries and applications, catering to a broader range of customers.

  • In June 2023 - Etex finalized the acquisition of Superglass, a prominent insulation producer based in the UK. This strategic move enables Etex to expand its European presence in sustainable insulation solutions, complementing its current portfolio, which includes glass mineral wool and extruded polystyrene manufactured by URSA.
  • In August 2023 - Isolatek was acquired by an affiliate of SK Partners, a prominent global provider of cutting-edge building safety and performance solutions. This strategic development represents a significant milestone in Isolatek's mission to elevate fire safety standards on a global scale.

Report Scope

Attributes Details
Estimated Market Size in 2024 US$ 284.1 million
Projected Market Valuation in 2034 US$ 456 million
Value-based CAGR 2024 to 2034 4.8%
Forecast Period 2024 to 2034
Historical Data Available for 2019 to 2023
Market Analysis Value in US$ million
Key Regions Covered
  • North America
  • Latin America
  • Western Europe
  • Eastern Europe
  • South Asia and Pacific
  • East Asia
  • Middle East and Africa
Key Market Segments Covered
  • Temperature
  • Form
  • End Use
  • Region
Key Countries Profiled
  • The United States
  • Canada
  • Brazil
  • Mexico
  • Germany
  • The United Kingdom
  • France
  • Spain
  • Italy
  • Russia
  • Poland
  • Czech Republic
  • Romania
  • India
  • Bangladesh
  • Australia
  • New Zealand
  • China
  • Japan
  • South Korea
  • GCC countries
  • South Africa
  • Israel
Key Companies Profiled
  • Promat International
  • Johns Manville
  • Skamol
  • Isolatek International
  • L'ISOLANTE K-FLEX
  • NICHIAS Corporation
  • Etex Group

Calcium Silicate Insulation Market - Key Segments

By Temperature:

  • High temperature
  • Mid temperature

By Type:

  • Blocks
  • Pipe sections
  • Curved segments
  • Sheets

By End Use:

  • Metals
  • Industrial
  • Power generation
  • Petrochemical
  • Transport
  • Others

By Region:

  • North America
  • Latin America
  • Western Europe
  • Eastern Europe
  • South Asia and Pacific
  • East Asia
  • Middle East and Africa

Frequently Asked Questions

What is the expected worth of the calcium silicate insulation market in 2024?

As of 2024, the market for calcium silicate insulation is expected to be valued at US$ 284.1 million.

What is the anticipated market value for the calcium silicate insulation in 2034?

By 2034, the market value of calcium silicate insulation is expected to reach US$ 456 million.

What is the projected forecast CAGR for the calcium silicate insulation market from 2024 to 2034?

From 2024 to 2034, the calcium silicate insulation market is expected to flourish at a CAGR of 4.8%

Based on temperature, which segment dominates the calcium silicate insulation market?

High Temperature segment is expected to grow at a CAGR of 4.6% from 2024 to 2034.

Which country is likely to be at the pinnacle of the market?

South Korea is likely the top-performing market, with a CAGR of 6.0%.

Table of Content

1. Executive Summary

    1.1. Global Market Outlook

    1.2. Demand-side Trends

    1.3. Supply-side Trends

    1.4. Technology Roadmap Analysis

    1.5. Analysis and Recommendations

2. Market Overview

    2.1. Market Coverage / Taxonomy

    2.2. Market Definition / Scope / Limitations

3. Market Background

    3.1. Market Dynamics

        3.1.1. Drivers

        3.1.2. Restraints

        3.1.3. Opportunity

        3.1.4. Trends

    3.2. Scenario Forecast

        3.2.1. Demand in Optimistic Scenario

        3.2.2. Demand in Likely Scenario

        3.2.3. Demand in Conservative Scenario

    3.3. Opportunity Map Analysis

    3.4. Product Life Cycle Analysis

    3.5. Supply Chain Analysis

        3.5.1. Supply Side Participants and their Roles

            3.5.1.1. Producers

            3.5.1.2. Mid-Level Participants (Traders/ Agents/ Brokers)

            3.5.1.3. Wholesalers and Distributors

        3.5.2. Value Added and Value Created at Node in the Supply Chain

        3.5.3. List of Raw Material Suppliers

        3.5.4. List of Existing and Potential Buyer’s

    3.6. Investment Feasibility Matrix

    3.7. Value Chain Analysis

        3.7.1. Profit Margin Analysis

        3.7.2. Wholesalers and Distributors

        3.7.3. Retailers

    3.8. PESTLE and Porter’s Analysis

    3.9. Regulatory Landscape

        3.9.1. By Key Regions

        3.9.2. By Key Countries

    3.10. Regional Parent Market Outlook

    3.11. Production and Consumption Statistics

    3.12. Import and Export Statistics

4. Global Market Analysis 2019 to 2023 and Forecast, 2024 to 2034

    4.1. Historical Market Size Value (US$ Million) & Volume (Unit) Analysis, 2019 to 2023

    4.2. Current and Future Market Size Value (US$ Million) & Volume (Unit) Projections, 2024 to 2034

        4.2.1. Y-o-Y Growth Trend Analysis

        4.2.2. Absolute $ Opportunity Analysis

5. Global Market Analysis 2019 to 2023 and Forecast 2024 to 2034, By Temperature

    5.1. Introduction / Key Findings

    5.2. Historical Market Size Value (US$ Million) & Volume (Unit) Analysis By Temperature, 2019 to 2023

    5.3. Current and Future Market Size Value (US$ Million) & Volume (Unit) Analysis and Forecast By Temperature, 2024 to 2034

        5.3.1. High temperature

        5.3.2. Mid temperature

    5.4. Y-o-Y Growth Trend Analysis By Temperature, 2019 to 2023

    5.5. Absolute $ Opportunity Analysis By Temperature, 2024 to 2034

6. Global Market Analysis 2019 to 2023 and Forecast 2024 to 2034, By Form

    6.1. Introduction / Key Findings

    6.2. Historical Market Size Value (US$ Million) & Volume (Unit) Analysis By Form, 2019 to 2023

    6.3. Current and Future Market Size Value (US$ Million) & Volume (Unit) Analysis and Forecast By Form, 2024 to 2034

        6.3.1. Blocks

        6.3.2. Pipe sections

        6.3.3. Curved segments

        6.3.4. Sheets

    6.4. Y-o-Y Growth Trend Analysis By Form, 2019 to 2023

    6.5. Absolute $ Opportunity Analysis By Form, 2024 to 2034

7. Global Market Analysis 2019 to 2023 and Forecast 2024 to 2034, By End-Use

    7.1. Introduction / Key Findings

    7.2. Historical Market Size Value (US$ Million) & Volume (Unit) Analysis By End-Use, 2019 to 2023

    7.3. Current and Future Market Size Value (US$ Million) & Volume (Unit) Analysis and Forecast By End-Use, 2024 to 2034

        7.3.1. Metals

        7.3.2. Industrial

        7.3.3. Power generation

        7.3.4. Petrochemical

        7.3.5. Transport

        7.3.6. Others

    7.4. Y-o-Y Growth Trend Analysis By End-Use, 2019 to 2023

    7.5. Absolute $ Opportunity Analysis By End-Use, 2024 to 2034

8. Global Market Analysis 2019 to 2023 and Forecast 2024 to 2034, By Region

    8.1. Introduction

    8.2. Historical Market Size Value (US$ Million) & Volume (Unit) Analysis By Region, 2019 to 2023

    8.3. Current Market Size Value (US$ Million) & Volume (Unit) Analysis and Forecast By Region, 2024 to 2034

        8.3.1. North America

        8.3.2. Latin America

        8.3.3. Western Europe

        8.3.4. Eastern Europe

        8.3.5. South Asia and Pacific

        8.3.6. East Asia

        8.3.7. Middle East and Africa

    8.4. Market Attractiveness Analysis By Region

9. North America Market Analysis 2019 to 2023 and Forecast 2024 to 2034, By Country

    9.1. Historical Market Size Value (US$ Million) & Volume (Unit) Trend Analysis By Market Taxonomy, 2019 to 2023

    9.2. Market Size Value (US$ Million) & Volume (Unit) Forecast By Market Taxonomy, 2024 to 2034

        9.2.1. By Country

            9.2.1.1. USA

            9.2.1.2. Canada

        9.2.2. By Temperature

        9.2.3. By Form

        9.2.4. By End-Use

    9.3. Market Attractiveness Analysis

        9.3.1. By Country

        9.3.2. By Temperature

        9.3.3. By Form

        9.3.4. By End-Use

    9.4. Key Takeaways

10. Latin America Market Analysis 2019 to 2023 and Forecast 2024 to 2034, By Country

    10.1. Historical Market Size Value (US$ Million) & Volume (Unit) Trend Analysis By Market Taxonomy, 2019 to 2023

    10.2. Market Size Value (US$ Million) & Volume (Unit) Forecast By Market Taxonomy, 2024 to 2034

        10.2.1. By Country

            10.2.1.1. Brazil

            10.2.1.2. Mexico

            10.2.1.3. Rest of Latin America

        10.2.2. By Temperature

        10.2.3. By Form

        10.2.4. By End-Use

    10.3. Market Attractiveness Analysis

        10.3.1. By Country

        10.3.2. By Temperature

        10.3.3. By Form

        10.3.4. By End-Use

    10.4. Key Takeaways

11. Western Europe Market Analysis 2019 to 2023 and Forecast 2024 to 2034, By Country

    11.1. Historical Market Size Value (US$ Million) & Volume (Unit) Trend Analysis By Market Taxonomy, 2019 to 2023

    11.2. Market Size Value (US$ Million) & Volume (Unit) Forecast By Market Taxonomy, 2024 to 2034

        11.2.1. By Country

            11.2.1.1. Germany

            11.2.1.2. UK

            11.2.1.3. France

            11.2.1.4. Spain

            11.2.1.5. Italy

            11.2.1.6. Rest of Western Europe

        11.2.2. By Temperature

        11.2.3. By Form

        11.2.4. By End-Use

    11.3. Market Attractiveness Analysis

        11.3.1. By Country

        11.3.2. By Temperature

        11.3.3. By Form

        11.3.4. By End-Use

    11.4. Key Takeaways

12. Eastern Europe Market Analysis 2019 to 2023 and Forecast 2024 to 2034, By Country

    12.1. Historical Market Size Value (US$ Million) & Volume (Unit) Trend Analysis By Market Taxonomy, 2019 to 2023

    12.2. Market Size Value (US$ Million) & Volume (Unit) Forecast By Market Taxonomy, 2024 to 2034

        12.2.1. By Country

            12.2.1.1. Poland

            12.2.1.2. Russia

            12.2.1.3. Czech Republic

            12.2.1.4. Romania

            12.2.1.5. Rest of Eastern Europe

        12.2.2. By Temperature

        12.2.3. By Form

        12.2.4. By End-Use

    12.3. Market Attractiveness Analysis

        12.3.1. By Country

        12.3.2. By Temperature

        12.3.3. By Form

        12.3.4. By End-Use

    12.4. Key Takeaways

13. South Asia and Pacific Market Analysis 2019 to 2023 and Forecast 2024 to 2034, By Country

    13.1. Historical Market Size Value (US$ Million) & Volume (Unit) Trend Analysis By Market Taxonomy, 2019 to 2023

    13.2. Market Size Value (US$ Million) & Volume (Unit) Forecast By Market Taxonomy, 2024 to 2034

        13.2.1. By Country

            13.2.1.1. India

            13.2.1.2. Bangladesh

            13.2.1.3. Australia

            13.2.1.4. New Zealand

            13.2.1.5. Rest of South Asia and Pacific

        13.2.2. By Temperature

        13.2.3. By Form

        13.2.4. By End-Use

    13.3. Market Attractiveness Analysis

        13.3.1. By Country

        13.3.2. By Temperature

        13.3.3. By Form

        13.3.4. By End-Use

    13.4. Key Takeaways

14. East Asia Market Analysis 2019 to 2023 and Forecast 2024 to 2034, By Country

    14.1. Historical Market Size Value (US$ Million) & Volume (Unit) Trend Analysis By Market Taxonomy, 2019 to 2023

    14.2. Market Size Value (US$ Million) & Volume (Unit) Forecast By Market Taxonomy, 2024 to 2034

        14.2.1. By Country

            14.2.1.1. China

            14.2.1.2. Japan

            14.2.1.3. South Korea

        14.2.2. By Temperature

        14.2.3. By Form

        14.2.4. By End-Use

    14.3. Market Attractiveness Analysis

        14.3.1. By Country

        14.3.2. By Temperature

        14.3.3. By Form

        14.3.4. By End-Use

    14.4. Key Takeaways

15. Middle East and Africa Market Analysis 2019 to 2023 and Forecast 2024 to 2034, By Country

    15.1. Historical Market Size Value (US$ Million) & Volume (Unit) Trend Analysis By Market Taxonomy, 2019 to 2023

    15.2. Market Size Value (US$ Million) & Volume (Unit) Forecast By Market Taxonomy, 2024 to 2034

        15.2.1. By Country

            15.2.1.1. GCC Countries

            15.2.1.2. South Africa

            15.2.1.3. Israel

            15.2.1.4. Rest of MEA

        15.2.2. By Temperature

        15.2.3. By Form

        15.2.4. By End-Use

    15.3. Market Attractiveness Analysis

        15.3.1. By Country

        15.3.2. By Temperature

        15.3.3. By Form

        15.3.4. By End-Use

    15.4. Key Takeaways

16. Key Countries Market Analysis

    16.1. USA

        16.1.1. Pricing Analysis

        16.1.2. Market Share Analysis, 2023

            16.1.2.1. By Temperature

            16.1.2.2. By Form

            16.1.2.3. By End-Use

    16.2. Canada

        16.2.1. Pricing Analysis

        16.2.2. Market Share Analysis, 2023

            16.2.2.1. By Temperature

            16.2.2.2. By Form

            16.2.2.3. By End-Use

    16.3. Brazil

        16.3.1. Pricing Analysis

        16.3.2. Market Share Analysis, 2023

            16.3.2.1. By Temperature

            16.3.2.2. By Form

            16.3.2.3. By End-Use

    16.4. Mexico

        16.4.1. Pricing Analysis

        16.4.2. Market Share Analysis, 2023

            16.4.2.1. By Temperature

            16.4.2.2. By Form

            16.4.2.3. By End-Use

    16.5. Germany

        16.5.1. Pricing Analysis

        16.5.2. Market Share Analysis, 2023

            16.5.2.1. By Temperature

            16.5.2.2. By Form

            16.5.2.3. By End-Use

    16.6. UK

        16.6.1. Pricing Analysis

        16.6.2. Market Share Analysis, 2023

            16.6.2.1. By Temperature

            16.6.2.2. By Form

            16.6.2.3. By End-Use

    16.7. France

        16.7.1. Pricing Analysis

        16.7.2. Market Share Analysis, 2023

            16.7.2.1. By Temperature

            16.7.2.2. By Form

            16.7.2.3. By End-Use

    16.8. Spain

        16.8.1. Pricing Analysis

        16.8.2. Market Share Analysis, 2023

            16.8.2.1. By Temperature

            16.8.2.2. By Form

            16.8.2.3. By End-Use

    16.9. Italy

        16.9.1. Pricing Analysis

        16.9.2. Market Share Analysis, 2023

            16.9.2.1. By Temperature

            16.9.2.2. By Form

            16.9.2.3. By End-Use

    16.10. Poland

        16.10.1. Pricing Analysis

        16.10.2. Market Share Analysis, 2023

            16.10.2.1. By Temperature

            16.10.2.2. By Form

            16.10.2.3. By End-Use

    16.11. Russia

        16.11.1. Pricing Analysis

        16.11.2. Market Share Analysis, 2023

            16.11.2.1. By Temperature

            16.11.2.2. By Form

            16.11.2.3. By End-Use

    16.12. Czech Republic

        16.12.1. Pricing Analysis

        16.12.2. Market Share Analysis, 2023

            16.12.2.1. By Temperature

            16.12.2.2. By Form

            16.12.2.3. By End-Use

    16.13. Romania

        16.13.1. Pricing Analysis

        16.13.2. Market Share Analysis, 2023

            16.13.2.1. By Temperature

            16.13.2.2. By Form

            16.13.2.3. By End-Use

    16.14. India

        16.14.1. Pricing Analysis

        16.14.2. Market Share Analysis, 2023

            16.14.2.1. By Temperature

            16.14.2.2. By Form

            16.14.2.3. By End-Use

    16.15. Bangladesh

        16.15.1. Pricing Analysis

        16.15.2. Market Share Analysis, 2023

            16.15.2.1. By Temperature

            16.15.2.2. By Form

            16.15.2.3. By End-Use

    16.16. Australia

        16.16.1. Pricing Analysis

        16.16.2. Market Share Analysis, 2023

            16.16.2.1. By Temperature

            16.16.2.2. By Form

            16.16.2.3. By End-Use

    16.17. New Zealand

        16.17.1. Pricing Analysis

        16.17.2. Market Share Analysis, 2023

            16.17.2.1. By Temperature

            16.17.2.2. By Form

            16.17.2.3. By End-Use

    16.18. China

        16.18.1. Pricing Analysis

        16.18.2. Market Share Analysis, 2023

            16.18.2.1. By Temperature

            16.18.2.2. By Form

            16.18.2.3. By End-Use

    16.19. Japan

        16.19.1. Pricing Analysis

        16.19.2. Market Share Analysis, 2023

            16.19.2.1. By Temperature

            16.19.2.2. By Form

            16.19.2.3. By End-Use

    16.20. South Korea

        16.20.1. Pricing Analysis

        16.20.2. Market Share Analysis, 2023

            16.20.2.1. By Temperature

            16.20.2.2. By Form

            16.20.2.3. By End-Use

    16.21. GCC Countries

        16.21.1. Pricing Analysis

        16.21.2. Market Share Analysis, 2023

            16.21.2.1. By Temperature

            16.21.2.2. By Form

            16.21.2.3. By End-Use

    16.22. South Africa

        16.22.1. Pricing Analysis

        16.22.2. Market Share Analysis, 2023

            16.22.2.1. By Temperature

            16.22.2.2. By Form

            16.22.2.3. By End-Use

    16.23. Israel

        16.23.1. Pricing Analysis

        16.23.2. Market Share Analysis, 2023

            16.23.2.1. By Temperature

            16.23.2.2. By Form

            16.23.2.3. By End-Use

17. Market Structure Analysis

    17.1. Competition Dashboard

    17.2. Competition Benchmarking

    17.3. Market Share Analysis of Top Players

        17.3.1. By Regional

        17.3.2. By Temperature

        17.3.3. By Form

        17.3.4. By End-Use

18. Competition Analysis

    18.1. Competition Deep Dive

        18.1.1. Promat International

            18.1.1.1. Overview

            18.1.1.2. Product Portfolio

            18.1.1.3. Profitability by Market Segments

            18.1.1.4. Sales Footprint

            18.1.1.5. Strategy Overview

                18.1.1.5.1. Marketing Strategy

                18.1.1.5.2. Product Strategy

                18.1.1.5.3. Channel Strategy

        18.1.2. Johns Manville

            18.1.2.1. Overview

            18.1.2.2. Product Portfolio

            18.1.2.3. Profitability by Market Segments

            18.1.2.4. Sales Footprint

            18.1.2.5. Strategy Overview

                18.1.2.5.1. Marketing Strategy

                18.1.2.5.2. Product Strategy

                18.1.2.5.3. Channel Strategy

        18.1.3. Skamol

            18.1.3.1. Overview

            18.1.3.2. Product Portfolio

            18.1.3.3. Profitability by Market Segments

            18.1.3.4. Sales Footprint

            18.1.3.5. Strategy Overview

                18.1.3.5.1. Marketing Strategy

                18.1.3.5.2. Product Strategy

                18.1.3.5.3. Channel Strategy

        18.1.4. Isolatek International

            18.1.4.1. Overview

            18.1.4.2. Product Portfolio

            18.1.4.3. Profitability by Market Segments

            18.1.4.4. Sales Footprint

            18.1.4.5. Strategy Overview

                18.1.4.5.1. Marketing Strategy

                18.1.4.5.2. Product Strategy

                18.1.4.5.3. Channel Strategy

        18.1.5. L'ISOLANTE K-FLEX

            18.1.5.1. Overview

            18.1.5.2. Product Portfolio

            18.1.5.3. Profitability by Market Segments

            18.1.5.4. Sales Footprint

            18.1.5.5. Strategy Overview

                18.1.5.5.1. Marketing Strategy

                18.1.5.5.2. Product Strategy

                18.1.5.5.3. Channel Strategy

        18.1.6. NICHIAS Corporation

            18.1.6.1. Overview

            18.1.6.2. Product Portfolio

            18.1.6.3. Profitability by Market Segments

            18.1.6.4. Sales Footprint

            18.1.6.5. Strategy Overview

                18.1.6.5.1. Marketing Strategy

                18.1.6.5.2. Product Strategy

                18.1.6.5.3. Channel Strategy

        18.1.7. Etex Group

            18.1.7.1. Overview

            18.1.7.2. Product Portfolio

            18.1.7.3. Profitability by Market Segments

            18.1.7.4. Sales Footprint

            18.1.7.5. Strategy Overview

                18.1.7.5.1. Marketing Strategy

                18.1.7.5.2. Product Strategy

                18.1.7.5.3. Channel Strategy

19. Assumptions & Acronyms Used

20. Research Methodology

List of Tables

Table 1: Global Market Value (US$ Million) Forecast by Region, 2019 to 2034

Table 2: Global Market Volume (Unit) Forecast by Region, 2019 to 2034

Table 3: Global Market Value (US$ Million) Forecast by Temperature, 2019 to 2034

Table 4: Global Market Volume (Unit) Forecast by Temperature, 2019 to 2034

Table 5: Global Market Value (US$ Million) Forecast by Form, 2019 to 2034

Table 6: Global Market Volume (Unit) Forecast by Form, 2019 to 2034

Table 7: Global Market Value (US$ Million) Forecast by End-Use, 2019 to 2034

Table 8: Global Market Volume (Unit) Forecast by End-Use, 2019 to 2034

Table 9: North America Market Value (US$ Million) Forecast by Country, 2019 to 2034

Table 10: North America Market Volume (Unit) Forecast by Country, 2019 to 2034

Table 11: North America Market Value (US$ Million) Forecast by Temperature, 2019 to 2034

Table 12: North America Market Volume (Unit) Forecast by Temperature, 2019 to 2034

Table 13: North America Market Value (US$ Million) Forecast by Form, 2019 to 2034

Table 14: North America Market Volume (Unit) Forecast by Form, 2019 to 2034

Table 15: North America Market Value (US$ Million) Forecast by End-Use, 2019 to 2034

Table 16: North America Market Volume (Unit) Forecast by End-Use, 2019 to 2034

Table 17: Latin America Market Value (US$ Million) Forecast by Country, 2019 to 2034

Table 18: Latin America Market Volume (Unit) Forecast by Country, 2019 to 2034

Table 19: Latin America Market Value (US$ Million) Forecast by Temperature, 2019 to 2034

Table 20: Latin America Market Volume (Unit) Forecast by Temperature, 2019 to 2034

Table 21: Latin America Market Value (US$ Million) Forecast by Form, 2019 to 2034

Table 22: Latin America Market Volume (Unit) Forecast by Form, 2019 to 2034

Table 23: Latin America Market Value (US$ Million) Forecast by End-Use, 2019 to 2034

Table 24: Latin America Market Volume (Unit) Forecast by End-Use, 2019 to 2034

Table 25: Western Europe Market Value (US$ Million) Forecast by Country, 2019 to 2034

Table 26: Western Europe Market Volume (Unit) Forecast by Country, 2019 to 2034

Table 27: Western Europe Market Value (US$ Million) Forecast by Temperature, 2019 to 2034

Table 28: Western Europe Market Volume (Unit) Forecast by Temperature, 2019 to 2034

Table 29: Western Europe Market Value (US$ Million) Forecast by Form, 2019 to 2034

Table 30: Western Europe Market Volume (Unit) Forecast by Form, 2019 to 2034

Table 31: Western Europe Market Value (US$ Million) Forecast by End-Use, 2019 to 2034

Table 32: Western Europe Market Volume (Unit) Forecast by End-Use, 2019 to 2034

Table 33: Eastern Europe Market Value (US$ Million) Forecast by Country, 2019 to 2034

Table 34: Eastern Europe Market Volume (Unit) Forecast by Country, 2019 to 2034

Table 35: Eastern Europe Market Value (US$ Million) Forecast by Temperature, 2019 to 2034

Table 36: Eastern Europe Market Volume (Unit) Forecast by Temperature, 2019 to 2034

Table 37: Eastern Europe Market Value (US$ Million) Forecast by Form, 2019 to 2034

Table 38: Eastern Europe Market Volume (Unit) Forecast by Form, 2019 to 2034

Table 39: Eastern Europe Market Value (US$ Million) Forecast by End-Use, 2019 to 2034

Table 40: Eastern Europe Market Volume (Unit) Forecast by End-Use, 2019 to 2034

Table 41: South Asia and Pacific Market Value (US$ Million) Forecast by Country, 2019 to 2034

Table 42: South Asia and Pacific Market Volume (Unit) Forecast by Country, 2019 to 2034

Table 43: South Asia and Pacific Market Value (US$ Million) Forecast by Temperature, 2019 to 2034

Table 44: South Asia and Pacific Market Volume (Unit) Forecast by Temperature, 2019 to 2034

Table 45: South Asia and Pacific Market Value (US$ Million) Forecast by Form, 2019 to 2034

Table 46: South Asia and Pacific Market Volume (Unit) Forecast by Form, 2019 to 2034

Table 47: South Asia and Pacific Market Value (US$ Million) Forecast by End-Use, 2019 to 2034

Table 48: South Asia and Pacific Market Volume (Unit) Forecast by End-Use, 2019 to 2034

Table 49: East Asia Market Value (US$ Million) Forecast by Country, 2019 to 2034

Table 50: East Asia Market Volume (Unit) Forecast by Country, 2019 to 2034

Table 51: East Asia Market Value (US$ Million) Forecast by Temperature, 2019 to 2034

Table 52: East Asia Market Volume (Unit) Forecast by Temperature, 2019 to 2034

Table 53: East Asia Market Value (US$ Million) Forecast by Form, 2019 to 2034

Table 54: East Asia Market Volume (Unit) Forecast by Form, 2019 to 2034

Table 55: East Asia Market Value (US$ Million) Forecast by End-Use, 2019 to 2034

Table 56: East Asia Market Volume (Unit) Forecast by End-Use, 2019 to 2034

Table 57: Middle East and Africa Market Value (US$ Million) Forecast by Country, 2019 to 2034

Table 58: Middle East and Africa Market Volume (Unit) Forecast by Country, 2019 to 2034

Table 59: Middle East and Africa Market Value (US$ Million) Forecast by Temperature, 2019 to 2034

Table 60: Middle East and Africa Market Volume (Unit) Forecast by Temperature, 2019 to 2034

Table 61: Middle East and Africa Market Value (US$ Million) Forecast by Form, 2019 to 2034

Table 62: Middle East and Africa Market Volume (Unit) Forecast by Form, 2019 to 2034

Table 63: Middle East and Africa Market Value (US$ Million) Forecast by End-Use, 2019 to 2034

Table 64: Middle East and Africa Market Volume (Unit) Forecast by End-Use, 2019 to 2034

List of Charts

Figure 1: Global Market Value (US$ Million) by Temperature, 2024 to 2034

Figure 2: Global Market Value (US$ Million) by Form, 2024 to 2034

Figure 3: Global Market Value (US$ Million) by End-Use, 2024 to 2034

Figure 4: Global Market Value (US$ Million) by Region, 2024 to 2034

Figure 5: Global Market Value (US$ Million) Analysis by Region, 2019 to 2034

Figure 6: Global Market Volume (Unit) Analysis by Region, 2019 to 2034

Figure 7: Global Market Value Share (%) and BPS Analysis by Region, 2024 to 2034

Figure 8: Global Market Y-o-Y Growth (%) Projections by Region, 2024 to 2034

Figure 9: Global Market Value (US$ Million) Analysis by Temperature, 2019 to 2034

Figure 10: Global Market Volume (Unit) Analysis by Temperature, 2019 to 2034

Figure 11: Global Market Value Share (%) and BPS Analysis by Temperature, 2024 to 2034

Figure 12: Global Market Y-o-Y Growth (%) Projections by Temperature, 2024 to 2034

Figure 13: Global Market Value (US$ Million) Analysis by Form, 2019 to 2034

Figure 14: Global Market Volume (Unit) Analysis by Form, 2019 to 2034

Figure 15: Global Market Value Share (%) and BPS Analysis by Form, 2024 to 2034

Figure 16: Global Market Y-o-Y Growth (%) Projections by Form, 2024 to 2034

Figure 17: Global Market Value (US$ Million) Analysis by End-Use, 2019 to 2034

Figure 18: Global Market Volume (Unit) Analysis by End-Use, 2019 to 2034

Figure 19: Global Market Value Share (%) and BPS Analysis by End-Use, 2024 to 2034

Figure 20: Global Market Y-o-Y Growth (%) Projections by End-Use, 2024 to 2034

Figure 21: Global Market Attractiveness by Temperature, 2024 to 2034

Figure 22: Global Market Attractiveness by Form, 2024 to 2034

Figure 23: Global Market Attractiveness by End-Use, 2024 to 2034

Figure 24: Global Market Attractiveness by Region, 2024 to 2034

Figure 25: North America Market Value (US$ Million) by Temperature, 2024 to 2034

Figure 26: North America Market Value (US$ Million) by Form, 2024 to 2034

Figure 27: North America Market Value (US$ Million) by End-Use, 2024 to 2034

Figure 28: North America Market Value (US$ Million) by Country, 2024 to 2034

Figure 29: North America Market Value (US$ Million) Analysis by Country, 2019 to 2034

Figure 30: North America Market Volume (Unit) Analysis by Country, 2019 to 2034

Figure 31: North America Market Value Share (%) and BPS Analysis by Country, 2024 to 2034

Figure 32: North America Market Y-o-Y Growth (%) Projections by Country, 2024 to 2034

Figure 33: North America Market Value (US$ Million) Analysis by Temperature, 2019 to 2034

Figure 34: North America Market Volume (Unit) Analysis by Temperature, 2019 to 2034

Figure 35: North America Market Value Share (%) and BPS Analysis by Temperature, 2024 to 2034

Figure 36: North America Market Y-o-Y Growth (%) Projections by Temperature, 2024 to 2034

Figure 37: North America Market Value (US$ Million) Analysis by Form, 2019 to 2034

Figure 38: North America Market Volume (Unit) Analysis by Form, 2019 to 2034

Figure 39: North America Market Value Share (%) and BPS Analysis by Form, 2024 to 2034

Figure 40: North America Market Y-o-Y Growth (%) Projections by Form, 2024 to 2034

Figure 41: North America Market Value (US$ Million) Analysis by End-Use, 2019 to 2034

Figure 42: North America Market Volume (Unit) Analysis by End-Use, 2019 to 2034

Figure 43: North America Market Value Share (%) and BPS Analysis by End-Use, 2024 to 2034

Figure 44: North America Market Y-o-Y Growth (%) Projections by End-Use, 2024 to 2034

Figure 45: North America Market Attractiveness by Temperature, 2024 to 2034

Figure 46: North America Market Attractiveness by Form, 2024 to 2034

Figure 47: North America Market Attractiveness by End-Use, 2024 to 2034

Figure 48: North America Market Attractiveness by Country, 2024 to 2034

Figure 49: Latin America Market Value (US$ Million) by Temperature, 2024 to 2034

Figure 50: Latin America Market Value (US$ Million) by Form, 2024 to 2034

Figure 51: Latin America Market Value (US$ Million) by End-Use, 2024 to 2034

Figure 52: Latin America Market Value (US$ Million) by Country, 2024 to 2034

Figure 53: Latin America Market Value (US$ Million) Analysis by Country, 2019 to 2034

Figure 54: Latin America Market Volume (Unit) Analysis by Country, 2019 to 2034

Figure 55: Latin America Market Value Share (%) and BPS Analysis by Country, 2024 to 2034

Figure 56: Latin America Market Y-o-Y Growth (%) Projections by Country, 2024 to 2034

Figure 57: Latin America Market Value (US$ Million) Analysis by Temperature, 2019 to 2034

Figure 58: Latin America Market Volume (Unit) Analysis by Temperature, 2019 to 2034

Figure 59: Latin America Market Value Share (%) and BPS Analysis by Temperature, 2024 to 2034

Figure 60: Latin America Market Y-o-Y Growth (%) Projections by Temperature, 2024 to 2034

Figure 61: Latin America Market Value (US$ Million) Analysis by Form, 2019 to 2034

Figure 62: Latin America Market Volume (Unit) Analysis by Form, 2019 to 2034

Figure 63: Latin America Market Value Share (%) and BPS Analysis by Form, 2024 to 2034

Figure 64: Latin America Market Y-o-Y Growth (%) Projections by Form, 2024 to 2034

Figure 65: Latin America Market Value (US$ Million) Analysis by End-Use, 2019 to 2034

Figure 66: Latin America Market Volume (Unit) Analysis by End-Use, 2019 to 2034

Figure 67: Latin America Market Value Share (%) and BPS Analysis by End-Use, 2024 to 2034

Figure 68: Latin America Market Y-o-Y Growth (%) Projections by End-Use, 2024 to 2034

Figure 69: Latin America Market Attractiveness by Temperature, 2024 to 2034

Figure 70: Latin America Market Attractiveness by Form, 2024 to 2034

Figure 71: Latin America Market Attractiveness by End-Use, 2024 to 2034

Figure 72: Latin America Market Attractiveness by Country, 2024 to 2034

Figure 73: Western Europe Market Value (US$ Million) by Temperature, 2024 to 2034

Figure 74: Western Europe Market Value (US$ Million) by Form, 2024 to 2034

Figure 75: Western Europe Market Value (US$ Million) by End-Use, 2024 to 2034

Figure 76: Western Europe Market Value (US$ Million) by Country, 2024 to 2034

Figure 77: Western Europe Market Value (US$ Million) Analysis by Country, 2019 to 2034

Figure 78: Western Europe Market Volume (Unit) Analysis by Country, 2019 to 2034

Figure 79: Western Europe Market Value Share (%) and BPS Analysis by Country, 2024 to 2034

Figure 80: Western Europe Market Y-o-Y Growth (%) Projections by Country, 2024 to 2034

Figure 81: Western Europe Market Value (US$ Million) Analysis by Temperature, 2019 to 2034

Figure 82: Western Europe Market Volume (Unit) Analysis by Temperature, 2019 to 2034

Figure 83: Western Europe Market Value Share (%) and BPS Analysis by Temperature, 2024 to 2034

Figure 84: Western Europe Market Y-o-Y Growth (%) Projections by Temperature, 2024 to 2034

Figure 85: Western Europe Market Value (US$ Million) Analysis by Form, 2019 to 2034

Figure 86: Western Europe Market Volume (Unit) Analysis by Form, 2019 to 2034

Figure 87: Western Europe Market Value Share (%) and BPS Analysis by Form, 2024 to 2034

Figure 88: Western Europe Market Y-o-Y Growth (%) Projections by Form, 2024 to 2034

Figure 89: Western Europe Market Value (US$ Million) Analysis by End-Use, 2019 to 2034

Figure 90: Western Europe Market Volume (Unit) Analysis by End-Use, 2019 to 2034

Figure 91: Western Europe Market Value Share (%) and BPS Analysis by End-Use, 2024 to 2034

Figure 92: Western Europe Market Y-o-Y Growth (%) Projections by End-Use, 2024 to 2034

Figure 93: Western Europe Market Attractiveness by Temperature, 2024 to 2034

Figure 94: Western Europe Market Attractiveness by Form, 2024 to 2034

Figure 95: Western Europe Market Attractiveness by End-Use, 2024 to 2034

Figure 96: Western Europe Market Attractiveness by Country, 2024 to 2034

Figure 97: Eastern Europe Market Value (US$ Million) by Temperature, 2024 to 2034

Figure 98: Eastern Europe Market Value (US$ Million) by Form, 2024 to 2034

Figure 99: Eastern Europe Market Value (US$ Million) by End-Use, 2024 to 2034

Figure 100: Eastern Europe Market Value (US$ Million) by Country, 2024 to 2034

Figure 101: Eastern Europe Market Value (US$ Million) Analysis by Country, 2019 to 2034

Figure 102: Eastern Europe Market Volume (Unit) Analysis by Country, 2019 to 2034

Figure 103: Eastern Europe Market Value Share (%) and BPS Analysis by Country, 2024 to 2034

Figure 104: Eastern Europe Market Y-o-Y Growth (%) Projections by Country, 2024 to 2034

Figure 105: Eastern Europe Market Value (US$ Million) Analysis by Temperature, 2019 to 2034

Figure 106: Eastern Europe Market Volume (Unit) Analysis by Temperature, 2019 to 2034

Figure 107: Eastern Europe Market Value Share (%) and BPS Analysis by Temperature, 2024 to 2034

Figure 108: Eastern Europe Market Y-o-Y Growth (%) Projections by Temperature, 2024 to 2034

Figure 109: Eastern Europe Market Value (US$ Million) Analysis by Form, 2019 to 2034

Figure 110: Eastern Europe Market Volume (Unit) Analysis by Form, 2019 to 2034

Figure 111: Eastern Europe Market Value Share (%) and BPS Analysis by Form, 2024 to 2034

Figure 112: Eastern Europe Market Y-o-Y Growth (%) Projections by Form, 2024 to 2034

Figure 113: Eastern Europe Market Value (US$ Million) Analysis by End-Use, 2019 to 2034

Figure 114: Eastern Europe Market Volume (Unit) Analysis by End-Use, 2019 to 2034

Figure 115: Eastern Europe Market Value Share (%) and BPS Analysis by End-Use, 2024 to 2034

Figure 116: Eastern Europe Market Y-o-Y Growth (%) Projections by End-Use, 2024 to 2034

Figure 117: Eastern Europe Market Attractiveness by Temperature, 2024 to 2034

Figure 118: Eastern Europe Market Attractiveness by Form, 2024 to 2034

Figure 119: Eastern Europe Market Attractiveness by End-Use, 2024 to 2034

Figure 120: Eastern Europe Market Attractiveness by Country, 2024 to 2034

Figure 121: South Asia and Pacific Market Value (US$ Million) by Temperature, 2024 to 2034

Figure 122: South Asia and Pacific Market Value (US$ Million) by Form, 2024 to 2034

Figure 123: South Asia and Pacific Market Value (US$ Million) by End-Use, 2024 to 2034

Figure 124: South Asia and Pacific Market Value (US$ Million) by Country, 2024 to 2034

Figure 125: South Asia and Pacific Market Value (US$ Million) Analysis by Country, 2019 to 2034

Figure 126: South Asia and Pacific Market Volume (Unit) Analysis by Country, 2019 to 2034

Figure 127: South Asia and Pacific Market Value Share (%) and BPS Analysis by Country, 2024 to 2034

Figure 128: South Asia and Pacific Market Y-o-Y Growth (%) Projections by Country, 2024 to 2034

Figure 129: South Asia and Pacific Market Value (US$ Million) Analysis by Temperature, 2019 to 2034

Figure 130: South Asia and Pacific Market Volume (Unit) Analysis by Temperature, 2019 to 2034

Figure 131: South Asia and Pacific Market Value Share (%) and BPS Analysis by Temperature, 2024 to 2034

Figure 132: South Asia and Pacific Market Y-o-Y Growth (%) Projections by Temperature, 2024 to 2034

Figure 133: South Asia and Pacific Market Value (US$ Million) Analysis by Form, 2019 to 2034

Figure 134: South Asia and Pacific Market Volume (Unit) Analysis by Form, 2019 to 2034

Figure 135: South Asia and Pacific Market Value Share (%) and BPS Analysis by Form, 2024 to 2034

Figure 136: South Asia and Pacific Market Y-o-Y Growth (%) Projections by Form, 2024 to 2034

Figure 137: South Asia and Pacific Market Value (US$ Million) Analysis by End-Use, 2019 to 2034

Figure 138: South Asia and Pacific Market Volume (Unit) Analysis by End-Use, 2019 to 2034

Figure 139: South Asia and Pacific Market Value Share (%) and BPS Analysis by End-Use, 2024 to 2034

Figure 140: South Asia and Pacific Market Y-o-Y Growth (%) Projections by End-Use, 2024 to 2034

Figure 141: South Asia and Pacific Market Attractiveness by Temperature, 2024 to 2034

Figure 142: South Asia and Pacific Market Attractiveness by Form, 2024 to 2034

Figure 143: South Asia and Pacific Market Attractiveness by End-Use, 2024 to 2034

Figure 144: South Asia and Pacific Market Attractiveness by Country, 2024 to 2034

Figure 145: East Asia Market Value (US$ Million) by Temperature, 2024 to 2034

Figure 146: East Asia Market Value (US$ Million) by Form, 2024 to 2034

Figure 147: East Asia Market Value (US$ Million) by End-Use, 2024 to 2034

Figure 148: East Asia Market Value (US$ Million) by Country, 2024 to 2034

Figure 149: East Asia Market Value (US$ Million) Analysis by Country, 2019 to 2034

Figure 150: East Asia Market Volume (Unit) Analysis by Country, 2019 to 2034

Figure 151: East Asia Market Value Share (%) and BPS Analysis by Country, 2024 to 2034

Figure 152: East Asia Market Y-o-Y Growth (%) Projections by Country, 2024 to 2034

Figure 153: East Asia Market Value (US$ Million) Analysis by Temperature, 2019 to 2034

Figure 154: East Asia Market Volume (Unit) Analysis by Temperature, 2019 to 2034

Figure 155: East Asia Market Value Share (%) and BPS Analysis by Temperature, 2024 to 2034

Figure 156: East Asia Market Y-o-Y Growth (%) Projections by Temperature, 2024 to 2034

Figure 157: East Asia Market Value (US$ Million) Analysis by Form, 2019 to 2034

Figure 158: East Asia Market Volume (Unit) Analysis by Form, 2019 to 2034

Figure 159: East Asia Market Value Share (%) and BPS Analysis by Form, 2024 to 2034

Figure 160: East Asia Market Y-o-Y Growth (%) Projections by Form, 2024 to 2034

Figure 161: East Asia Market Value (US$ Million) Analysis by End-Use, 2019 to 2034

Figure 162: East Asia Market Volume (Unit) Analysis by End-Use, 2019 to 2034

Figure 163: East Asia Market Value Share (%) and BPS Analysis by End-Use, 2024 to 2034

Figure 164: East Asia Market Y-o-Y Growth (%) Projections by End-Use, 2024 to 2034

Figure 165: East Asia Market Attractiveness by Temperature, 2024 to 2034

Figure 166: East Asia Market Attractiveness by Form, 2024 to 2034

Figure 167: East Asia Market Attractiveness by End-Use, 2024 to 2034

Figure 168: East Asia Market Attractiveness by Country, 2024 to 2034

Figure 169: Middle East and Africa Market Value (US$ Million) by Temperature, 2024 to 2034

Figure 170: Middle East and Africa Market Value (US$ Million) by Form, 2024 to 2034

Figure 171: Middle East and Africa Market Value (US$ Million) by End-Use, 2024 to 2034

Figure 172: Middle East and Africa Market Value (US$ Million) by Country, 2024 to 2034

Figure 173: Middle East and Africa Market Value (US$ Million) Analysis by Country, 2019 to 2034

Figure 174: Middle East and Africa Market Volume (Unit) Analysis by Country, 2019 to 2034

Figure 175: Middle East and Africa Market Value Share (%) and BPS Analysis by Country, 2024 to 2034

Figure 176: Middle East and Africa Market Y-o-Y Growth (%) Projections by Country, 2024 to 2034

Figure 177: Middle East and Africa Market Value (US$ Million) Analysis by Temperature, 2019 to 2034

Figure 178: Middle East and Africa Market Volume (Unit) Analysis by Temperature, 2019 to 2034

Figure 179: Middle East and Africa Market Value Share (%) and BPS Analysis by Temperature, 2024 to 2034

Figure 180: Middle East and Africa Market Y-o-Y Growth (%) Projections by Temperature, 2024 to 2034

Figure 181: Middle East and Africa Market Value (US$ Million) Analysis by Form, 2019 to 2034

Figure 182: Middle East and Africa Market Volume (Unit) Analysis by Form, 2019 to 2034

Figure 183: Middle East and Africa Market Value Share (%) and BPS Analysis by Form, 2024 to 2034

Figure 184: Middle East and Africa Market Y-o-Y Growth (%) Projections by Form, 2024 to 2034

Figure 185: Middle East and Africa Market Value (US$ Million) Analysis by End-Use, 2019 to 2034

Figure 186: Middle East and Africa Market Volume (Unit) Analysis by End-Use, 2019 to 2034

Figure 187: Middle East and Africa Market Value Share (%) and BPS Analysis by End-Use, 2024 to 2034

Figure 188: Middle East and Africa Market Y-o-Y Growth (%) Projections by End-Use, 2024 to 2034

Figure 189: Middle East and Africa Market Attractiveness by Temperature, 2024 to 2034

Figure 190: Middle East and Africa Market Attractiveness by Form, 2024 to 2034

Figure 191: Middle East and Africa Market Attractiveness by End-Use, 2024 to 2034

Figure 192: Middle East and Africa Market Attractiveness by Country, 2024 to 2034

Recommendations

Chemicals & Materials

Calcium Sulfate Market

Published : March 2023

Chemicals & Materials

Calcium Ammonium Nitrate Market

Published : June 2022

Explore Chemicals & Materials Insights

View Reports

Calcium Silicate Insulation Market