Calcium Hydrogen Sulphite Market Size and Share Forecast Outlook 2025 to 2035

The Calcium Hydrogen Sulphite Market is estimated to be valued at USD 995.2 million in 2025 and is projected to reach USD 1445.1 million by 2035, registering a compound annual growth rate (CAGR) of 3.8% over the forecast period.
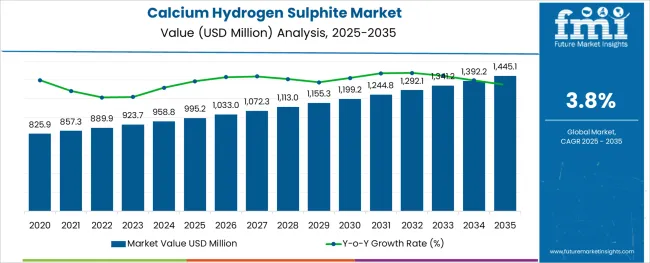
Quick Stats for Calcium Hydrogen Sulphite Market

  • Market Industry Value (2025): USD 995.2 million
  • Market Forecast Value (2035): USD 1445.1 million
  • Market Forecast CAGR: 3.8%
  • Leading Segment in 2025: Technical Grade (63.2%)
  • Key Growth Region: North America, Asia-Pacific, Europe
  • Top Key Players: BASF SE, Triveni Interchem Pvt. Ltd., Hangzhou Dayang Chemical Industry Limited Company, Henan Coreychem co., LTD, Haihang Industry Co., Ltd., Angene International Limited, A & Z FOOD ADDITIVES CO.

Calcium Hydrogen Sulphite Market

Rationale for Segmental Growth in the Alginic Acid Market

Market Overview

The alginic acid market is undergoing consistent growth, propelled by rising demand from food processing, pharmaceutical formulations, and cosmetic applications. A growing focus on natural and sustainable ingredients in manufacturing processes has positioned alginic acid as a preferred biopolymer across industries.

The market is further supported by its diverse functional benefits, including water retention, gelling, and stabilizing properties, which make it indispensable in high-performance formulations. Increased regulatory acceptance of alginates as safe additives and the push towards cleaner labeling in food and personal care products have reinforced their adoption.

Ongoing innovation in extraction technologies and the utilization of algae as a renewable resource are paving the way for cost-effective production and expanded applications, ensuring sustained market expansion in the coming years.

Segmental Analysis

The market is segmented by Grade and Application and region. By Grade, the market is divided into Technical Grade and Food Grade. In terms of Application, the market is classified into Food & Beverages, Paper & Pulp, Wastewater, and Others. Regionally, the market is classified into North America, Latin America, Western Europe, Eastern Europe, Balkan & Baltic Countries, Russia & Belarus, Central Asia, East Asia, South Asia & Pacific, and the Middle East & Africa.

Insights into the Sodium Alginate Salts Segment

When segmented by salts, sodium alginate is expected to command 27.5% of the market revenue in 2025, marking it as the leading subsegment in this category. This leadership has been driven by its superior solubility, ease of incorporation into formulations, and versatility in a wide range of applications.

Its ability to form stable gels and maintain viscosity under varying conditions has made it highly sought after in both food and pharmaceutical sectors. Manufacturers have prioritized sodium alginate due to its consistent performance, cost-effectiveness, and regulatory acceptance, which have collectively strengthened its position.

The segment’s prominence has also been enhanced by its adaptability to evolving consumer preferences for plant-derived and sustainable ingredients, reinforcing its market share.

Insights into the Food Industry End User Industry Segment

Segmented by end user industry, the food industry is projected to hold 33.0% of the market revenue in 2025, positioning it as the most prominent sector. This dominance has been shaped by the industry’s increasing reliance on alginic acid and its derivatives to deliver desirable textures, stabilize emulsions, and improve shelf life of processed foods.

As consumer demand for clean label and natural additives has intensified, the food sector has responded by integrating alginates into bakery, dairy, and confectionery products. Enhanced production efficiency and compliance with food safety standards have further encouraged widespread use.

The segment’s leadership has also been supported by product differentiation strategies where alginates contribute to premium quality and innovation, securing their role in modern food formulations.

Market Dynamics

Affordable pricing of calcium hydrogen sulphite drives the consumption from end-use markets

The key factors that drive the calcium hydrogen sulphite market are its low price and high demand from the end use industries. When compared to alternatives, calcium hydrogen sulphite is more affordable, which is increasing the global consumption from the market.

The global calcium hydrogen sulphite market is being driven by customers' growing demand for ready-to-eat food and producers' management of the crucial component affecting the shelf life of the food. Calcium hydrogen sulphite is recognized as safe by independent food authorities in several nations, which enables the producers of calcium hydrogen sulphite to seize possibilities and increase their production capacity.

Additionally, the market is being driven by calcium hydrogen sulphite's multi-functional properties, such as its ability to prevent oxidative rancidity and other oxidative reactions in foods like cereals, limit enzymatic browning reactions stabilizes colour, and effectively inactivate microbiological conditions.

Government regulations on usage of calcium hydrogen sulphite are likely to affect the market growth

Despite of these market drivers, the global calcium hydrogen sulphide market is subjected to some restraints that may have a negative impact on the market. For instance, several independent agencies have put restrictions on the usage of calcium hydrogen sulphite.

The use of calcium hydrogen sulphites in liquors makes it difficult to recover and restricts its usage in industrial applications. In view of this Australian and New Zealand governments have banned on the calcium hydrogen sulphite for usage in industrial as well as food applications. Regulations like this limits the calcium hydrogen sulphite market's growth and expansion.

Segment-wise Analysis

What are the wide applications of industrial grade calcium hydrogen sulphide?

The industrial grade calcium hydrogen sulphide is widely used for industrial applications. The textile, pulp & paper, and water treatment industries use industrial-grade calcium hydrogen sulphite. It neutralizes chlorine and is employed as a disinfectant in the water treatment process.

Similar to this, pulp and paper and the textile sectors each employ industrial-grade products as bleaching agents. In the pulp and paper production process, calcium hydrogen sulphite is introduced to the digester along with wood pulp dissolving cellulose, pulp components, including lignin, for later use in the creation of paper.

How Food & Beverage Industry is driving the consumption of Calcium Hydrogen Sulphide?

As the food and beverage industry grows, it is anticipated that food-grade calcium hydrogen sulphite will hold a significant portion of the market over the projection period. Food preservative demand is being driven by rising demand for ready-to-eat meals.

Calcium hydrogen sulphide, being a preferred choice for food preservatives, is used in large quantities for packaged food products. However, the food industry is a regulated one, and thus, the calcium hydrogen sulphide.

There are some usage restrictions for calcium hydrogen sulphide bounded by its maximum allowable limit in food materials. Each country has a different maximum allowed limit. Although, due to modernization in the food & beverage industry, the requirement for food preservatives is growing year by year; thereby driving the consumption of calcium hydrogen sulphide.
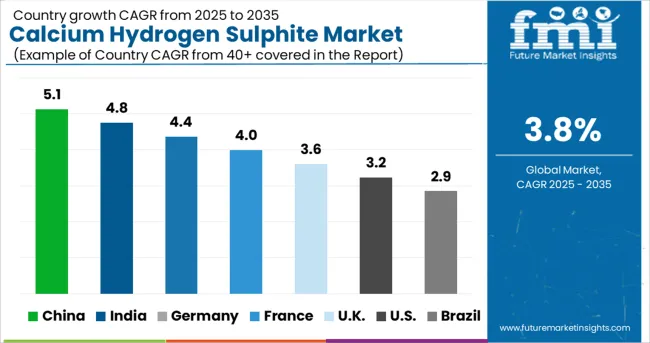
Region-wise Analysis

Calcium Hydrogen Sulphite Market Cagr Analysis By Country

Why has Asia emerged as a prime market for Calcium Hydrogen Sulphite?

Asia Pacific is seeing a significant growth in the end-use industries of calcium hydrogen sulphide. Rising urbanization and industrial growth in the region has driven the demand for water treatment as well as food & beverage industry. This growth brings the increase in consumption of calcium hydrogen sulphide for their wide scope of applications.

Abundant availability of raw materials and economical production of calcium hydrogen sulphide is expected to boost the market in forecast period. Due to this, Asia Pacific is expected to experience faster CAGR growth than the rest of the world over the forecast period for the worldwide calcium hydrogen sulphite.
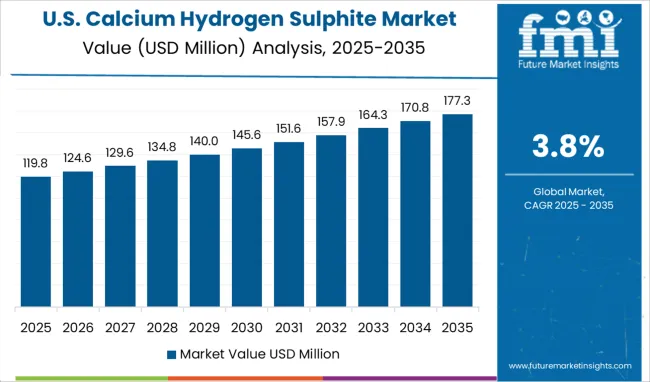
How Calcium Hydrogen Sulphite Market will grow in North America & Europe?

Calcium Hydrogen Sulphite Market Country Value Analysis

Europe and North America are predicted to come after Asia Pacific as a result of the strict rules governing the food business in these two regions. The food and beverage sector in Europe is fiercely competitive and prioritizes products that are of the highest quality, are safe, and are governed by strict laws.

In North America, there is a sizable, intricate, and highly regulated food sector. Due to this, the prime end-user calcium hydrogen sulphide are seen in the industrial applications of calcium hydrogen sulphide rather than food preservatives. The market for calcium hydrogen sulphide will prominently be driven by growth of the water treatment and paper & pulp industry in the region.
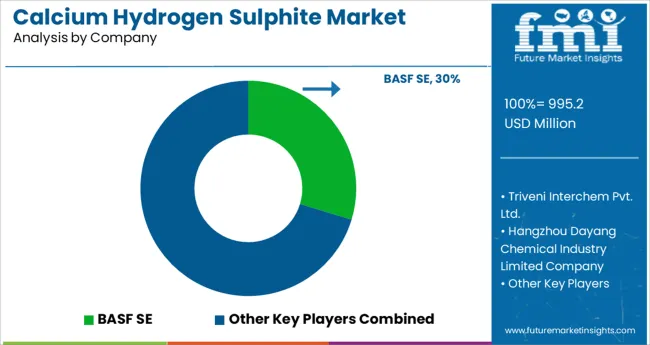
Market Competition

Calcium Hydrogen Sulphite Market Analysis By Company

Prominent players operating in the Global Calcium Hydrogen Sulphite market include BASF SE, Triveni Interchem Pvt. Ltd., Hangzhou Dayang Chemical Industry Limited Company, Henan Coreychem co., LTD, Haihang Industry Co., Ltd., Angene International Limited, and others.

The market of calcium hydrogen sulphite is mature with key manufacturers and new entrants would have to seek for new applications and target to the emerging markets of the calcium hydrogen sulphite.

The market is currently in a state of stagnation, with no key activities such as expansions, acquisitions, or collaborations observed. The market has enormous potential that has yet to be realized. Furthermore, traces in the product's research and development have been discovered for the exploration of new application areas. The results, however, have yet to be discovered.

Scope of the Report

Attribute Details
Growth Rate CAGR of 3.9% from 2025 to 2035
Base Year for Estimation 2024
Historical Data 2020 to 2024
Forecast Period 2025 to 2035
Quantitative Units Revenue in USD Million, Volume in Tons and CAGR from 2025 to 2035
Report Coverage Revenue Forecast, Volume Forecast, Company Ranking, Competitive Landscape, Growth Factors, Trends and Pricing Analysis
Segments Covered Grade, Application, Region
Regions Covered North America; Latin America; Europe; East Asia; South Asia & Pacific; Middle East and Africa
Key Countries Covered USA, Canada, Mexico, Brazil, Germany, UK, France, Italy, Spain, Russia, China, Japan, India, ASEAN, GCC Countries, Australia, Turkey, South Africa
Key Companies Profiled BASF SE; Triveni Interchem Pvt. Ltd.; Hangzhou Dayang Chemical Industry Limited Company; Henan Coreychem co., LTD; Haihang Industry Co., Ltd.; Angene International Limited; A & Z FOOD ADDITIVES CO.
Customization & Pricing Available upon Request

Key Segments Profiled in the Calcium Hydrogen Sulphite Market Report Calcium Hydrogen Sulphite Market

By Grade, Calcium Hydrogen Sulphite Market is segmented as:

  • Technical Grade
  • Food Grade

By Application, Calcium Hydrogen Sulphite Market is segmented as:

  • Food & Beverages
    • Meat
    • Dairy
    • Dried Foods
    • Fruits & Vegetables
    • Others
  • Paper & Pulp
  • Wastewater
  • Others

By Region, Calcium Hydrogen Sulphite Market is segmented as:

  • North America
  • Latin America
  • Europe
  • South Asia & Pacific
  • East Asia
  • Middle East & Africa

Table of Content

  1. Executive Summary
    • Global Market Outlook
    • Demand to side Trends
    • Supply to side Trends
    • Technology Roadmap Analysis
    • Analysis and Recommendations
  2. Market Overview
    • Market Coverage / Taxonomy
    • Market Definition / Scope / Limitations
  3. Market Background
    • Market Dynamics
      • Drivers
      • Restraints
      • Opportunity
      • Trends
    • Scenario Forecast
      • Demand in Optimistic Scenario
      • Demand in Likely Scenario
      • Demand in Conservative Scenario
    • Opportunity Map Analysis
    • Product Life Cycle Analysis
    • Supply Chain Analysis
    • Investment Feasibility Matrix
    • Value Chain Analysis
    • PESTLE and Porter’s Analysis
    • Regulatory Landscape
    • Regional Parent Market Outlook
    • Production and Consumption Statistics
    • Import and Export Statistics
  4. Global Market Analysis 2020 to 2024 and Forecast, 2025 to 2035
    • Historical Market Size Value (USD Million) Analysis, 2020 to 2024
    • Current and Future Market Size Value (USD Million) Projections, 2025 to 2035
      • Y to o to Y Growth Trend Analysis
      • Absolute $ Opportunity Analysis
  5. Global Market Pricing Analysis 2020 to 2024 and Forecast 2025 to 2035
  6. Global Market Analysis 2020 to 2024 and Forecast 2025 to 2035, By Product Type
    • Introduction / Key Findings
    • Historical Market Size Value (USD Million) Analysis By Product Type , 2020 to 2024
    • Current and Future Market Size Value (USD Million) Analysis and Forecast By Product Type , 2025 to 2035
      • Circular Vibrating Screens
      • Linear Vibrating Screens
      • Elliptical Vibrating Screens
      • Feeder
    • Y to o to Y Growth Trend Analysis By Product Type , 2020 to 2024
    • Absolute $ Opportunity Analysis By Product Type , 2025 to 2035
  7. Global Market Analysis 2020 to 2024 and Forecast 2025 to 2035, By End Use
    • Introduction / Key Findings
    • Historical Market Size Value (USD Million) Analysis By End Use, 2020 to 2024
    • Current and Future Market Size Value (USD Million) Analysis and Forecast By End Use, 2025 to 2035
      • Mining
      • Construction
      • Recycling
      • Others
    • Y to o to Y Growth Trend Analysis By End Use, 2020 to 2024
    • Absolute $ Opportunity Analysis By End Use, 2025 to 2035
  8. Global Market Analysis 2020 to 2024 and Forecast 2025 to 2035, By Region
    • Introduction
    • Historical Market Size Value (USD Million) Analysis By Region, 2020 to 2024
    • Current Market Size Value (USD Million) Analysis and Forecast By Region, 2025 to 2035
      • North America
      • Latin America
      • Western Europe
      • Eastern Europe
      • East Asia
      • South Asia and Pacific
      • Middle East & Africa
    • Market Attractiveness Analysis By Region
  9. North America Market Analysis 2020 to 2024 and Forecast 2025 to 2035, By Country
    • Historical Market Size Value (USD Million) Trend Analysis By Market Taxonomy, 2020 to 2024
    • Market Size Value (USD Million) Forecast By Market Taxonomy, 2025 to 2035
      • By Country
        • USA
        • Canada
        • Mexico
      • By Product Type
      • By End Use
    • Market Attractiveness Analysis
      • By Country
      • By Product Type
      • By End Use
    • Key Takeaways
  10. Latin America Market Analysis 2020 to 2024 and Forecast 2025 to 2035, By Country
    • Historical Market Size Value (USD Million) Trend Analysis By Market Taxonomy, 2020 to 2024
    • Market Size Value (USD Million) Forecast By Market Taxonomy, 2025 to 2035
      • By Country
        • Brazil
        • Chile
        • Rest of Latin America
      • By Product Type
      • By End Use
    • Market Attractiveness Analysis
      • By Country
      • By Product Type
      • By End Use
    • Key Takeaways
  11. Western Europe Market Analysis 2020 to 2024 and Forecast 2025 to 2035, By Country
    • Historical Market Size Value (USD Million) Trend Analysis By Market Taxonomy, 2020 to 2024
    • Market Size Value (USD Million) Forecast By Market Taxonomy, 2025 to 2035
      • By Country
        • Germany
        • UK
        • Italy
        • Spain
        • France
        • Nordic
        • BENELUX
        • Rest of Western Europe
      • By Product Type
      • By End Use
    • Market Attractiveness Analysis
      • By Country
      • By Product Type
      • By End Use
    • Key Takeaways
  12. Eastern Europe Market Analysis 2020 to 2024 and Forecast 2025 to 2035, By Country
    • Historical Market Size Value (USD Million) Trend Analysis By Market Taxonomy, 2020 to 2024
    • Market Size Value (USD Million) Forecast By Market Taxonomy, 2025 to 2035
      • By Country
        • Russia
        • Poland
        • Hungary
        • Balkan & Baltic
        • Rest of Eastern Europe
      • By Product Type
      • By End Use
    • Market Attractiveness Analysis
      • By Country
      • By Product Type
      • By End Use
    • Key Takeaways
  13. East Asia Market Analysis 2020 to 2024 and Forecast 2025 to 2035, By Country
    • Historical Market Size Value (USD Million) Trend Analysis By Market Taxonomy, 2020 to 2024
    • Market Size Value (USD Million) Forecast By Market Taxonomy, 2025 to 2035
      • By Country
        • China
        • Japan
        • South Korea
      • By Product Type
      • By End Use
    • Market Attractiveness Analysis
      • By Country
      • By Product Type
      • By End Use
    • Key Takeaways
  14. South Asia and Pacific Market Analysis 2020 to 2024 and Forecast 2025 to 2035, By Country
    • Historical Market Size Value (USD Million) Trend Analysis By Market Taxonomy, 2020 to 2024
    • Market Size Value (USD Million) Forecast By Market Taxonomy, 2025 to 2035
      • By Country
        • India
        • ASEAN
        • Australia & New Zealand
        • Rest of South Asia and Pacific
      • By Product Type
      • By End Use
    • Market Attractiveness Analysis
      • By Country
      • By Product Type
      • By End Use
    • Key Takeaways
  15. Middle East & Africa Market Analysis 2020 to 2024 and Forecast 2025 to 2035, By Country
    • Historical Market Size Value (USD Million) Trend Analysis By Market Taxonomy, 2020 to 2024
    • Market Size Value (USD Million) Forecast By Market Taxonomy, 2025 to 2035
      • By Country
        • Kingdom of Saudi Arabia
        • Other GCC Countries
        • Turkiye
        • South Africa
        • Other African Union
        • Rest of Middle East & Africa
      • By Product Type
      • By End Use
    • Market Attractiveness Analysis
      • By Country
      • By Product Type
      • By End Use
    • Key Takeaways
  16. Key Countries Market Analysis
    • USA
      • Pricing Analysis
      • Market Share Analysis, 2024
        • By Product Type
        • By End Use
    • Canada
      • Pricing Analysis
      • Market Share Analysis, 2024
        • By Product Type
        • By End Use
    • Mexico
      • Pricing Analysis
      • Market Share Analysis, 2024
        • By Product Type
        • By End Use
    • Brazil
      • Pricing Analysis
      • Market Share Analysis, 2024
        • By Product Type
        • By End Use
    • Chile
      • Pricing Analysis
      • Market Share Analysis, 2024
        • By Product Type
        • By End Use
    • Germany
      • Pricing Analysis
      • Market Share Analysis, 2024
        • By Product Type
        • By End Use
    • UK
      • Pricing Analysis
      • Market Share Analysis, 2024
        • By Product Type
        • By End Use
    • Italy
      • Pricing Analysis
      • Market Share Analysis, 2024
        • By Product Type
        • By End Use
    • Spain
      • Pricing Analysis
      • Market Share Analysis, 2024
        • By Product Type
        • By End Use
    • France
      • Pricing Analysis
      • Market Share Analysis, 2024
        • By Product Type
        • By End Use
    • India
      • Pricing Analysis
      • Market Share Analysis, 2024
        • By Product Type
        • By End Use
    • ASEAN
      • Pricing Analysis
      • Market Share Analysis, 2024
        • By Product Type
        • By End Use
    • Australia & New Zealand
      • Pricing Analysis
      • Market Share Analysis, 2024
        • By Product Type
        • By End Use
    • China
      • Pricing Analysis
      • Market Share Analysis, 2024
        • By Product Type
        • By End Use
    • Japan
      • Pricing Analysis
      • Market Share Analysis, 2024
        • By Product Type
        • By End Use
    • South Korea
      • Pricing Analysis
      • Market Share Analysis, 2024
        • By Product Type
        • By End Use
    • Russia
      • Pricing Analysis
      • Market Share Analysis, 2024
        • By Product Type
        • By End Use
    • Poland
      • Pricing Analysis
      • Market Share Analysis, 2024
        • By Product Type
        • By End Use
    • Hungary
      • Pricing Analysis
      • Market Share Analysis, 2024
        • By Product Type
        • By End Use
    • Kingdom of Saudi Arabia
      • Pricing Analysis
      • Market Share Analysis, 2024
        • By Product Type
        • By End Use
    • Turkiye
      • Pricing Analysis
      • Market Share Analysis, 2024
        • By Product Type
        • By End Use
    • South Africa
      • Pricing Analysis
      • Market Share Analysis, 2024
        • By Product Type
        • By End Use
  17. Market Structure Analysis
    • Competition Dashboard
    • Competition Benchmarking
    • Market Share Analysis of Top Players
      • By Regional
      • By Product Type
      • By End Use
  18. Competition Analysis
    • Competition Deep Dive
      • Terex Corporation
        • Overview
        • Product Portfolio
        • Profitability by Market Segments (Product/Age /Sales Channel/Region)
        • Sales Footprint
        • Strategy Overview
          • Marketing Strategy
          • Product Strategy
          • Channel Strategy
      • Haulotte Group
      • Oshkosh Corporation
      • Linamar Corporation
      • Tadano Ltd
      • Aichi Corporation
      • MEC Aerial Work Platforms
      • Palfinger AG
      • Hunan Sinoboom Heavy Industries Co. Ltd
      • Zhejiang Dingli Machinery Co. Ltd
  19. Assumptions & Acronyms Used
  20. Research Methodology

List of Tables

  • Table 1: Global Market Value (USD Million) Forecast by Region, 2020 to 2035
  • Table 2: Global Market Value (USD Million) Forecast by Product Type , 2020 to 2035
  • Table 3: Global Market Value (USD Million) Forecast by End Use, 2020 to 2035
  • Table 4: North America Market Value (USD Million) Forecast by Country, 2020 to 2035
  • Table 5: North America Market Value (USD Million) Forecast by Product Type , 2020 to 2035
  • Table 6: North America Market Value (USD Million) Forecast by End Use, 2020 to 2035
  • Table 7: Latin America Market Value (USD Million) Forecast by Country, 2020 to 2035
  • Table 8: Latin America Market Value (USD Million) Forecast by Product Type , 2020 to 2035
  • Table 9: Latin America Market Value (USD Million) Forecast by End Use, 2020 to 2035
  • Table 10: Western Europe Market Value (USD Million) Forecast by Country, 2020 to 2035
  • Table 11: Western Europe Market Value (USD Million) Forecast by Product Type , 2020 to 2035
  • Table 12: Western Europe Market Value (USD Million) Forecast by End Use, 2020 to 2035
  • Table 13: Eastern Europe Market Value (USD Million) Forecast by Country, 2020 to 2035
  • Table 14: Eastern Europe Market Value (USD Million) Forecast by Product Type , 2020 to 2035
  • Table 15: Eastern Europe Market Value (USD Million) Forecast by End Use, 2020 to 2035
  • Table 16: East Asia Market Value (USD Million) Forecast by Country, 2020 to 2035
  • Table 17: East Asia Market Value (USD Million) Forecast by Product Type , 2020 to 2035
  • Table 18: East Asia Market Value (USD Million) Forecast by End Use, 2020 to 2035
  • Table 19: South Asia and Pacific Market Value (USD Million) Forecast by Country, 2020 to 2035
  • Table 20: South Asia and Pacific Market Value (USD Million) Forecast by Product Type , 2020 to 2035
  • Table 21: South Asia and Pacific Market Value (USD Million) Forecast by End Use, 2020 to 2035
  • Table 22: Middle East & Africa Market Value (USD Million) Forecast by Country, 2020 to 2035
  • Table 23: Middle East & Africa Market Value (USD Million) Forecast by Product Type , 2020 to 2035
  • Table 24: Middle East & Africa Market Value (USD Million) Forecast by End Use, 2020 to 2035

List of Figures

  • Figure 1: Global Market Pricing Analysis
  • Figure 2: Global Market Value (USD Million) Forecast 2020-2035
  • Figure 3: Global Market Value Share and BPS Analysis by Product Type , 2025 and 2035
  • Figure 4: Global Market Y to o to Y Growth Comparison by Product Type , 2025-2035
  • Figure 5: Global Market Attractiveness Analysis by Product Type
  • Figure 6: Global Market Value Share and BPS Analysis by End Use, 2025 and 2035
  • Figure 7: Global Market Y to o to Y Growth Comparison by End Use, 2025-2035
  • Figure 8: Global Market Attractiveness Analysis by End Use
  • Figure 9: Global Market Value (USD Million) Share and BPS Analysis by Region, 2025 and 2035
  • Figure 10: Global Market Y to o to Y Growth Comparison by Region, 2025-2035
  • Figure 11: Global Market Attractiveness Analysis by Region
  • Figure 12: North America Market Incremental Dollar Opportunity, 2025-2035
  • Figure 13: Latin America Market Incremental Dollar Opportunity, 2025-2035
  • Figure 14: Western Europe Market Incremental Dollar Opportunity, 2025-2035
  • Figure 15: Eastern Europe Market Incremental Dollar Opportunity, 2025-2035
  • Figure 16: East Asia Market Incremental Dollar Opportunity, 2025-2035
  • Figure 17: South Asia and Pacific Market Incremental Dollar Opportunity, 2025-2035
  • Figure 18: Middle East & Africa Market Incremental Dollar Opportunity, 2025-2035
  • Figure 19: North America Market Value Share and BPS Analysis by Country, 2025 and 2035
  • Figure 20: North America Market Value Share and BPS Analysis by Product Type , 2025 and 2035
  • Figure 21: North America Market Y to o to Y Growth Comparison by Product Type , 2025-2035
  • Figure 22: North America Market Attractiveness Analysis by Product Type
  • Figure 23: North America Market Value Share and BPS Analysis by End Use, 2025 and 2035
  • Figure 24: North America Market Y to o to Y Growth Comparison by End Use, 2025-2035
  • Figure 25: North America Market Attractiveness Analysis by End Use
  • Figure 26: Latin America Market Value Share and BPS Analysis by Country, 2025 and 2035
  • Figure 27: Latin America Market Value Share and BPS Analysis by Product Type , 2025 and 2035
  • Figure 28: Latin America Market Y to o to Y Growth Comparison by Product Type , 2025-2035
  • Figure 29: Latin America Market Attractiveness Analysis by Product Type
  • Figure 30: Latin America Market Value Share and BPS Analysis by End Use, 2025 and 2035
  • Figure 31: Latin America Market Y to o to Y Growth Comparison by End Use, 2025-2035
  • Figure 32: Latin America Market Attractiveness Analysis by End Use
  • Figure 33: Western Europe Market Value Share and BPS Analysis by Country, 2025 and 2035
  • Figure 34: Western Europe Market Value Share and BPS Analysis by Product Type , 2025 and 2035
  • Figure 35: Western Europe Market Y to o to Y Growth Comparison by Product Type , 2025-2035
  • Figure 36: Western Europe Market Attractiveness Analysis by Product Type
  • Figure 37: Western Europe Market Value Share and BPS Analysis by End Use, 2025 and 2035
  • Figure 38: Western Europe Market Y to o to Y Growth Comparison by End Use, 2025-2035
  • Figure 39: Western Europe Market Attractiveness Analysis by End Use
  • Figure 40: Eastern Europe Market Value Share and BPS Analysis by Country, 2025 and 2035
  • Figure 41: Eastern Europe Market Value Share and BPS Analysis by Product Type , 2025 and 2035
  • Figure 42: Eastern Europe Market Y to o to Y Growth Comparison by Product Type , 2025-2035
  • Figure 43: Eastern Europe Market Attractiveness Analysis by Product Type
  • Figure 44: Eastern Europe Market Value Share and BPS Analysis by End Use, 2025 and 2035
  • Figure 45: Eastern Europe Market Y to o to Y Growth Comparison by End Use, 2025-2035
  • Figure 46: Eastern Europe Market Attractiveness Analysis by End Use
  • Figure 47: East Asia Market Value Share and BPS Analysis by Country, 2025 and 2035
  • Figure 48: East Asia Market Value Share and BPS Analysis by Product Type , 2025 and 2035
  • Figure 49: East Asia Market Y to o to Y Growth Comparison by Product Type , 2025-2035
  • Figure 50: East Asia Market Attractiveness Analysis by Product Type
  • Figure 51: East Asia Market Value Share and BPS Analysis by End Use, 2025 and 2035
  • Figure 52: East Asia Market Y to o to Y Growth Comparison by End Use, 2025-2035
  • Figure 53: East Asia Market Attractiveness Analysis by End Use
  • Figure 54: South Asia and Pacific Market Value Share and BPS Analysis by Country, 2025 and 2035
  • Figure 55: South Asia and Pacific Market Value Share and BPS Analysis by Product Type , 2025 and 2035
  • Figure 56: South Asia and Pacific Market Y to o to Y Growth Comparison by Product Type , 2025-2035
  • Figure 57: South Asia and Pacific Market Attractiveness Analysis by Product Type
  • Figure 58: South Asia and Pacific Market Value Share and BPS Analysis by End Use, 2025 and 2035
  • Figure 59: South Asia and Pacific Market Y to o to Y Growth Comparison by End Use, 2025-2035
  • Figure 60: South Asia and Pacific Market Attractiveness Analysis by End Use
  • Figure 61: Middle East & Africa Market Value Share and BPS Analysis by Country, 2025 and 2035
  • Figure 62: Middle East & Africa Market Value Share and BPS Analysis by Product Type , 2025 and 2035
  • Figure 63: Middle East & Africa Market Y to o to Y Growth Comparison by Product Type , 2025-2035
  • Figure 64: Middle East & Africa Market Attractiveness Analysis by Product Type
  • Figure 65: Middle East & Africa Market Value Share and BPS Analysis by End Use, 2025 and 2035
  • Figure 66: Middle East & Africa Market Y to o to Y Growth Comparison by End Use, 2025-2035
  • Figure 67: Middle East & Africa Market Attractiveness Analysis by End Use
  • Figure 68: Global Market - Tier Structure Analysis
  • Figure 69: Global Market - Company Share Analysis

Frequently Asked Questions

How big is the calcium hydrogen sulphite market in 2025?

The global calcium hydrogen sulphite market is estimated to be valued at USD 995.2 million in 2025.

What will be the market size for the calcium hydrogen sulphite market in 2035?

It is projected to reach USD 1,445.1 million by 2035.

How much will be the CAGR of the calcium hydrogen sulphite market between 2025 and 2035?

The market is expected to grow at a 3.8% CAGR between 2025 and 2035.

What are the key product types in the calcium hydrogen sulphite market?

The key product types are technical grade and food grade.

Which food & beverages segment is expected to dominate the calcium hydrogen sulphite market in 2025?

food & beverages segment is expected to dominate with a 48.5% industry share in 2025.

Explore Similar Insights

Future Market Insights

Calcium Hydrogen Sulphite Market

Chat With MaRIA

Chat With

MaRIA

Hi There, I am MaRIA, Your Market Research Intelligence Assistant. How may I help you?