Hydrogen Storage Tank and Transportation Market Size and Share Forecast Outlook From 2024 to 2034

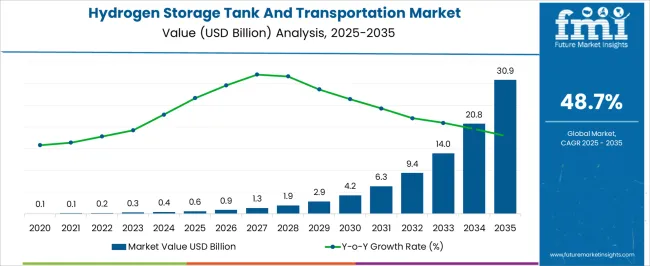
The global hydrogen storage tank and transportation market size is poised for significant growth, attaining USD 392.6 million in 2024. Sales of hydrogen storage tank and transportation is expected to witness a robust CAGR of 48.7% from 2024 to 2034. By 2034, the market revenue for hydrogen storage tank and transportation is anticipated to hit a valuation of USD 20.8 billion.

The demand for hydrogen technology, stimulated by rising investments and regional initiatives to cut emissions and fossil fuel use, is the main parameter fostering the hydrogen storage tank and transportation market.

Attributes Details
Market Value for 2024 USD 392.6 million
Market Value for 2034 USD 20.8 billion
Market CAGR from 2024 to 2034 48.7%

Top Hydrogen Storage and Transportation Market Dynamics and Industry Trends

  • Demand for hydrogen storage tank and transportation infrastructure is fueled by policies that often include incentives and regulations for the use of hydrogen to lower greenhouse gas emissions and encourage renewable energy sources.
  • Investments in storage and transportation infrastructure are being made more advantageous by the growing public recognition of hydrogen as a sustainable energy source. The hydrogen storage tank and transportation industry expanded due to public acceptance and support for hydrogen technology.
  • The need for sustainable and scalable energy storage systems is strengthened by the world's efforts to reduce carbon emissions and switch to renewable energy. Transportation and storage facilities are required for hydrogen, which is essential to this transformation.
  • Efficiency, safety, and cost-effectiveness are all improved by ongoing developments in hydrogen storage tank materials, designs, and deployment techniques. These technological advancements are major factors in the expansion of the hydrogen storage tank and transportation market.
  • Growing investments from governments, corporations, and academic organizations escalate infrastructure development and innovation in the hydrogen sector. This funding spurs the growth of hydrogen storage tanks and the transportation market.

Key Factors Driving Demand for Hydrogen Storage and Transportation Solutions

  • One major setback is the absence of a comprehensive and effective infrastructure for the delivery and storage of hydrogen. This includes a lack of pipelines, appropriate storage facilities, and refueling stations. The expansion of the supporting infrastructure is directly related to the market growth of hydrogen storage tank and transportation.
  • Technologies for transporting and storing hydrogen frequently have significant upfront expenditures. The continued economic sustainability of these systems is problematic, particularly in light of alternative energy sources. Cost reductions through economies of scale and technology breakthroughs are necessary for widespread adoption of hydrogen storage tank and transportation.
  • The lack of uniform laws and regulations for hydrogen storage and transportation inhibits hydrogen storage tank and transportation market growth. Establishing clear rules and industry standards to guarantee safety, promote interoperability, and enable a more stable market environment is imperative.
Attributes Details
Market Value for 2019 USD 46.9 million
Market Value for 2023 USD 259.8 million
Market CAGR from 2019 to 2023 53.4%

Limiting Factors in the Hydrogen Storage and Transportation Market

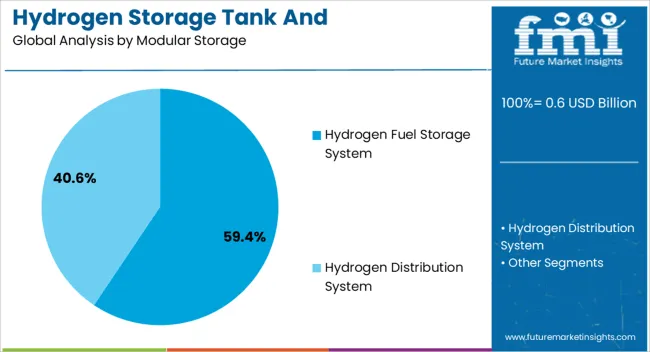
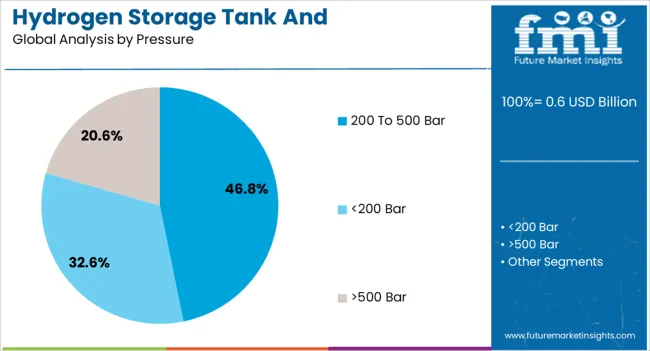
The segmented market analysis of hydrogen storage tank and transportation is included in the following subsection. Based on comprehensive studies, the hydrogen fuel storage system sector is leading the modular storage category, and the <200 bar segment is commanding the pressure category.

Hydrogen Fuel Storage Systems Paves the Way Forward

Attributes Details
Top Modular Storage Hydrogen Fuel Storage System
CAGR % 2019 to 2023 52.9%
CAGR % 2024 to End of Forecast (2034) 48.2%
  • Hydrogen fuel storage systems are essential for organizations that care about the environment and reach emission reduction goals as the market focuses on sustainable practices.
  • The hydrogen fuel storage system segment is an ideal option because of its affordability and simplicity of integration, which optimizes hydrogen storage tank and transportation vendor operational efficiency.
  • The rising demand for scalable and effective storage solutions in the expanding hydrogen economy has caused hydrogen fuel storage systems to dominate hydrogen storage tank and transportation sales.

<200 Bar Segment Leads Hydrogen Storage Tank and Transportation Sales

Attributes Details
Top Pressure <200 Bar
CAGR % 2019 to 2023 52.5%
CAGR % 2024 to End of Forecast (2034) 47.8%
  • The widespread adoption of pressure systems with less than 200 Bar is attributed to their ability to integrate seamlessly with current infrastructure, which benefits enterprises.
  • Options with pressures lower than 200 Bar offer operational flexibility, meeting the needs of a wide range of applications without sacrificing effectiveness.
  • The established presence of <200 Bar systems makes them the industry leader in storage and transportation as the hydrogen sector evolves, making them a sensible option for companies.

Hydrogen Storage and Transportation Industry Analysis by Top Investment Segments

The hydrogen storage tank and transportation market can be observed in the subsequent tables, which focus on the leading economies in South Korea, Japan, China, the United States, and the United Kingdom. A comprehensive evaluation demonstrates that South Korea has enormous market opportunities for hydrogen storage tank and transportation.

South Korea's Ascent as A Leader in Green Hydrogen Storage and Transportation

Country South Korea
HCAGR (2019 to 2023) 61.0%
CAGR (2024 to 2034) 51.1%
  • With significant investments, South Korea is building a strong hydrogen production and storage infrastructure to lead the world.
  • South Korea's hydrogen storage tank and transportation market is expected to reach a worth of USD 1.3 billion by 2034.
  • The burgeoning significance of South Korea in the global hydrogen storage and transportation arena can be attributed to the government's proactive policies and endorsement of hydrogen technologies.
  • Due to its emphasis on using hydrogen as a clean energy source, South Korea is well-positioned to influence the dynamics of hydrogen storage and transportation in the future.

Japan's Hydrogen Horizon Pioneering Green Growth Strategies

Nation Japan
HCAGR (2019 to 2023) 57.8%
CAGR (2024 to 2034) 50.8%
  • The significance of hydrogen is emphasized by Japan's ambitious "Green Growth Strategy," which motivates research and development expenses for effective hydrogen storage and transportation systems.
  • Implementing cutting-edge hydrogen storage and transportation infrastructure is accelerating due to Japan's ambition to become carbon neutral by 2050.
  • By 2034, the demand for hydrogen storage tanks and transportation in Japan is anticipated to be estimated at USD 2.2 billion.
  • The financial incentives and regulatory frameworks implemented by the Japanese government are crucial in influencing the hydrogen storage and transportation business and creating a favorable climate for the industry's expansion.

China's Hydrogen Revolution Accelerates Infrastructure Expansion

Nation China
HCAGR (2019 to 2023) 56.4%
CAGR (2024 to 2034) 50.0%
  • China's energy transformation is aided by introducing hydrogen into the country's energy mix, attracting investments in large-scale hydrogen transportation and storage projects.
  • China's demand for hydrogen storage tanks and transportation is forecast to climb to USD 3.5 billion by 2034.
  • China's emphasis on building a comprehensive hydrogen ecosystem creates opportunities for different hydrogen storage tanks and transportation vendors.
  • China is one of the main nations impacting the global hydrogen storage and transportation scene because of its emphasis on producing green hydrogen and dedication to international cooperation.

Outlook of Hydrogen Storage Tank and Transportation Market in the United Kingdom

Nation United Kingdom
HCAGR (2019 to 2023) 58.2%
CAGR (2024 to 2034) 49.5%
  • The United Kingdom's advantageous location promotes the investigation of various transportation modalities, including pipelines and shipping, to enable the effective distribution of hydrogen.
  • By 2034, the hydrogen storage tank and transportation market in the United Kingdom is likely to be worth USD 831.9 million.
  • The incorporation of hydrogen into the energy system of the United Kingdom is propelling the investigation of innovative storage and conveyance techniques to enable broad implementation.
  • The United Kingdom's dedication to international cooperation for technological sharing impacts global advancements in the hydrogen storage and transportation sector.

Advancing Hydrogen Storage in the United States

Nation United States
HCAGR (2019 to 2023) 54.9%
CAGR (2024 to 2034) 49.1%
  • Hydrogen storage and transportation sales in the United States are largely shaped by state-level initiatives, resulting in diverse rules and infrastructure development.
  • The hydrogen storage tank and transportation market in the United States is scheduled to be about USD 3.7 billion by 2034.
  • The proliferation of hydrogen storage and transportation solutions in the United States is facilitated by the proactive engagement of American automakers in promoting hydrogen-powered vehicles.
  • Innovation in storage and transportation systems is encouraged by the United States government's dedication to advancing hydrogen technology as part of its clean energy program.

Analysis of Top Countries Producing, Formulating, Packaging, Distributing, and Using Hydrogen Storage and Transportation Solutions

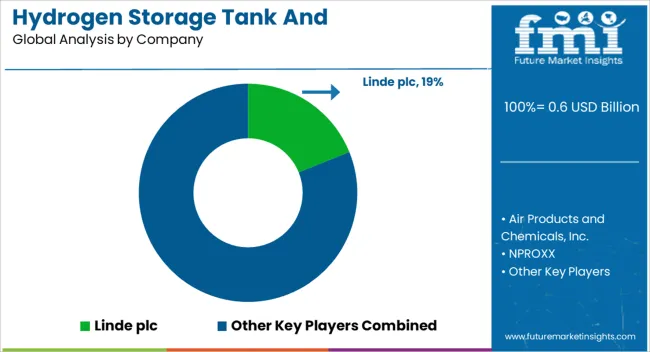
The hydrogen storage tank and transportation vendors are influencing developments and the direction of the business in the fiercely competitive market. Air Liquide, Linde plc, and Chart Industries Inc. are reputable hydrogen storage tank and transportation suppliers that lead the industry in innovation and dependability. The leading hydrogen storage tank and transportation providers are essential to the development and set the standard for innovation.

Companies that contribute to diversifying hydrogen storage and transportation solutions include Worthington Industries, Hexagon Composites ASA, and Luxfer Holdings PLC. These companies offer their special capabilities to the competitive field. The hydrogen storage tank and transportation vendors use their experience to promote sustainable practices and adapt to changing market demands.

The market participants of hydrogen storage tanks and transportation who actively participate and contribute significantly to the development of the industry include Praxair Technology Inc., Quantum Fuel Systems LLC, and VRV S.p.A. The demand for transportation and hydrogen storage tanks is dynamic due to their technological prowess and various options.

The hydrogen storage tank and transportation sector are quite competitive, encouraging ongoing developments as the major businesses manage the opportunities and challenges.

Notable Strides

Company Details
Hexagon Purus A major competitor in the market, Hexagon Purus, announced intentions to expand its hydrogen manufacturing facility in Weeze in April 2023. The project aims to accelerate the company's growth in the energy transition industry by incorporating office and training spaces and a hydrogen refueling center. The three-phase plan will help the corporation reach its clean hydrogen production target and increase production capacity.
NPROXX At the International Trade Fair in Germany in October 2022, NPROXX, a pioneer in high-pressure hydrogen storage technologies, unveiled its most recent developments in hydrogen storage. Refueling hubs, compressed natural gas, and hydrogen-powered cars are some of these creative options. The company has expanded its hydrogen storage portfolio thanks to these product breakthroughs, which help ensure that low-carbon and hydrogen-based technologies are a major part of the future.
Tenaris Tenaris and Nel Hydrogen partnered in November 2020 to offer a hydrogen truck recharging network throughout California. They create hydrogen technology and provide high-pressure solutions for Shell's planned installation of hydrogen storage in Long Beach.
Worthington Industries Van Hool and Worthington Industries partnered in October 2021 to supply cylinders made by Worthington Industries and an onboard fueling system intended for public transportation.

Leading Suppliers of Hydrogen Storage Tanks and Transportation Solutions

  • Linde plc
  • Air Products and Chemicals, Inc.
  • NPROXX
  • Hexagon Purus
  • Worthington Industries
  • Luxfer Holdings PLC
  • McPhy Energy S.A.
  • Chart Industries, Inc.
  • Plug Power Inc.
  • Praxair, Inc. (now part of Linde plc)
  • VRV S.p.A.
  • HBank Technologies Inc.
  • Quantum Fuel Systems LLC (a subsidiary of Ballard Power Systems Inc.)
  • Holtec International
  • Cella Energy Limited

Leading Hydrogen Storage Tank and Transportation Providers by Market Share

  • In-Depth Analysis of Global and Regional Hydrogen Storage Tank and Transportation Market Trends
  • Market Trends Influencing Hydrogen Storage Tank and Transportation Sales
  • Adjacent Study on Hydrogen Storage Tank and Transportation Market, Hydrogen Truck Market, and Automotive Fuel Gauge Sending Unit Market
  • Demand for Hydrogen Storage Tank and Transportation in South Korea
  • Opportunities in the Hydrogen Storage Tank and Transportation Market in Japan
  • Strategies of Major Hydrogen Storage Tank and Transportation Suppliers’ Performance

Image Guided Radiotherapy Market Size and Share Forecast Outlook From 2024 to 2034

By Modular Storage:

  • Hydrogen Fuel Storage System
  • Hydrogen Distribution System

By Pressure:

  • <200 Bar
  • 200 to 500 Bar
  • >500 Bar

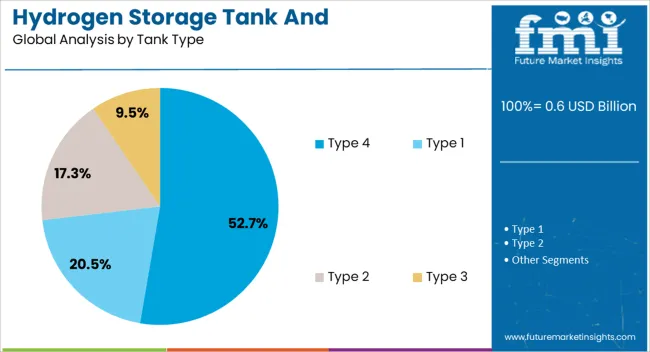
By Tank Type:

  • Type 1
  • Type 2
  • Type 3
  • Type 4

By Application:

  • Vehicles
  • Marine
  • Rail
  • Stationary Storage
  • Trailer for H2 Transportation

By Region:

  • North America
  • Europe
  • Asia Pacific
  • Latin America
  • Middle East and Africa

Table of Content

  • 1. Executive Summary
  • 2. Market Overview
  • 3. Market Background
  • 4. Global Market Analysis 2019 to 2023 and Forecast, 2024 to 2034
  • 5. Global Market Analysis 2019 to 2023 and Forecast 2024 to 2034, By Modular Storage
    • 5.1. Hydrogen Fuel Storage System
    • 5.2. Hydrogen Distribution System
  • 6. Global Market Analysis 2019 to 2023 and Forecast 2024 to 2034, By Pressure
    • 6.1. <200 Bar
    • 6.2. 200 to 500 Bar
    • 6.3. >500 Bar
  • 7. Global Market Analysis 2019 to 2023 and Forecast 2024 to 2034, By Tank Type
    • 7.1. Type 1
    • 7.2. Type 2
    • 7.3. Type 3
    • 7.4. Type 4
  • 8. Global Market Analysis 2019 to 2023 and Forecast 2024 to 2034, By Application
    • 8.1. Vehicles
    • 8.2. Marine
    • 8.3. Rail
    • 8.4. Stationary Storage
    • 8.5. Trailer for H2 Transportation
  • 9. Global Market Analysis 2019 to 2023 and Forecast 2024 to 2034, By Region
    • 9.1. North America
    • 9.2. Latin America
    • 9.3. Western Europe
    • 9.4. Eastern Europe
    • 9.5. South Asia and Pacific
    • 9.6. East Asia
    • 9.7. Middle East and Africa
  • 10. North America Market Analysis 2019 to 2023 and Forecast 2024 to 2034, By Country
  • 11. Latin America Market Analysis 2019 to 2023 and Forecast 2024 to 2034, By Country
  • 12. Western Europe Market Analysis 2019 to 2023 and Forecast 2024 to 2034, By Country
  • 13. Eastern Europe Market Analysis 2019 to 2023 and Forecast 2024 to 2034, By Country
  • 14. South Asia and Pacific Market Analysis 2019 to 2023 and Forecast 2024 to 2034, By Country
  • 15. East Asia Market Analysis 2019 to 2023 and Forecast 2024 to 2034, By Country
  • 16. Middle East and Africa Market Analysis 2019 to 2023 and Forecast 2024 to 2034, By Country
  • 17. Key Countries Market Analysis
  • 18. Market Structure Analysis
  • 19. Competition Analysis
    • 19.1. AMS Composite Cylinders
    • 19.2. Plastic Omnium
    • 19.3. Worthington Industries
    • 19.4. Hexagon Purus
    • 19.5. NPROXX
    • 19.6. Tenaris
    • 19.7. Weldship Corporation
    • 19.8. Composite Advanced Technologies LLC.
    • 19.9. Luxfer Gas Cylinders
    • 19.10. Mahytec
    • 19.11. UMOE Advanced Composites
    • 19.12. Pragma Industries
    • 19.13. Marine Service Noord
  • 20. Assumptions & Acronyms Used
  • 21. Research Methodology

List of Tables

Table 1: Global Market Value (US$ Million) Forecast by Region, 2019 to 2034

Table 2: Global Market Volume (Units) Forecast by Region, 2019 to 2034

Table 3: Global Market Value (US$ Million) Forecast by Modular Storage, 2019 to 2034

Table 4: Global Market Volume (Units) Forecast by Modular Storage, 2019 to 2034

Table 5: Global Market Value (US$ Million) Forecast by Pressure, 2019 to 2034

Table 6: Global Market Volume (Units) Forecast by Pressure, 2019 to 2034

Table 7: Global Market Value (US$ Million) Forecast by Tank Type, 2019 to 2034

Table 8: Global Market Volume (Units) Forecast by Tank Type, 2019 to 2034

Table 9: Global Market Value (US$ Million) Forecast by Application, 2019 to 2034

Table 10: Global Market Volume (Units) Forecast by Application, 2019 to 2034

Table 11: North America Market Value (US$ Million) Forecast by Country, 2019 to 2034

Table 12: North America Market Volume (Units) Forecast by Country, 2019 to 2034

Table 13: North America Market Value (US$ Million) Forecast by Modular Storage, 2019 to 2034

Table 14: North America Market Volume (Units) Forecast by Modular Storage, 2019 to 2034

Table 15: North America Market Value (US$ Million) Forecast by Pressure, 2019 to 2034

Table 16: North America Market Volume (Units) Forecast by Pressure, 2019 to 2034

Table 17: North America Market Value (US$ Million) Forecast by Tank Type, 2019 to 2034

Table 18: North America Market Volume (Units) Forecast by Tank Type, 2019 to 2034

Table 19: North America Market Value (US$ Million) Forecast by Application, 2019 to 2034

Table 20: North America Market Volume (Units) Forecast by Application, 2019 to 2034

Table 21: Latin America Market Value (US$ Million) Forecast by Country, 2019 to 2034

Table 22: Latin America Market Volume (Units) Forecast by Country, 2019 to 2034

Table 23: Latin America Market Value (US$ Million) Forecast by Modular Storage, 2019 to 2034

Table 24: Latin America Market Volume (Units) Forecast by Modular Storage, 2019 to 2034

Table 25: Latin America Market Value (US$ Million) Forecast by Pressure, 2019 to 2034

Table 26: Latin America Market Volume (Units) Forecast by Pressure, 2019 to 2034

Table 27: Latin America Market Value (US$ Million) Forecast by Tank Type, 2019 to 2034

Table 28: Latin America Market Volume (Units) Forecast by Tank Type, 2019 to 2034

Table 29: Latin America Market Value (US$ Million) Forecast by Application, 2019 to 2034

Table 30: Latin America Market Volume (Units) Forecast by Application, 2019 to 2034

Table 31: Western Europe Market Value (US$ Million) Forecast by Country, 2019 to 2034

Table 32: Western Europe Market Volume (Units) Forecast by Country, 2019 to 2034

Table 33: Western Europe Market Value (US$ Million) Forecast by Modular Storage, 2019 to 2034

Table 34: Western Europe Market Volume (Units) Forecast by Modular Storage, 2019 to 2034

Table 35: Western Europe Market Value (US$ Million) Forecast by Pressure, 2019 to 2034

Table 36: Western Europe Market Volume (Units) Forecast by Pressure, 2019 to 2034

Table 37: Western Europe Market Value (US$ Million) Forecast by Tank Type, 2019 to 2034

Table 38: Western Europe Market Volume (Units) Forecast by Tank Type, 2019 to 2034

Table 39: Western Europe Market Value (US$ Million) Forecast by Application, 2019 to 2034

Table 40: Western Europe Market Volume (Units) Forecast by Application, 2019 to 2034

Table 41: Eastern Europe Market Value (US$ Million) Forecast by Country, 2019 to 2034

Table 42: Eastern Europe Market Volume (Units) Forecast by Country, 2019 to 2034

Table 43: Eastern Europe Market Value (US$ Million) Forecast by Modular Storage, 2019 to 2034

Table 44: Eastern Europe Market Volume (Units) Forecast by Modular Storage, 2019 to 2034

Table 45: Eastern Europe Market Value (US$ Million) Forecast by Pressure, 2019 to 2034

Table 46: Eastern Europe Market Volume (Units) Forecast by Pressure, 2019 to 2034

Table 47: Eastern Europe Market Value (US$ Million) Forecast by Tank Type, 2019 to 2034

Table 48: Eastern Europe Market Volume (Units) Forecast by Tank Type, 2019 to 2034

Table 49: Eastern Europe Market Value (US$ Million) Forecast by Application, 2019 to 2034

Table 50: Eastern Europe Market Volume (Units) Forecast by Application, 2019 to 2034

Table 51: South Asia and Pacific Market Value (US$ Million) Forecast by Country, 2019 to 2034

Table 52: South Asia and Pacific Market Volume (Units) Forecast by Country, 2019 to 2034

Table 53: South Asia and Pacific Market Value (US$ Million) Forecast by Modular Storage, 2019 to 2034

Table 54: South Asia and Pacific Market Volume (Units) Forecast by Modular Storage, 2019 to 2034

Table 55: South Asia and Pacific Market Value (US$ Million) Forecast by Pressure, 2019 to 2034

Table 56: South Asia and Pacific Market Volume (Units) Forecast by Pressure, 2019 to 2034

Table 57: South Asia and Pacific Market Value (US$ Million) Forecast by Tank Type, 2019 to 2034

Table 58: South Asia and Pacific Market Volume (Units) Forecast by Tank Type, 2019 to 2034

Table 59: South Asia and Pacific Market Value (US$ Million) Forecast by Application, 2019 to 2034

Table 60: South Asia and Pacific Market Volume (Units) Forecast by Application, 2019 to 2034

Table 61: East Asia Market Value (US$ Million) Forecast by Country, 2019 to 2034

Table 62: East Asia Market Volume (Units) Forecast by Country, 2019 to 2034

Table 63: East Asia Market Value (US$ Million) Forecast by Modular Storage, 2019 to 2034

Table 64: East Asia Market Volume (Units) Forecast by Modular Storage, 2019 to 2034

Table 65: East Asia Market Value (US$ Million) Forecast by Pressure, 2019 to 2034

Table 66: East Asia Market Volume (Units) Forecast by Pressure, 2019 to 2034

Table 67: East Asia Market Value (US$ Million) Forecast by Tank Type, 2019 to 2034

Table 68: East Asia Market Volume (Units) Forecast by Tank Type, 2019 to 2034

Table 69: East Asia Market Value (US$ Million) Forecast by Application, 2019 to 2034

Table 70: East Asia Market Volume (Units) Forecast by Application, 2019 to 2034

Table 71: Middle East and Africa Market Value (US$ Million) Forecast by Country, 2019 to 2034

Table 72: Middle East and Africa Market Volume (Units) Forecast by Country, 2019 to 2034

Table 73: Middle East and Africa Market Value (US$ Million) Forecast by Modular Storage, 2019 to 2034

Table 74: Middle East and Africa Market Volume (Units) Forecast by Modular Storage, 2019 to 2034

Table 75: Middle East and Africa Market Value (US$ Million) Forecast by Pressure, 2019 to 2034

Table 76: Middle East and Africa Market Volume (Units) Forecast by Pressure, 2019 to 2034

Table 77: Middle East and Africa Market Value (US$ Million) Forecast by Tank Type, 2019 to 2034

Table 78: Middle East and Africa Market Volume (Units) Forecast by Tank Type, 2019 to 2034

Table 79: Middle East and Africa Market Value (US$ Million) Forecast by Application, 2019 to 2034

Table 80: Middle East and Africa Market Volume (Units) Forecast by Application, 2019 to 2034

List of Figures

Figure 1: Global Market Value (US$ Million) by Modular Storage, 2024 to 2034

Figure 2: Global Market Value (US$ Million) by Pressure, 2024 to 2034

Figure 3: Global Market Value (US$ Million) by Tank Type, 2024 to 2034

Figure 4: Global Market Value (US$ Million) by Application, 2024 to 2034

Figure 5: Global Market Value (US$ Million) by Region, 2024 to 2034

Figure 6: Global Market Value (US$ Million) Analysis by Region, 2019 to 2034

Figure 7: Global Market Volume (Units) Analysis by Region, 2019 to 2034

Figure 8: Global Market Value Share (%) and BPS Analysis by Region, 2024 to 2034

Figure 9: Global Market Y-o-Y Growth (%) Projections by Region, 2024 to 2034

Figure 10: Global Market Value (US$ Million) Analysis by Modular Storage, 2019 to 2034

Figure 11: Global Market Volume (Units) Analysis by Modular Storage, 2019 to 2034

Figure 12: Global Market Value Share (%) and BPS Analysis by Modular Storage, 2024 to 2034

Figure 13: Global Market Y-o-Y Growth (%) Projections by Modular Storage, 2024 to 2034

Figure 14: Global Market Value (US$ Million) Analysis by Pressure, 2019 to 2034

Figure 15: Global Market Volume (Units) Analysis by Pressure, 2019 to 2034

Figure 16: Global Market Value Share (%) and BPS Analysis by Pressure, 2024 to 2034

Figure 17: Global Market Y-o-Y Growth (%) Projections by Pressure, 2024 to 2034

Figure 18: Global Market Value (US$ Million) Analysis by Tank Type, 2019 to 2034

Figure 19: Global Market Volume (Units) Analysis by Tank Type, 2019 to 2034

Figure 20: Global Market Value Share (%) and BPS Analysis by Tank Type, 2024 to 2034

Figure 21: Global Market Y-o-Y Growth (%) Projections by Tank Type, 2024 to 2034

Figure 22: Global Market Value (US$ Million) Analysis by Application, 2019 to 2034

Figure 23: Global Market Volume (Units) Analysis by Application, 2019 to 2034

Figure 24: Global Market Value Share (%) and BPS Analysis by Application, 2024 to 2034

Figure 25: Global Market Y-o-Y Growth (%) Projections by Application, 2024 to 2034

Figure 26: Global Market Attractiveness by Modular Storage, 2024 to 2034

Figure 27: Global Market Attractiveness by Pressure, 2024 to 2034

Figure 28: Global Market Attractiveness by Tank Type, 2024 to 2034

Figure 29: Global Market Attractiveness by Application, 2024 to 2034

Figure 30: Global Market Attractiveness by Region, 2024 to 2034

Figure 31: North America Market Value (US$ Million) by Modular Storage, 2024 to 2034

Figure 32: North America Market Value (US$ Million) by Pressure, 2024 to 2034

Figure 33: North America Market Value (US$ Million) by Tank Type, 2024 to 2034

Figure 34: North America Market Value (US$ Million) by Application, 2024 to 2034

Figure 35: North America Market Value (US$ Million) by Country, 2024 to 2034

Figure 36: North America Market Value (US$ Million) Analysis by Country, 2019 to 2034

Figure 37: North America Market Volume (Units) Analysis by Country, 2019 to 2034

Figure 38: North America Market Value Share (%) and BPS Analysis by Country, 2024 to 2034

Figure 39: North America Market Y-o-Y Growth (%) Projections by Country, 2024 to 2034

Figure 40: North America Market Value (US$ Million) Analysis by Modular Storage, 2019 to 2034

Figure 41: North America Market Volume (Units) Analysis by Modular Storage, 2019 to 2034

Figure 42: North America Market Value Share (%) and BPS Analysis by Modular Storage, 2024 to 2034

Figure 43: North America Market Y-o-Y Growth (%) Projections by Modular Storage, 2024 to 2034

Figure 44: North America Market Value (US$ Million) Analysis by Pressure, 2019 to 2034

Figure 45: North America Market Volume (Units) Analysis by Pressure, 2019 to 2034

Figure 46: North America Market Value Share (%) and BPS Analysis by Pressure, 2024 to 2034

Figure 47: North America Market Y-o-Y Growth (%) Projections by Pressure, 2024 to 2034

Figure 48: North America Market Value (US$ Million) Analysis by Tank Type, 2019 to 2034

Figure 49: North America Market Volume (Units) Analysis by Tank Type, 2019 to 2034

Figure 50: North America Market Value Share (%) and BPS Analysis by Tank Type, 2024 to 2034

Figure 51: North America Market Y-o-Y Growth (%) Projections by Tank Type, 2024 to 2034

Figure 52: North America Market Value (US$ Million) Analysis by Application, 2019 to 2034

Figure 53: North America Market Volume (Units) Analysis by Application, 2019 to 2034

Figure 54: North America Market Value Share (%) and BPS Analysis by Application, 2024 to 2034

Figure 55: North America Market Y-o-Y Growth (%) Projections by Application, 2024 to 2034

Figure 56: North America Market Attractiveness by Modular Storage, 2024 to 2034

Figure 57: North America Market Attractiveness by Pressure, 2024 to 2034

Figure 58: North America Market Attractiveness by Tank Type, 2024 to 2034

Figure 59: North America Market Attractiveness by Application, 2024 to 2034

Figure 60: North America Market Attractiveness by Country, 2024 to 2034

Figure 61: Latin America Market Value (US$ Million) by Modular Storage, 2024 to 2034

Figure 62: Latin America Market Value (US$ Million) by Pressure, 2024 to 2034

Figure 63: Latin America Market Value (US$ Million) by Tank Type, 2024 to 2034

Figure 64: Latin America Market Value (US$ Million) by Application, 2024 to 2034

Figure 65: Latin America Market Value (US$ Million) by Country, 2024 to 2034

Figure 66: Latin America Market Value (US$ Million) Analysis by Country, 2019 to 2034

Figure 67: Latin America Market Volume (Units) Analysis by Country, 2019 to 2034

Figure 68: Latin America Market Value Share (%) and BPS Analysis by Country, 2024 to 2034

Figure 69: Latin America Market Y-o-Y Growth (%) Projections by Country, 2024 to 2034

Figure 70: Latin America Market Value (US$ Million) Analysis by Modular Storage, 2019 to 2034

Figure 71: Latin America Market Volume (Units) Analysis by Modular Storage, 2019 to 2034

Figure 72: Latin America Market Value Share (%) and BPS Analysis by Modular Storage, 2024 to 2034

Figure 73: Latin America Market Y-o-Y Growth (%) Projections by Modular Storage, 2024 to 2034

Figure 74: Latin America Market Value (US$ Million) Analysis by Pressure, 2019 to 2034

Figure 75: Latin America Market Volume (Units) Analysis by Pressure, 2019 to 2034

Figure 76: Latin America Market Value Share (%) and BPS Analysis by Pressure, 2024 to 2034

Figure 77: Latin America Market Y-o-Y Growth (%) Projections by Pressure, 2024 to 2034

Figure 78: Latin America Market Value (US$ Million) Analysis by Tank Type, 2019 to 2034

Figure 79: Latin America Market Volume (Units) Analysis by Tank Type, 2019 to 2034

Figure 80: Latin America Market Value Share (%) and BPS Analysis by Tank Type, 2024 to 2034

Figure 81: Latin America Market Y-o-Y Growth (%) Projections by Tank Type, 2024 to 2034

Figure 82: Latin America Market Value (US$ Million) Analysis by Application, 2019 to 2034

Figure 83: Latin America Market Volume (Units) Analysis by Application, 2019 to 2034

Figure 84: Latin America Market Value Share (%) and BPS Analysis by Application, 2024 to 2034

Figure 85: Latin America Market Y-o-Y Growth (%) Projections by Application, 2024 to 2034

Figure 86: Latin America Market Attractiveness by Modular Storage, 2024 to 2034

Figure 87: Latin America Market Attractiveness by Pressure, 2024 to 2034

Figure 88: Latin America Market Attractiveness by Tank Type, 2024 to 2034

Figure 89: Latin America Market Attractiveness by Application, 2024 to 2034

Figure 90: Latin America Market Attractiveness by Country, 2024 to 2034

Figure 91: Western Europe Market Value (US$ Million) by Modular Storage, 2024 to 2034

Figure 92: Western Europe Market Value (US$ Million) by Pressure, 2024 to 2034

Figure 93: Western Europe Market Value (US$ Million) by Tank Type, 2024 to 2034

Figure 94: Western Europe Market Value (US$ Million) by Application, 2024 to 2034

Figure 95: Western Europe Market Value (US$ Million) by Country, 2024 to 2034

Figure 96: Western Europe Market Value (US$ Million) Analysis by Country, 2019 to 2034

Figure 97: Western Europe Market Volume (Units) Analysis by Country, 2019 to 2034

Figure 98: Western Europe Market Value Share (%) and BPS Analysis by Country, 2024 to 2034

Figure 99: Western Europe Market Y-o-Y Growth (%) Projections by Country, 2024 to 2034

Figure 100: Western Europe Market Value (US$ Million) Analysis by Modular Storage, 2019 to 2034

Figure 101: Western Europe Market Volume (Units) Analysis by Modular Storage, 2019 to 2034

Figure 102: Western Europe Market Value Share (%) and BPS Analysis by Modular Storage, 2024 to 2034

Figure 103: Western Europe Market Y-o-Y Growth (%) Projections by Modular Storage, 2024 to 2034

Figure 104: Western Europe Market Value (US$ Million) Analysis by Pressure, 2019 to 2034

Figure 105: Western Europe Market Volume (Units) Analysis by Pressure, 2019 to 2034

Figure 106: Western Europe Market Value Share (%) and BPS Analysis by Pressure, 2024 to 2034

Figure 107: Western Europe Market Y-o-Y Growth (%) Projections by Pressure, 2024 to 2034

Figure 108: Western Europe Market Value (US$ Million) Analysis by Tank Type, 2019 to 2034

Figure 109: Western Europe Market Volume (Units) Analysis by Tank Type, 2019 to 2034

Figure 110: Western Europe Market Value Share (%) and BPS Analysis by Tank Type, 2024 to 2034

Figure 111: Western Europe Market Y-o-Y Growth (%) Projections by Tank Type, 2024 to 2034

Figure 112: Western Europe Market Value (US$ Million) Analysis by Application, 2019 to 2034

Figure 113: Western Europe Market Volume (Units) Analysis by Application, 2019 to 2034

Figure 114: Western Europe Market Value Share (%) and BPS Analysis by Application, 2024 to 2034

Figure 115: Western Europe Market Y-o-Y Growth (%) Projections by Application, 2024 to 2034

Figure 116: Western Europe Market Attractiveness by Modular Storage, 2024 to 2034

Figure 117: Western Europe Market Attractiveness by Pressure, 2024 to 2034

Figure 118: Western Europe Market Attractiveness by Tank Type, 2024 to 2034

Figure 119: Western Europe Market Attractiveness by Application, 2024 to 2034

Figure 120: Western Europe Market Attractiveness by Country, 2024 to 2034

Figure 121: Eastern Europe Market Value (US$ Million) by Modular Storage, 2024 to 2034

Figure 122: Eastern Europe Market Value (US$ Million) by Pressure, 2024 to 2034

Figure 123: Eastern Europe Market Value (US$ Million) by Tank Type, 2024 to 2034

Figure 124: Eastern Europe Market Value (US$ Million) by Application, 2024 to 2034

Figure 125: Eastern Europe Market Value (US$ Million) by Country, 2024 to 2034

Figure 126: Eastern Europe Market Value (US$ Million) Analysis by Country, 2019 to 2034

Figure 127: Eastern Europe Market Volume (Units) Analysis by Country, 2019 to 2034

Figure 128: Eastern Europe Market Value Share (%) and BPS Analysis by Country, 2024 to 2034

Figure 129: Eastern Europe Market Y-o-Y Growth (%) Projections by Country, 2024 to 2034

Figure 130: Eastern Europe Market Value (US$ Million) Analysis by Modular Storage, 2019 to 2034

Figure 131: Eastern Europe Market Volume (Units) Analysis by Modular Storage, 2019 to 2034

Figure 132: Eastern Europe Market Value Share (%) and BPS Analysis by Modular Storage, 2024 to 2034

Figure 133: Eastern Europe Market Y-o-Y Growth (%) Projections by Modular Storage, 2024 to 2034

Figure 134: Eastern Europe Market Value (US$ Million) Analysis by Pressure, 2019 to 2034

Figure 135: Eastern Europe Market Volume (Units) Analysis by Pressure, 2019 to 2034

Figure 136: Eastern Europe Market Value Share (%) and BPS Analysis by Pressure, 2024 to 2034

Figure 137: Eastern Europe Market Y-o-Y Growth (%) Projections by Pressure, 2024 to 2034

Figure 138: Eastern Europe Market Value (US$ Million) Analysis by Tank Type, 2019 to 2034

Figure 139: Eastern Europe Market Volume (Units) Analysis by Tank Type, 2019 to 2034

Figure 140: Eastern Europe Market Value Share (%) and BPS Analysis by Tank Type, 2024 to 2034

Figure 141: Eastern Europe Market Y-o-Y Growth (%) Projections by Tank Type, 2024 to 2034

Figure 142: Eastern Europe Market Value (US$ Million) Analysis by Application, 2019 to 2034

Figure 143: Eastern Europe Market Volume (Units) Analysis by Application, 2019 to 2034

Figure 144: Eastern Europe Market Value Share (%) and BPS Analysis by Application, 2024 to 2034

Figure 145: Eastern Europe Market Y-o-Y Growth (%) Projections by Application, 2024 to 2034

Figure 146: Eastern Europe Market Attractiveness by Modular Storage, 2024 to 2034

Figure 147: Eastern Europe Market Attractiveness by Pressure, 2024 to 2034

Figure 148: Eastern Europe Market Attractiveness by Tank Type, 2024 to 2034

Figure 149: Eastern Europe Market Attractiveness by Application, 2024 to 2034

Figure 150: Eastern Europe Market Attractiveness by Country, 2024 to 2034

Figure 151: South Asia and Pacific Market Value (US$ Million) by Modular Storage, 2024 to 2034

Figure 152: South Asia and Pacific Market Value (US$ Million) by Pressure, 2024 to 2034

Figure 153: South Asia and Pacific Market Value (US$ Million) by Tank Type, 2024 to 2034

Figure 154: South Asia and Pacific Market Value (US$ Million) by Application, 2024 to 2034

Figure 155: South Asia and Pacific Market Value (US$ Million) by Country, 2024 to 2034

Figure 156: South Asia and Pacific Market Value (US$ Million) Analysis by Country, 2019 to 2034

Figure 157: South Asia and Pacific Market Volume (Units) Analysis by Country, 2019 to 2034

Figure 158: South Asia and Pacific Market Value Share (%) and BPS Analysis by Country, 2024 to 2034

Figure 159: South Asia and Pacific Market Y-o-Y Growth (%) Projections by Country, 2024 to 2034

Figure 160: South Asia and Pacific Market Value (US$ Million) Analysis by Modular Storage, 2019 to 2034

Figure 161: South Asia and Pacific Market Volume (Units) Analysis by Modular Storage, 2019 to 2034

Figure 162: South Asia and Pacific Market Value Share (%) and BPS Analysis by Modular Storage, 2024 to 2034

Figure 163: South Asia and Pacific Market Y-o-Y Growth (%) Projections by Modular Storage, 2024 to 2034

Figure 164: South Asia and Pacific Market Value (US$ Million) Analysis by Pressure, 2019 to 2034

Figure 165: South Asia and Pacific Market Volume (Units) Analysis by Pressure, 2019 to 2034

Figure 166: South Asia and Pacific Market Value Share (%) and BPS Analysis by Pressure, 2024 to 2034

Figure 167: South Asia and Pacific Market Y-o-Y Growth (%) Projections by Pressure, 2024 to 2034

Figure 168: South Asia and Pacific Market Value (US$ Million) Analysis by Tank Type, 2019 to 2034

Figure 169: South Asia and Pacific Market Volume (Units) Analysis by Tank Type, 2019 to 2034

Figure 170: South Asia and Pacific Market Value Share (%) and BPS Analysis by Tank Type, 2024 to 2034

Figure 171: South Asia and Pacific Market Y-o-Y Growth (%) Projections by Tank Type, 2024 to 2034

Figure 172: South Asia and Pacific Market Value (US$ Million) Analysis by Application, 2019 to 2034

Figure 173: South Asia and Pacific Market Volume (Units) Analysis by Application, 2019 to 2034

Figure 174: South Asia and Pacific Market Value Share (%) and BPS Analysis by Application, 2024 to 2034

Figure 175: South Asia and Pacific Market Y-o-Y Growth (%) Projections by Application, 2024 to 2034

Figure 176: South Asia and Pacific Market Attractiveness by Modular Storage, 2024 to 2034

Figure 177: South Asia and Pacific Market Attractiveness by Pressure, 2024 to 2034

Figure 178: South Asia and Pacific Market Attractiveness by Tank Type, 2024 to 2034

Figure 179: South Asia and Pacific Market Attractiveness by Application, 2024 to 2034

Figure 180: South Asia and Pacific Market Attractiveness by Country, 2024 to 2034

Figure 181: East Asia Market Value (US$ Million) by Modular Storage, 2024 to 2034

Figure 182: East Asia Market Value (US$ Million) by Pressure, 2024 to 2034

Figure 183: East Asia Market Value (US$ Million) by Tank Type, 2024 to 2034

Figure 184: East Asia Market Value (US$ Million) by Application, 2024 to 2034

Figure 185: East Asia Market Value (US$ Million) by Country, 2024 to 2034

Figure 186: East Asia Market Value (US$ Million) Analysis by Country, 2019 to 2034

Figure 187: East Asia Market Volume (Units) Analysis by Country, 2019 to 2034

Figure 188: East Asia Market Value Share (%) and BPS Analysis by Country, 2024 to 2034

Figure 189: East Asia Market Y-o-Y Growth (%) Projections by Country, 2024 to 2034

Figure 190: East Asia Market Value (US$ Million) Analysis by Modular Storage, 2019 to 2034

Figure 191: East Asia Market Volume (Units) Analysis by Modular Storage, 2019 to 2034

Figure 192: East Asia Market Value Share (%) and BPS Analysis by Modular Storage, 2024 to 2034

Figure 193: East Asia Market Y-o-Y Growth (%) Projections by Modular Storage, 2024 to 2034

Figure 194: East Asia Market Value (US$ Million) Analysis by Pressure, 2019 to 2034

Figure 195: East Asia Market Volume (Units) Analysis by Pressure, 2019 to 2034

Figure 196: East Asia Market Value Share (%) and BPS Analysis by Pressure, 2024 to 2034

Figure 197: East Asia Market Y-o-Y Growth (%) Projections by Pressure, 2024 to 2034

Figure 198: East Asia Market Value (US$ Million) Analysis by Tank Type, 2019 to 2034

Figure 199: East Asia Market Volume (Units) Analysis by Tank Type, 2019 to 2034

Figure 200: East Asia Market Value Share (%) and BPS Analysis by Tank Type, 2024 to 2034

Figure 201: East Asia Market Y-o-Y Growth (%) Projections by Tank Type, 2024 to 2034

Figure 202: East Asia Market Value (US$ Million) Analysis by Application, 2019 to 2034

Figure 203: East Asia Market Volume (Units) Analysis by Application, 2019 to 2034

Figure 204: East Asia Market Value Share (%) and BPS Analysis by Application, 2024 to 2034

Figure 205: East Asia Market Y-o-Y Growth (%) Projections by Application, 2024 to 2034

Figure 206: East Asia Market Attractiveness by Modular Storage, 2024 to 2034

Figure 207: East Asia Market Attractiveness by Pressure, 2024 to 2034

Figure 208: East Asia Market Attractiveness by Tank Type, 2024 to 2034

Figure 209: East Asia Market Attractiveness by Application, 2024 to 2034

Figure 210: East Asia Market Attractiveness by Country, 2024 to 2034

Figure 211: Middle East and Africa Market Value (US$ Million) by Modular Storage, 2024 to 2034

Figure 212: Middle East and Africa Market Value (US$ Million) by Pressure, 2024 to 2034

Figure 213: Middle East and Africa Market Value (US$ Million) by Tank Type, 2024 to 2034

Figure 214: Middle East and Africa Market Value (US$ Million) by Application, 2024 to 2034

Figure 215: Middle East and Africa Market Value (US$ Million) by Country, 2024 to 2034

Figure 216: Middle East and Africa Market Value (US$ Million) Analysis by Country, 2019 to 2034

Figure 217: Middle East and Africa Market Volume (Units) Analysis by Country, 2019 to 2034

Figure 218: Middle East and Africa Market Value Share (%) and BPS Analysis by Country, 2024 to 2034

Figure 219: Middle East and Africa Market Y-o-Y Growth (%) Projections by Country, 2024 to 2034

Figure 220: Middle East and Africa Market Value (US$ Million) Analysis by Modular Storage, 2019 to 2034

Figure 221: Middle East and Africa Market Volume (Units) Analysis by Modular Storage, 2019 to 2034

Figure 222: Middle East and Africa Market Value Share (%) and BPS Analysis by Modular Storage, 2024 to 2034

Figure 223: Middle East and Africa Market Y-o-Y Growth (%) Projections by Modular Storage, 2024 to 2034

Figure 224: Middle East and Africa Market Value (US$ Million) Analysis by Pressure, 2019 to 2034

Figure 225: Middle East and Africa Market Volume (Units) Analysis by Pressure, 2019 to 2034

Figure 226: Middle East and Africa Market Value Share (%) and BPS Analysis by Pressure, 2024 to 2034

Figure 227: Middle East and Africa Market Y-o-Y Growth (%) Projections by Pressure, 2024 to 2034

Figure 228: Middle East and Africa Market Value (US$ Million) Analysis by Tank Type, 2019 to 2034

Figure 229: Middle East and Africa Market Volume (Units) Analysis by Tank Type, 2019 to 2034

Figure 230: Middle East and Africa Market Value Share (%) and BPS Analysis by Tank Type, 2024 to 2034

Figure 231: Middle East and Africa Market Y-o-Y Growth (%) Projections by Tank Type, 2024 to 2034

Figure 232: Middle East and Africa Market Value (US$ Million) Analysis by Application, 2019 to 2034

Figure 233: Middle East and Africa Market Volume (Units) Analysis by Application, 2019 to 2034

Figure 234: Middle East and Africa Market Value Share (%) and BPS Analysis by Application, 2024 to 2034

Figure 235: Middle East and Africa Market Y-o-Y Growth (%) Projections by Application, 2024 to 2034

Figure 236: Middle East and Africa Market Attractiveness by Modular Storage, 2024 to 2034

Figure 237: Middle East and Africa Market Attractiveness by Pressure, 2024 to 2034

Figure 238: Middle East and Africa Market Attractiveness by Tank Type, 2024 to 2034

Figure 239: Middle East and Africa Market Attractiveness by Application, 2024 to 2034

Figure 240: Middle East and Africa Market Attractiveness by Country, 2024 to 2034

Frequently Asked Questions

What is Current Hydrogen Storage Tank and Transportation Market Valuation?

The hydrogen transportation and storage tank market to secure a valuation USD 392.6 million in 2024.

How Big Can the Hydrogen Storage Tank and Transportation Market Be by 2034?

The hydrogen transportation and storage tank is estimated to reach USD 20.8 billion by 2034.

What is the Growth Potential of the Hydrogen Storage Tank and Transportation Market?

Through 2034, the hydrogen storage tank and transportation industry are anticipated to accelerate at a 48.7% strong CAGR.

What Was the Historical Outlook of The Hydrogen Storage Tank and Transportation Market?

From 2019 to 2023, the hydrogen transportation and storage tank recorded a 53.4% CAGR.

Which Modular Storage Segment to Dominate in the Hydrogen Storage Tank and Transportation Market?

The hydrogen fuel storage system sector is projected to boost at a CAGR of 48.2% through 2034.

Which Pressure Segment to Lead the Hydrogen Storage Tank and Transportation Market?

The <200 Bar sector is envisioned to advance at a CAGR of 47.8% from 2024 to 2034.

Explore Similar Insights

Future Market Insights

Hydrogen Storage Tank And Transportation Market