Reports
- Global Locations -
Headquarters
Future Market Insights, Inc.
Christiana Corporate, 200
Continental Drive, Suite 401,
Newark, Delaware - 19713,
United States
Americas
Future Market Insights, Inc.
616 Corporate Way, Suite 2-9018,
Valley Cottage, NY 10989, United States
MEA
Future Market Insights
1602-6 Jumeirah Bay X2 Tower, Plot No: JLT-PH2-X2A,
Jumeirah Lakes Towers, Dubai,
United Arab Emirates
Europe
Future Market Insights
3rd Floor, 207 Regent Street,
W1B 3HH London
United Kingdom
Asia Pacific
Future Market Insights
Office No. 401-A, 4th Floor,
VANTAGE 9, S.No. 36/1/1,
Baner, Pune 411045, India
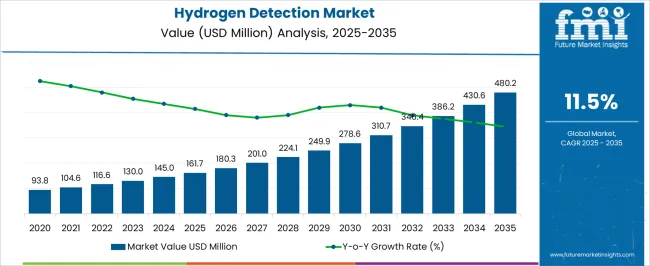
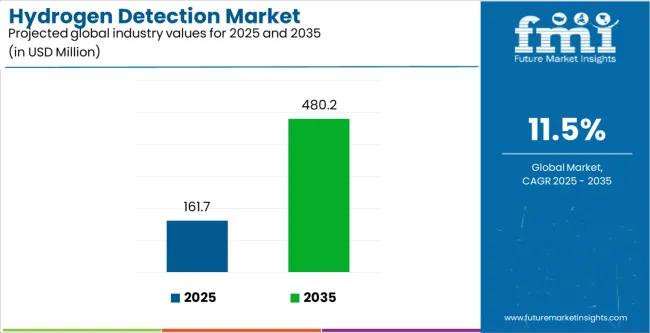
The current value of the worldwide hydrogen detection market is estimated to be US$ 270.3 million, and the market is likely to be worth US$ 800 million by 2034. From 2024 to 2034, the market is predicted to have a moderate CAGR of 11.5%.
Key Market Highlights
Elevation in the Utilization of Eco-friendly Vehicles Boosts Hydrogen Detection Market
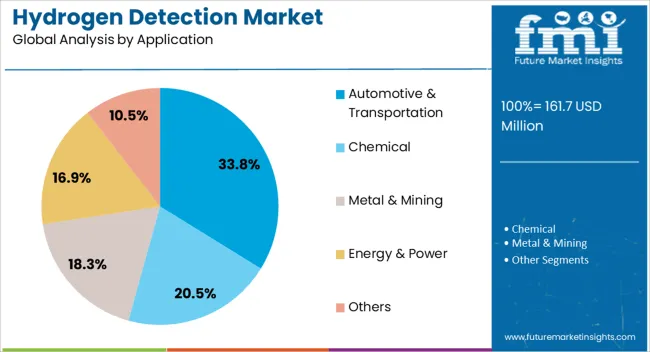
The demand for hydrogen detection equipment is expected to grow significantly with the rising adoption of fuel cells. This is especially evident in the transportation market, where hydrogen fuel cell vehicles are gaining popularity as an eco-friendly alternative to conventional natural fuel-powered locomotives. Fuel cell vehicles offer several benefits over traditional gasoline-powered vehicles, such as lower greenhouse gas emissions, improved fuel efficiency, and quieter operation.
Attributes | Key Statistics |
---|---|
Expected Base Year Value (2024) | US$ 270.3 million |
Anticipated Forecast Value (2034) | US$ 800 million |
Estimated Growth (2024 to 2034) | 11.5% CAGR |
Detecting hydrogen is essential to ensuring the reliable and safe operation of fuel cell vehicles. As it plays a vital role in ensuring the safe and efficient operation of fuel cells and the broader hydrogen-based energy economy. However, the growth can be impeded by the need for hydrogen leak detection and monitoring for safety and process control in multiple industries.
Content Monitoring is Anticipated to Account for the Largest Share of the Hydrogen Detection Market
Constant monitoring of hydrogen levels is the primary function of fixed hydrogen detectors, making them ideal for environments where hydrogen is always present, such as in fuel cell manufacturing plants, FCVs, or chemical plants that use hydrogen as a reagent or carrier gas. Due to their heightened sensitivity, these detectors can detect even low levels of hydrogen, which is crucial for safeguarding personnel and preventing the accumulation of explosive hydrogen concentrations. Furthermore, fixed hydrogen detectors are often calibrated to specific hydrogen concentrations, providing more precise readings. These factors are projected to drive the growth of the fixed hydrogen detection equipment market.
Don't pay for what you don't need
Customize your report by selecting specific countries or regions and save 30%!
The detection of hydrogen gas is crucial in various industries as it helps in measuring the hydrogen concentration, leak detection, and identifying the sources of hydrogen gas. Hydrogen detection technology is extensively used in different settings, from industrial to medical, to detect the presence of hydrogen gas. With the rise of hydrogen fuel cell technology and the increased use of hydrogen as an energy source, there has been a surge in the development of hydrogen detection technology, leading to several advancements and innovations in the market.
During the forecast period, the global market for hydrogen detection is expected to witness significant growth due to multiple factors. Hydrogen detection technology can detect the presence of hydrogen gas in various applications such as industrial, automotive, medical, and residential settings. It is a vital safety measure, given that hydrogen gas can be hazardous in the wrong environment. In recent years, hydrogen detection technology has witnessed significant advancements and innovations. These include the development of more sophisticated sensors, multi-gas sensors, wireless sensors, and user-friendly technology.
Attributes | Key Statistics |
---|---|
Expected Base Year Value (2023) | US$ 240.3 million |
Final Value (2024) | US$ 270.3 million |
Estimated Growth (2019 to 2023) | 13.5% CAGR |
Three adjacent markets parallel to the hydrogen detection market have been discussed in the section below. Key attributes such as growth rates, driving forces, and critical demand opportunities for key players in these markets over the coming decade have been highlighted to analyze the market scenario in a better way.
Hydrogen Detection Market:
Attributes | Hydrogen Detection Market |
---|---|
CAGR (2024 to 2034) | 11.5% |
Market Value (2034) | US$ 800 million |
Growth Factors | Rising adoption of hydrogen as an alternative source of energy. |
Future Opportunities | Increasing investments in hydrogen infrastructure create growth opportunities for market players. |
Intrusion Detection System Market:
Attributes | Intrusion Detection System Market |
---|---|
CAGR (2023 to 2033) | 12.5% |
Market Value (2033) | US$ 15.62 billion |
Growth Factors | Growing safety threats and data breaches in end-use industries. |
Future Opportunities | Market players focus on specific products to meet consumers' needs and provide innovative features. |
Color Detection Sensors Market:
Attributes | Color Detection Sensors Market |
---|---|
CAGR (2023 to 2033) | 5.6% |
Market Value (2033) | US$ 1.98 billion |
Growth Factors | Instantaneous technical improvements in the automation industry. |
Future Opportunities | Several market players can collaborate with leading healthcare and packaging experts to expand the market. |
Pesticide Detection Market:
Attributes | Pesticide Detection Market |
---|---|
CAGR (2023 to 2033) | 7.4% |
Market Value (2033) | US$ 3,763.3 million |
Growth Factors | Factors such as a lack of institutional coordination, outdated technology, and a lack of expertise for executing at the lowest levels are anticipated to hamper the market growth. |
Future Opportunities | The market players can expand their market in the developing and under-developing regions. |
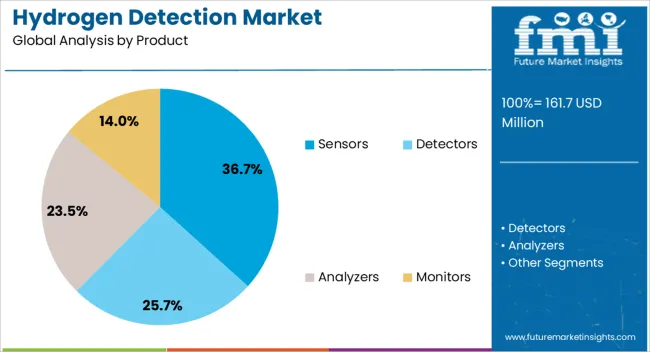
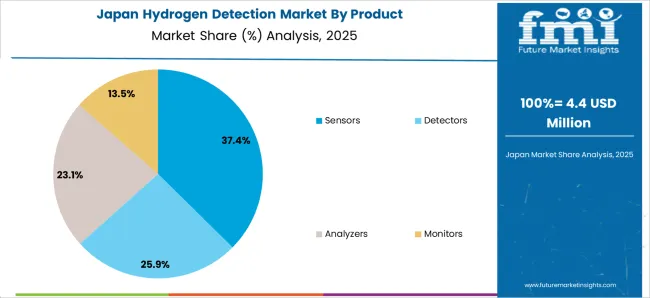
The global hydrogen detection market is categorized into four product types: sensors, detectors, analyzers, and monitors. The demand for sensors is poised to experience rapid expansion, primarily due to their versatile applications, including leak detection and fieldwork. The sensors segment is expected to dominate the market in the upcoming decade, accounting for a global CAGR of 11.3%. Unique opportunities exist for these sensors, particularly in specific domains like hydrogen fueling stations, catering to evolving safety and environmental needs.
Top Product | Sensors |
---|---|
CAGR % 2019 to 2023 | 13.4% CAGR |
CAGR % 2024 to End of Forecast(2034) | 11.3% CAGR |
Get the data you need at a Fraction of the cost
Personalize your report by choosing insights you need
and save 40%!
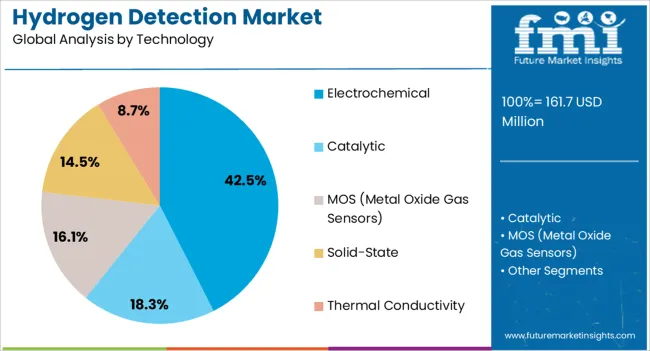
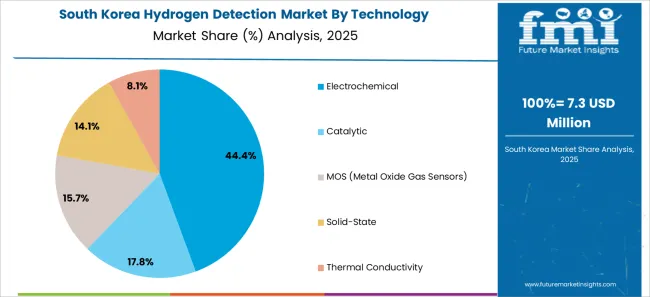
Five categories based on technology have been identified for the global hydrogen detection market. These categories include catalytic, electrochemical, MOS (Metal Oxide Gas Sensors), solid-state, and thermal conductivity. The catalytic category is expected to dominate the market due to the increase in hydrogen infrastructure investments. Catalytic technologies are predicted to gain more popularity in the next ten years compared to other methods due to their broad range of industrial applications.
Top Technology | Catalytic |
---|---|
CAGR % 2019 to 2023 | 13.2% CAGR |
CAGR % 2024 to End of Forecast(2034) | 11.1% CAGR |
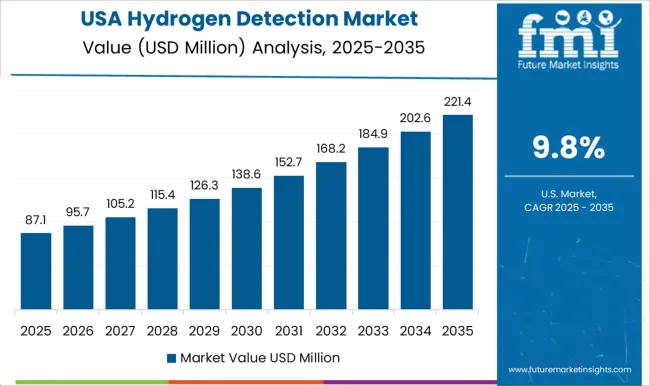
The hydrogen detection market in the United States is predicted to see moderate growth due to the presence of multiple automation companies. Furthermore, the demand for hydrogen fuel cells is increasing, and they are being utilized more in various industries, including transportation, power generation, and industrial applications. This trend is expected to drive the growth of hydrogen infrastructure in the coming years.
Country | United States |
---|---|
CAGR (2019 to 2023) | 14.2% |
CAGR (2024 to 2034) | 11.6% |
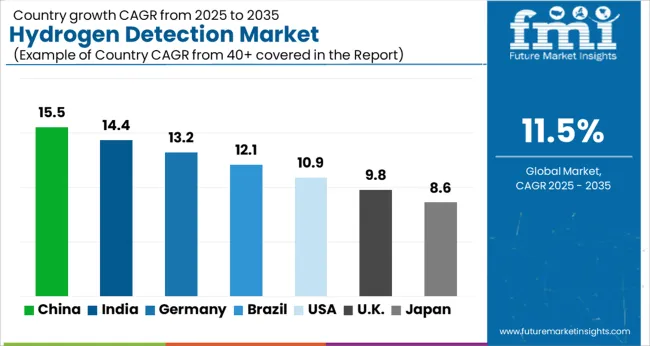
The United Kingdom is anticipated to experience massive growth in the coming years due to its favorable trade relations and government efforts to invest in new hydrogen infrastructure. Digitization and adoption of small-sized gadgets is the current trend in the country. The demand for hydrogen detection products in the United Kingdom is projected to grow at a rate of around 12.1% between 2024 and 2034.
Country | United Kingdom |
---|---|
CAGR (2019 to 2023) | 17.4% |
CAGR (2024 to 2034) | 12.1% |
The hydrogen detection market in China is witnessing escalating demand across sectors such as automotive and transportation and energy and power. Its status as a developing economy and substantial investments in hydrogen infrastructure advancements contribute to the market's upward trajectory. The market in China is propelled to grow at 11.8% in the upcoming decade.
Country | China |
---|---|
CAGR (2019 to 2023) | 15.2% |
CAGR (2024 to 2034) | 11.8% |
The hydrogen detection market in Japan is projected to grow by 12.8% during the forecast period, which is lower than the historic CAGR of 16.7% from 2019 to 2023. However, the market in Japan is expected to expand steadily, mainly driven by the significant hydrogen production capabilities and the growing focus on clean energy sources.
Country | Japan |
---|---|
CAGR (2019 to 2023) | 16.7% |
CAGR (2024 to 2034) | 12.8% |
South Korea is becoming the leading industry for clean hydrogen. To facilitate investment and large-scale operation of clean hydrogen projects, the government has established authorities. The country aims to develop a domestic market for hydrogen infrastructure that not only powers the industry but also establishes a hydrogen market and international cooperation. These initiatives pave the way for the growing demand for hydrogen sensors in the country.
Country | South Korea |
---|---|
CAGR (2019 to 2023) | 18.0% |
CAGR (2024 to 2034) | 12.6% |
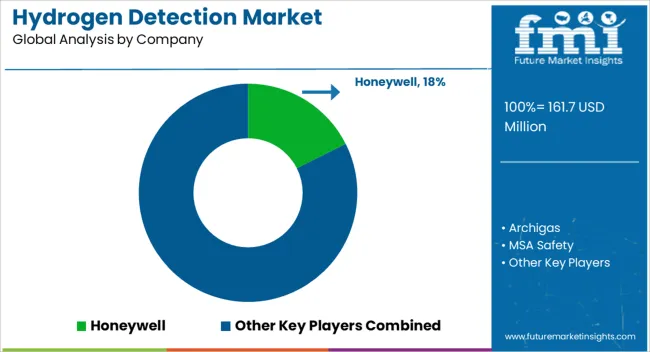
Key players in the market are developing automated and intelligent hydrogen sensors. To increase profit margins, companies are exploring ways to integrate their sales channels and reduce the number of stakeholders in the supply chain. These market leaders have utilized product launches, acquisitions, and partnerships to enhance their standing in the hydrogen detection industry through both organic and inorganic growth strategies.
Recent Developments in the Hydrogen Detection Market
1. Executive Summary 1.1. Global Market Outlook 1.2. Demand-side Trends 1.3. Supply-side Trends 1.4. Technology Roadmap Analysis 1.5. Analysis and Recommendations 2. Market Overview 2.1. Market Coverage / Taxonomy 2.2. Market Definition / Scope / Limitations 3. Market Background 3.1. Market Dynamics 3.1.1. Drivers 3.1.2. Restraints 3.1.3. Opportunity 3.1.4. Trends 3.2. Scenario Forecast 3.2.1. Demand in Optimistic Scenario 3.2.2. Demand in Likely Scenario 3.2.3. Demand in Conservative Scenario 3.3. Opportunity Map Analysis 3.4. Product Life Cycle Analysis 3.5. Supply Chain Analysis 3.5.1. Supply Side Participants and their Roles 3.5.1.1. Producers 3.5.1.2. Mid-Level Participants (Traders/ Agents/ Brokers) 3.5.1.3. Wholesalers and Distributors 3.5.2. Value Added and Value Created at Node in the Supply Chain 3.5.3. List of Raw Material Suppliers 3.5.4. List of Existing and Potential Buyer’s 3.6. Investment Feasibility Matrix 3.7. Value Chain Analysis 3.7.1. Profit Margin Analysis 3.7.2. Wholesalers and Distributors 3.7.3. Retailers 3.8. PESTLE and Porter’s Analysis 3.9. Regulatory Landscape 3.9.1. By Key Regions 3.9.2. By Key Countries 3.10. Regional Parent Market Outlook 3.11. Production and Consumption Statistics 3.12. Import and Export Statistics 4. Global Market Analysis 2019 to 2023 and Forecast, 2024 to 2034 4.1. Historical Market Size Value (US$ Million) & Volume (Units) Analysis, 2019 to 2023 4.2. Current and Future Market Size Value (US$ Million) & Volume (Units) Projections, 2024 to 2034 4.2.1. Y-o-Y Growth Trend Analysis 4.2.2. Absolute $ Opportunity Analysis 5. Global Market Analysis 2019 to 2023 and Forecast 2024 to 2034, By Product 5.1. Introduction / Key Findings 5.2. Historical Market Size Value (US$ Million) & Volume (Units) Analysis By Product, 2019 to 2023 5.3. Current and Future Market Size Value (US$ Million) & Volume (Units) Analysis and Forecast By Product, 2024 to 2034 5.3.1. Sensors 5.3.2. Detectors 5.3.3. Analyzers 5.3.4. Monitors 5.4. Y-o-Y Growth Trend Analysis By Product, 2019 to 2023 5.5. Absolute $ Opportunity Analysis By Product, 2024 to 2034 6. Global Market Analysis 2019 to 2023 and Forecast 2024 to 2034, By Technology 6.1. Introduction / Key Findings 6.2. Historical Market Size Value (US$ Million) & Volume (Units) Analysis By Technology, 2019 to 2023 6.3. Current and Future Market Size Value (US$ Million) & Volume (Units) Analysis and Forecast By Technology, 2024 to 2034 6.3.1. Catalytic 6.3.2. Electrochemical 6.3.3. MOS (Metal Oxide Gas Sensors) 6.3.4. Solid-State 6.3.5. Thermal Conductivity 6.4. Y-o-Y Growth Trend Analysis By Technology, 2019 to 2023 6.5. Absolute $ Opportunity Analysis By Technology, 2024 to 2034 7. Global Market Analysis 2019 to 2023 and Forecast 2024 to 2034, By Application 7.1. Introduction / Key Findings 7.2. Historical Market Size Value (US$ Million) & Volume (Units) Analysis By Application, 2019 to 2023 7.3. Current and Future Market Size Value (US$ Million) & Volume (Units) Analysis and Forecast By Application, 2024 to 2034 7.3.1. Oil & Gas 7.3.2. Automotive & Transportation 7.3.3. Chemical 7.3.4. Metal & Mining 7.3.5. Energy & Power 7.3.6. Others 7.4. Y-o-Y Growth Trend Analysis By Application, 2019 to 2023 7.5. Absolute $ Opportunity Analysis By Application, 2024 to 2034 8. Global Market Analysis 2019 to 2023 and Forecast 2024 to 2034, By Implementation 8.1. Introduction / Key Findings 8.2. Historical Market Size Value (US$ Million) & Volume (Units) Analysis By Implementation, 2019 to 2023 8.3. Current and Future Market Size Value (US$ Million) & Volume (Units) Analysis and Forecast By Implementation, 2024 to 2034 8.3.1. Fixed 8.3.2. Portable 8.4. Y-o-Y Growth Trend Analysis By Implementation, 2019 to 2023 8.5. Absolute $ Opportunity Analysis By Implementation, 2024 to 2034 9. Global Market Analysis 2019 to 2023 and Forecast 2024 to 2034, By Detection Range 9.1. Introduction / Key Findings 9.2. Historical Market Size Value (US$ Million) & Volume (Units) Analysis By Detection Range, 2019 to 2023 9.3. Current and Future Market Size Value (US$ Million) & Volume (Units) Analysis and Forecast By Detection Range, 2024 to 2034 9.3.1. 0-1000 ppm 9.3.2. 0-5000 ppm 9.3.3. 0-20000 ppm 9.3.4. > 0-20000 ppm 9.4. Y-o-Y Growth Trend Analysis By Detection Range, 2019 to 2023 9.5. Absolute $ Opportunity Analysis By Detection Range, 2024 to 2034 10. Global Market Analysis 2019 to 2023 and Forecast 2024 to 2034, By Region 10.1. Introduction 10.2. Historical Market Size Value (US$ Million) & Volume (Units) Analysis By Region, 2019 to 2023 10.3. Current Market Size Value (US$ Million) & Volume (Units) Analysis and Forecast By Region, 2024 to 2034 10.3.1. North America 10.3.2. Latin America 10.3.3. Western Europe 10.3.4. Eastern Europe 10.3.5. South Asia and Pacific 10.3.6. East Asia 10.3.7. Middle East and Africa 10.4. Market Attractiveness Analysis By Region 11. North America Market Analysis 2019 to 2023 and Forecast 2024 to 2034, By Country 11.1. Historical Market Size Value (US$ Million) & Volume (Units) Trend Analysis By Market Taxonomy, 2019 to 2023 11.2. Market Size Value (US$ Million) & Volume (Units) Forecast By Market Taxonomy, 2024 to 2034 11.2.1. By Country 11.2.1.1. USA 11.2.1.2. Canada 11.2.2. By Product 11.2.3. By Technology 11.2.4. By Application 11.2.5. By Implementation 11.2.6. By Detection Range 11.3. Market Attractiveness Analysis 11.3.1. By Country 11.3.2. By Product 11.3.3. By Technology 11.3.4. By Application 11.3.5. By Implementation 11.3.6. By Detection Range 11.4. Key Takeaways 12. Latin America Market Analysis 2019 to 2023 and Forecast 2024 to 2034, By Country 12.1. Historical Market Size Value (US$ Million) & Volume (Units) Trend Analysis By Market Taxonomy, 2019 to 2023 12.2. Market Size Value (US$ Million) & Volume (Units) Forecast By Market Taxonomy, 2024 to 2034 12.2.1. By Country 12.2.1.1. Brazil 12.2.1.2. Mexico 12.2.1.3. Rest of Latin America 12.2.2. By Product 12.2.3. By Technology 12.2.4. By Application 12.2.5. By Implementation 12.2.6. By Detection Range 12.3. Market Attractiveness Analysis 12.3.1. By Country 12.3.2. By Product 12.3.3. By Technology 12.3.4. By Application 12.3.5. By Implementation 12.3.6. By Detection Range 12.4. Key Takeaways 13. Western Europe Market Analysis 2019 to 2023 and Forecast 2024 to 2034, By Country 13.1. Historical Market Size Value (US$ Million) & Volume (Units) Trend Analysis By Market Taxonomy, 2019 to 2023 13.2. Market Size Value (US$ Million) & Volume (Units) Forecast By Market Taxonomy, 2024 to 2034 13.2.1. By Country 13.2.1.1. Germany 13.2.1.2. UK 13.2.1.3. France 13.2.1.4. Spain 13.2.1.5. Italy 13.2.1.6. Rest of Western Europe 13.2.2. By Product 13.2.3. By Technology 13.2.4. By Application 13.2.5. By Implementation 13.2.6. By Detection Range 13.3. Market Attractiveness Analysis 13.3.1. By Country 13.3.2. By Product 13.3.3. By Technology 13.3.4. By Application 13.3.5. By Implementation 13.3.6. By Detection Range 13.4. Key Takeaways 14. Eastern Europe Market Analysis 2019 to 2023 and Forecast 2024 to 2034, By Country 14.1. Historical Market Size Value (US$ Million) & Volume (Units) Trend Analysis By Market Taxonomy, 2019 to 2023 14.2. Market Size Value (US$ Million) & Volume (Units) Forecast By Market Taxonomy, 2024 to 2034 14.2.1. By Country 14.2.1.1. Poland 14.2.1.2. Russia 14.2.1.3. Czech Republic 14.2.1.4. Romania 14.2.1.5. Rest of Eastern Europe 14.2.2. By Product 14.2.3. By Technology 14.2.4. By Application 14.2.5. By Implementation 14.2.6. By Detection Range 14.3. Market Attractiveness Analysis 14.3.1. By Country 14.3.2. By Product 14.3.3. By Technology 14.3.4. By Application 14.3.5. By Implementation 14.3.6. By Detection Range 14.4. Key Takeaways 15. South Asia and Pacific Market Analysis 2019 to 2023 and Forecast 2024 to 2034, By Country 15.1. Historical Market Size Value (US$ Million) & Volume (Units) Trend Analysis By Market Taxonomy, 2019 to 2023 15.2. Market Size Value (US$ Million) & Volume (Units) Forecast By Market Taxonomy, 2024 to 2034 15.2.1. By Country 15.2.1.1. India 15.2.1.2. Bangladesh 15.2.1.3. Australia 15.2.1.4. New Zealand 15.2.1.5. Rest of South Asia and Pacific 15.2.2. By Product 15.2.3. By Technology 15.2.4. By Application 15.2.5. By Implementation 15.2.6. By Detection Range 15.3. Market Attractiveness Analysis 15.3.1. By Country 15.3.2. By Product 15.3.3. By Technology 15.3.4. By Application 15.3.5. By Implementation 15.3.6. By Detection Range 15.4. Key Takeaways 16. East Asia Market Analysis 2019 to 2023 and Forecast 2024 to 2034, By Country 16.1. Historical Market Size Value (US$ Million) & Volume (Units) Trend Analysis By Market Taxonomy, 2019 to 2023 16.2. Market Size Value (US$ Million) & Volume (Units) Forecast By Market Taxonomy, 2024 to 2034 16.2.1. By Country 16.2.1.1. China 16.2.1.2. Japan 16.2.1.3. South Korea 16.2.2. By Product 16.2.3. By Technology 16.2.4. By Application 16.2.5. By Implementation 16.2.6. By Detection Range 16.3. Market Attractiveness Analysis 16.3.1. By Country 16.3.2. By Product 16.3.3. By Technology 16.3.4. By Application 16.3.5. By Implementation 16.3.6. By Detection Range 16.4. Key Takeaways 17. Middle East and Africa Market Analysis 2019 to 2023 and Forecast 2024 to 2034, By Country 17.1. Historical Market Size Value (US$ Million) & Volume (Units) Trend Analysis By Market Taxonomy, 2019 to 2023 17.2. Market Size Value (US$ Million) & Volume (Units) Forecast By Market Taxonomy, 2024 to 2034 17.2.1. By Country 17.2.1.1. GCC Countries 17.2.1.2. South Africa 17.2.1.3. Israel 17.2.1.4. Rest of MEA 17.2.2. By Product 17.2.3. By Technology 17.2.4. By Application 17.2.5. By Implementation 17.2.6. By Detection Range 17.3. Market Attractiveness Analysis 17.3.1. By Country 17.3.2. By Product 17.3.3. By Technology 17.3.4. By Application 17.3.5. By Implementation 17.3.6. By Detection Range 17.4. Key Takeaways 18. Key Countries Market Analysis 18.1. USA 18.1.1. Pricing Analysis 18.1.2. Market Share Analysis, 2023 18.1.2.1. By Product 18.1.2.2. By Technology 18.1.2.3. By Application 18.1.2.4. By Implementation 18.1.2.5. By Detection Range 18.2. Canada 18.2.1. Pricing Analysis 18.2.2. Market Share Analysis, 2023 18.2.2.1. By Product 18.2.2.2. By Technology 18.2.2.3. By Application 18.2.2.4. By Implementation 18.2.2.5. By Detection Range 18.3. Brazil 18.3.1. Pricing Analysis 18.3.2. Market Share Analysis, 2023 18.3.2.1. By Product 18.3.2.2. By Technology 18.3.2.3. By Application 18.3.2.4. By Implementation 18.3.2.5. By Detection Range 18.4. Mexico 18.4.1. Pricing Analysis 18.4.2. Market Share Analysis, 2023 18.4.2.1. By Product 18.4.2.2. By Technology 18.4.2.3. By Application 18.4.2.4. By Implementation 18.4.2.5. By Detection Range 18.5. Germany 18.5.1. Pricing Analysis 18.5.2. Market Share Analysis, 2023 18.5.2.1. By Product 18.5.2.2. By Technology 18.5.2.3. By Application 18.5.2.4. By Implementation 18.5.2.5. By Detection Range 18.6. UK 18.6.1. Pricing Analysis 18.6.2. Market Share Analysis, 2023 18.6.2.1. By Product 18.6.2.2. By Technology 18.6.2.3. By Application 18.6.2.4. By Implementation 18.6.2.5. By Detection Range 18.7. France 18.7.1. Pricing Analysis 18.7.2. Market Share Analysis, 2023 18.7.2.1. By Product 18.7.2.2. By Technology 18.7.2.3. By Application 18.7.2.4. By Implementation 18.7.2.5. By Detection Range 18.8. Spain 18.8.1. Pricing Analysis 18.8.2. Market Share Analysis, 2023 18.8.2.1. By Product 18.8.2.2. By Technology 18.8.2.3. By Application 18.8.2.4. By Implementation 18.8.2.5. By Detection Range 18.9. Italy 18.9.1. Pricing Analysis 18.9.2. Market Share Analysis, 2023 18.9.2.1. By Product 18.9.2.2. By Technology 18.9.2.3. By Application 18.9.2.4. By Implementation 18.9.2.5. By Detection Range 18.10. Poland 18.10.1. Pricing Analysis 18.10.2. Market Share Analysis, 2023 18.10.2.1. By Product 18.10.2.2. By Technology 18.10.2.3. By Application 18.10.2.4. By Implementation 18.10.2.5. By Detection Range 18.11. Russia 18.11.1. Pricing Analysis 18.11.2. Market Share Analysis, 2023 18.11.2.1. By Product 18.11.2.2. By Technology 18.11.2.3. By Application 18.11.2.4. By Implementation 18.11.2.5. By Detection Range 18.12. Czech Republic 18.12.1. Pricing Analysis 18.12.2. Market Share Analysis, 2023 18.12.2.1. By Product 18.12.2.2. By Technology 18.12.2.3. By Application 18.12.2.4. By Implementation 18.12.2.5. By Detection Range 18.13. Romania 18.13.1. Pricing Analysis 18.13.2. Market Share Analysis, 2023 18.13.2.1. By Product 18.13.2.2. By Technology 18.13.2.3. By Application 18.13.2.4. By Implementation 18.13.2.5. By Detection Range 18.14. India 18.14.1. Pricing Analysis 18.14.2. Market Share Analysis, 2023 18.14.2.1. By Product 18.14.2.2. By Technology 18.14.2.3. By Application 18.14.2.4. By Implementation 18.14.2.5. By Detection Range 18.15. Bangladesh 18.15.1. Pricing Analysis 18.15.2. Market Share Analysis, 2023 18.15.2.1. By Product 18.15.2.2. By Technology 18.15.2.3. By Application 18.15.2.4. By Implementation 18.15.2.5. By Detection Range 18.16. Australia 18.16.1. Pricing Analysis 18.16.2. Market Share Analysis, 2023 18.16.2.1. By Product 18.16.2.2. By Technology 18.16.2.3. By Application 18.16.2.4. By Implementation 18.16.2.5. By Detection Range 18.17. New Zealand 18.17.1. Pricing Analysis 18.17.2. Market Share Analysis, 2023 18.17.2.1. By Product 18.17.2.2. By Technology 18.17.2.3. By Application 18.17.2.4. By Implementation 18.17.2.5. By Detection Range 18.18. China 18.18.1. Pricing Analysis 18.18.2. Market Share Analysis, 2023 18.18.2.1. By Product 18.18.2.2. By Technology 18.18.2.3. By Application 18.18.2.4. By Implementation 18.18.2.5. By Detection Range 18.19. Japan 18.19.1. Pricing Analysis 18.19.2. Market Share Analysis, 2023 18.19.2.1. By Product 18.19.2.2. By Technology 18.19.2.3. By Application 18.19.2.4. By Implementation 18.19.2.5. By Detection Range 18.20. South Korea 18.20.1. Pricing Analysis 18.20.2. Market Share Analysis, 2023 18.20.2.1. By Product 18.20.2.2. By Technology 18.20.2.3. By Application 18.20.2.4. By Implementation 18.20.2.5. By Detection Range 18.21. GCC Countries 18.21.1. Pricing Analysis 18.21.2. Market Share Analysis, 2023 18.21.2.1. By Product 18.21.2.2. By Technology 18.21.2.3. By Application 18.21.2.4. By Implementation 18.21.2.5. By Detection Range 18.22. South Africa 18.22.1. Pricing Analysis 18.22.2. Market Share Analysis, 2023 18.22.2.1. By Product 18.22.2.2. By Technology 18.22.2.3. By Application 18.22.2.4. By Implementation 18.22.2.5. By Detection Range 18.23. Israel 18.23.1. Pricing Analysis 18.23.2. Market Share Analysis, 2023 18.23.2.1. By Product 18.23.2.2. By Technology 18.23.2.3. By Application 18.23.2.4. By Implementation 18.23.2.5. By Detection Range 19. Market Structure Analysis 19.1. Competition Dashboard 19.2. Competition Benchmarking 19.3. Market Share Analysis of Top Players 19.3.1. By Regional 19.3.2. By Product 19.3.3. By Technology 19.3.4. By Application 19.3.5. By Implementation 19.3.6. By Detection Range 20. Competition Analysis 20.1. Competition Deep Dive 20.1.1. MSA Safety Incorporated 20.1.1.1. Overview 20.1.1.2. Product Portfolio 20.1.1.3. Profitability by Market Segments 20.1.1.4. Sales Footprint 20.1.1.5. Strategy Overview 20.1.1.5.1. Marketing Strategy 20.1.1.5.2. Product Strategy 20.1.1.5.3. Channel Strategy 20.1.2. Drägerwerk AG & Co. KGaA 20.1.2.1. Overview 20.1.2.2. Product Portfolio 20.1.2.3. Profitability by Market Segments 20.1.2.4. Sales Footprint 20.1.2.5. Strategy Overview 20.1.2.5.1. Marketing Strategy 20.1.2.5.2. Product Strategy 20.1.2.5.3. Channel Strategy 20.1.3. Honeywell International Inc. 20.1.3.1. Overview 20.1.3.2. Product Portfolio 20.1.3.3. Profitability by Market Segments 20.1.3.4. Sales Footprint 20.1.3.5. Strategy Overview 20.1.3.5.1. Marketing Strategy 20.1.3.5.2. Product Strategy 20.1.3.5.3. Channel Strategy 20.1.4. RAE Systems Inc. 20.1.4.1. Overview 20.1.4.2. Product Portfolio 20.1.4.3. Profitability by Market Segments 20.1.4.4. Sales Footprint 20.1.4.5. Strategy Overview 20.1.4.5.1. Marketing Strategy 20.1.4.5.2. Product Strategy 20.1.4.5.3. Channel Strategy 20.1.5. Emerson Electric Co. 20.1.5.1. Overview 20.1.5.2. Product Portfolio 20.1.5.3. Profitability by Market Segments 20.1.5.4. Sales Footprint 20.1.5.5. Strategy Overview 20.1.5.5.1. Marketing Strategy 20.1.5.5.2. Product Strategy 20.1.5.5.3. Channel Strategy 20.1.6. Sierra Monitor Corporation 20.1.6.1. Overview 20.1.6.2. Product Portfolio 20.1.6.3. Profitability by Market Segments 20.1.6.4. Sales Footprint 20.1.6.5. Strategy Overview 20.1.6.5.1. Marketing Strategy 20.1.6.5.2. Product Strategy 20.1.6.5.3. Channel Strategy 20.1.7. Industrial Scientific Corporation 20.1.7.1. Overview 20.1.7.2. Product Portfolio 20.1.7.3. Profitability by Market Segments 20.1.7.4. Sales Footprint 20.1.7.5. Strategy Overview 20.1.7.5.1. Marketing Strategy 20.1.7.5.2. Product Strategy 20.1.7.5.3. Channel Strategy 20.1.8. City Technology Ltd. 20.1.8.1. Overview 20.1.8.2. Product Portfolio 20.1.8.3. Profitability by Market Segments 20.1.8.4. Sales Footprint 20.1.8.5. Strategy Overview 20.1.8.5.1. Marketing Strategy 20.1.8.5.2. Product Strategy 20.1.8.5.3. Channel Strategy 20.1.9. RKI Instruments, Inc. 20.1.9.1. Overview 20.1.9.2. Product Portfolio 20.1.9.3. Profitability by Market Segments 20.1.9.4. Sales Footprint 20.1.9.5. Strategy Overview 20.1.9.5.1. Marketing Strategy 20.1.9.5.2. Product Strategy 20.1.9.5.3. Channel Strategy 20.1.10. Det-Tronics Corporation 20.1.10.1. Overview 20.1.10.2. Product Portfolio 20.1.10.3. Profitability by Market Segments 20.1.10.4. Sales Footprint 20.1.10.5. Strategy Overview 20.1.10.5.1. Marketing Strategy 20.1.10.5.2. Product Strategy 20.1.10.5.3. Channel Strategy 20.1.11. Teledyne Technologies 20.1.11.1. Overview 20.1.11.2. Product Portfolio 20.1.11.3. Profitability by Market Segments 20.1.11.4. Sales Footprint 20.1.11.5. Strategy Overview 20.1.11.5.1. Marketing Strategy 20.1.11.5.2. Product Strategy 20.1.11.5.3. Channel Strategy 20.1.12. Honeywell International 20.1.12.1. Overview 20.1.12.2. Product Portfolio 20.1.12.3. Profitability by Market Segments 20.1.12.4. Sales Footprint 20.1.12.5. Strategy Overview 20.1.12.5.1. Marketing Strategy 20.1.12.5.2. Product Strategy 20.1.12.5.3. Channel Strategy 20.1.13. Figaro Engineering 20.1.13.1. Overview 20.1.13.2. Product Portfolio 20.1.13.3. Profitability by Market Segments 20.1.13.4. Sales Footprint 20.1.13.5. Strategy Overview 20.1.13.5.1. Marketing Strategy 20.1.13.5.2. Product Strategy 20.1.13.5.3. Channel Strategy 20.1.14. H2Scan Corporation 20.1.14.1. Overview 20.1.14.2. Product Portfolio 20.1.14.3. Profitability by Market Segments 20.1.14.4. Sales Footprint 20.1.14.5. Strategy Overview 20.1.14.5.1. Marketing Strategy 20.1.14.5.2. Product Strategy 20.1.14.5.3. Channel Strategy 20.1.15. NevadaNano 20.1.15.1. Overview 20.1.15.2. Product Portfolio 20.1.15.3. Profitability by Market Segments 20.1.15.4. Sales Footprint 20.1.15.5. Strategy Overview 20.1.15.5.1. Marketing Strategy 20.1.15.5.2. Product Strategy 20.1.15.5.3. Channel Strategy 20.1.16. Hydrogen Sense Technology 20.1.16.1. Overview 20.1.16.2. Product Portfolio 20.1.16.3. Profitability by Market Segments 20.1.16.4. Sales Footprint 20.1.16.5. Strategy Overview 20.1.16.5.1. Marketing Strategy 20.1.16.5.2. Product Strategy 20.1.16.5.3. Channel Strategy 20.1.17. Membrapor 20.1.17.1. Overview 20.1.17.2. Product Portfolio 20.1.17.3. Profitability by Market Segments 20.1.17.4. Sales Footprint 20.1.17.5. Strategy Overview 20.1.17.5.1. Marketing Strategy 20.1.17.5.2. Product Strategy 20.1.17.5.3. Channel Strategy 21. Assumptions & Acronyms Used 22. Research Methodology
Don't pay for what you don't need
Customize your report by selecting specific countries or regions and save 30%!
Table 1: Global Market Value (US$ Million) Forecast by Region, 2019 to 2034 Table 2: Global Market Volume (Units) Forecast by Region, 2019 to 2034 Table 3: Global Market Value (US$ Million) Forecast by Product, 2019 to 2034 Table 4: Global Market Volume (Units) Forecast by Product, 2019 to 2034 Table 5: Global Market Value (US$ Million) Forecast by Technology, 2019 to 2034 Table 6: Global Market Volume (Units) Forecast by Technology, 2019 to 2034 Table 7: Global Market Value (US$ Million) Forecast by Application, 2019 to 2034 Table 8: Global Market Volume (Units) Forecast by Application, 2019 to 2034 Table 9: Global Market Value (US$ Million) Forecast by Implementation, 2019 to 2034 Table 10: Global Market Volume (Units) Forecast by Implementation, 2019 to 2034 Table 11: Global Market Value (US$ Million) Forecast by Detection Range, 2019 to 2034 Table 12: Global Market Volume (Units) Forecast by Detection Range, 2019 to 2034 Table 13: North America Market Value (US$ Million) Forecast by Country, 2019 to 2034 Table 14: North America Market Volume (Units) Forecast by Country, 2019 to 2034 Table 15: North America Market Value (US$ Million) Forecast by Product, 2019 to 2034 Table 16: North America Market Volume (Units) Forecast by Product, 2019 to 2034 Table 17: North America Market Value (US$ Million) Forecast by Technology, 2019 to 2034 Table 18: North America Market Volume (Units) Forecast by Technology, 2019 to 2034 Table 19: North America Market Value (US$ Million) Forecast by Application, 2019 to 2034 Table 20: North America Market Volume (Units) Forecast by Application, 2019 to 2034 Table 21: North America Market Value (US$ Million) Forecast by Implementation, 2019 to 2034 Table 22: North America Market Volume (Units) Forecast by Implementation, 2019 to 2034 Table 23: North America Market Value (US$ Million) Forecast by Detection Range, 2019 to 2034 Table 24: North America Market Volume (Units) Forecast by Detection Range, 2019 to 2034 Table 25: Latin America Market Value (US$ Million) Forecast by Country, 2019 to 2034 Table 26: Latin America Market Volume (Units) Forecast by Country, 2019 to 2034 Table 27: Latin America Market Value (US$ Million) Forecast by Product, 2019 to 2034 Table 28: Latin America Market Volume (Units) Forecast by Product, 2019 to 2034 Table 29: Latin America Market Value (US$ Million) Forecast by Technology, 2019 to 2034 Table 30: Latin America Market Volume (Units) Forecast by Technology, 2019 to 2034 Table 31: Latin America Market Value (US$ Million) Forecast by Application, 2019 to 2034 Table 32: Latin America Market Volume (Units) Forecast by Application, 2019 to 2034 Table 33: Latin America Market Value (US$ Million) Forecast by Implementation, 2019 to 2034 Table 34: Latin America Market Volume (Units) Forecast by Implementation, 2019 to 2034 Table 35: Latin America Market Value (US$ Million) Forecast by Detection Range, 2019 to 2034 Table 36: Latin America Market Volume (Units) Forecast by Detection Range, 2019 to 2034 Table 37: Western Europe Market Value (US$ Million) Forecast by Country, 2019 to 2034 Table 38: Western Europe Market Volume (Units) Forecast by Country, 2019 to 2034 Table 39: Western Europe Market Value (US$ Million) Forecast by Product, 2019 to 2034 Table 40: Western Europe Market Volume (Units) Forecast by Product, 2019 to 2034 Table 41: Western Europe Market Value (US$ Million) Forecast by Technology, 2019 to 2034 Table 42: Western Europe Market Volume (Units) Forecast by Technology, 2019 to 2034 Table 43: Western Europe Market Value (US$ Million) Forecast by Application, 2019 to 2034 Table 44: Western Europe Market Volume (Units) Forecast by Application, 2019 to 2034 Table 45: Western Europe Market Value (US$ Million) Forecast by Implementation, 2019 to 2034 Table 46: Western Europe Market Volume (Units) Forecast by Implementation, 2019 to 2034 Table 47: Western Europe Market Value (US$ Million) Forecast by Detection Range, 2019 to 2034 Table 48: Western Europe Market Volume (Units) Forecast by Detection Range, 2019 to 2034 Table 49: Eastern Europe Market Value (US$ Million) Forecast by Country, 2019 to 2034 Table 50: Eastern Europe Market Volume (Units) Forecast by Country, 2019 to 2034 Table 51: Eastern Europe Market Value (US$ Million) Forecast by Product, 2019 to 2034 Table 52: Eastern Europe Market Volume (Units) Forecast by Product, 2019 to 2034 Table 53: Eastern Europe Market Value (US$ Million) Forecast by Technology, 2019 to 2034 Table 54: Eastern Europe Market Volume (Units) Forecast by Technology, 2019 to 2034 Table 55: Eastern Europe Market Value (US$ Million) Forecast by Application, 2019 to 2034 Table 56: Eastern Europe Market Volume (Units) Forecast by Application, 2019 to 2034 Table 57: Eastern Europe Market Value (US$ Million) Forecast by Implementation, 2019 to 2034 Table 58: Eastern Europe Market Volume (Units) Forecast by Implementation, 2019 to 2034 Table 59: Eastern Europe Market Value (US$ Million) Forecast by Detection Range, 2019 to 2034 Table 60: Eastern Europe Market Volume (Units) Forecast by Detection Range, 2019 to 2034 Table 61: South Asia and Pacific Market Value (US$ Million) Forecast by Country, 2019 to 2034 Table 62: South Asia and Pacific Market Volume (Units) Forecast by Country, 2019 to 2034 Table 63: South Asia and Pacific Market Value (US$ Million) Forecast by Product, 2019 to 2034 Table 64: South Asia and Pacific Market Volume (Units) Forecast by Product, 2019 to 2034 Table 65: South Asia and Pacific Market Value (US$ Million) Forecast by Technology, 2019 to 2034 Table 66: South Asia and Pacific Market Volume (Units) Forecast by Technology, 2019 to 2034 Table 67: South Asia and Pacific Market Value (US$ Million) Forecast by Application, 2019 to 2034 Table 68: South Asia and Pacific Market Volume (Units) Forecast by Application, 2019 to 2034 Table 69: South Asia and Pacific Market Value (US$ Million) Forecast by Implementation, 2019 to 2034 Table 70: South Asia and Pacific Market Volume (Units) Forecast by Implementation, 2019 to 2034 Table 71: South Asia and Pacific Market Value (US$ Million) Forecast by Detection Range, 2019 to 2034 Table 72: South Asia and Pacific Market Volume (Units) Forecast by Detection Range, 2019 to 2034 Table 73: East Asia Market Value (US$ Million) Forecast by Country, 2019 to 2034 Table 74: East Asia Market Volume (Units) Forecast by Country, 2019 to 2034 Table 75: East Asia Market Value (US$ Million) Forecast by Product, 2019 to 2034 Table 76: East Asia Market Volume (Units) Forecast by Product, 2019 to 2034 Table 77: East Asia Market Value (US$ Million) Forecast by Technology, 2019 to 2034 Table 78: East Asia Market Volume (Units) Forecast by Technology, 2019 to 2034 Table 79: East Asia Market Value (US$ Million) Forecast by Application, 2019 to 2034 Table 80: East Asia Market Volume (Units) Forecast by Application, 2019 to 2034 Table 81: East Asia Market Value (US$ Million) Forecast by Implementation, 2019 to 2034 Table 82: East Asia Market Volume (Units) Forecast by Implementation, 2019 to 2034 Table 83: East Asia Market Value (US$ Million) Forecast by Detection Range, 2019 to 2034 Table 84: East Asia Market Volume (Units) Forecast by Detection Range, 2019 to 2034 Table 85: Middle East and Africa Market Value (US$ Million) Forecast by Country, 2019 to 2034 Table 86: Middle East and Africa Market Volume (Units) Forecast by Country, 2019 to 2034 Table 87: Middle East and Africa Market Value (US$ Million) Forecast by Product, 2019 to 2034 Table 88: Middle East and Africa Market Volume (Units) Forecast by Product, 2019 to 2034 Table 89: Middle East and Africa Market Value (US$ Million) Forecast by Technology, 2019 to 2034 Table 90: Middle East and Africa Market Volume (Units) Forecast by Technology, 2019 to 2034 Table 91: Middle East and Africa Market Value (US$ Million) Forecast by Application, 2019 to 2034 Table 92: Middle East and Africa Market Volume (Units) Forecast by Application, 2019 to 2034 Table 93: Middle East and Africa Market Value (US$ Million) Forecast by Implementation, 2019 to 2034 Table 94: Middle East and Africa Market Volume (Units) Forecast by Implementation, 2019 to 2034 Table 95: Middle East and Africa Market Value (US$ Million) Forecast by Detection Range, 2019 to 2034 Table 96: Middle East and Africa Market Volume (Units) Forecast by Detection Range, 2019 to 2034
Figure 1: Global Market Value (US$ Million) by Product, 2024 to 2034 Figure 2: Global Market Value (US$ Million) by Technology, 2024 to 2034 Figure 3: Global Market Value (US$ Million) by Application, 2024 to 2034 Figure 4: Global Market Value (US$ Million) by Implementation, 2024 to 2034 Figure 5: Global Market Value (US$ Million) by Detection Range, 2024 to 2034 Figure 6: Global Market Value (US$ Million) by Region, 2024 to 2034 Figure 7: Global Market Value (US$ Million) Analysis by Region, 2019 to 2034 Figure 8: Global Market Volume (Units) Analysis by Region, 2019 to 2034 Figure 9: Global Market Value Share (%) and BPS Analysis by Region, 2024 to 2034 Figure 10: Global Market Y-o-Y Growth (%) Projections by Region, 2024 to 2034 Figure 11: Global Market Value (US$ Million) Analysis by Product, 2019 to 2034 Figure 12: Global Market Volume (Units) Analysis by Product, 2019 to 2034 Figure 13: Global Market Value Share (%) and BPS Analysis by Product, 2024 to 2034 Figure 14: Global Market Y-o-Y Growth (%) Projections by Product, 2024 to 2034 Figure 15: Global Market Value (US$ Million) Analysis by Technology, 2019 to 2034 Figure 16: Global Market Volume (Units) Analysis by Technology, 2019 to 2034 Figure 17: Global Market Value Share (%) and BPS Analysis by Technology, 2024 to 2034 Figure 18: Global Market Y-o-Y Growth (%) Projections by Technology, 2024 to 2034 Figure 19: Global Market Value (US$ Million) Analysis by Application, 2019 to 2034 Figure 20: Global Market Volume (Units) Analysis by Application, 2019 to 2034 Figure 21: Global Market Value Share (%) and BPS Analysis by Application, 2024 to 2034 Figure 22: Global Market Y-o-Y Growth (%) Projections by Application, 2024 to 2034 Figure 23: Global Market Value (US$ Million) Analysis by Implementation, 2019 to 2034 Figure 24: Global Market Volume (Units) Analysis by Implementation, 2019 to 2034 Figure 25: Global Market Value Share (%) and BPS Analysis by Implementation, 2024 to 2034 Figure 26: Global Market Y-o-Y Growth (%) Projections by Implementation, 2024 to 2034 Figure 27: Global Market Value (US$ Million) Analysis by Detection Range, 2019 to 2034 Figure 28: Global Market Volume (Units) Analysis by Detection Range, 2019 to 2034 Figure 29: Global Market Value Share (%) and BPS Analysis by Detection Range, 2024 to 2034 Figure 30: Global Market Y-o-Y Growth (%) Projections by Detection Range, 2024 to 2034 Figure 31: Global Market Attractiveness by Product, 2024 to 2034 Figure 32: Global Market Attractiveness by Technology, 2024 to 2034 Figure 33: Global Market Attractiveness by Application, 2024 to 2034 Figure 34: Global Market Attractiveness by Implementation, 2024 to 2034 Figure 35: Global Market Attractiveness by Detection Range, 2024 to 2034 Figure 36: Global Market Attractiveness by Region, 2024 to 2034 Figure 37: North America Market Value (US$ Million) by Product, 2024 to 2034 Figure 38: North America Market Value (US$ Million) by Technology, 2024 to 2034 Figure 39: North America Market Value (US$ Million) by Application, 2024 to 2034 Figure 40: North America Market Value (US$ Million) by Implementation, 2024 to 2034 Figure 41: North America Market Value (US$ Million) by Detection Range, 2024 to 2034 Figure 42: North America Market Value (US$ Million) by Country, 2024 to 2034 Figure 43: North America Market Value (US$ Million) Analysis by Country, 2019 to 2034 Figure 44: North America Market Volume (Units) Analysis by Country, 2019 to 2034 Figure 45: North America Market Value Share (%) and BPS Analysis by Country, 2024 to 2034 Figure 46: North America Market Y-o-Y Growth (%) Projections by Country, 2024 to 2034 Figure 47: North America Market Value (US$ Million) Analysis by Product, 2019 to 2034 Figure 48: North America Market Volume (Units) Analysis by Product, 2019 to 2034 Figure 49: North America Market Value Share (%) and BPS Analysis by Product, 2024 to 2034 Figure 50: North America Market Y-o-Y Growth (%) Projections by Product, 2024 to 2034 Figure 51: North America Market Value (US$ Million) Analysis by Technology, 2019 to 2034 Figure 52: North America Market Volume (Units) Analysis by Technology, 2019 to 2034 Figure 53: North America Market Value Share (%) and BPS Analysis by Technology, 2024 to 2034 Figure 54: North America Market Y-o-Y Growth (%) Projections by Technology, 2024 to 2034 Figure 55: North America Market Value (US$ Million) Analysis by Application, 2019 to 2034 Figure 56: North America Market Volume (Units) Analysis by Application, 2019 to 2034 Figure 57: North America Market Value Share (%) and BPS Analysis by Application, 2024 to 2034 Figure 58: North America Market Y-o-Y Growth (%) Projections by Application, 2024 to 2034 Figure 59: North America Market Value (US$ Million) Analysis by Implementation, 2019 to 2034 Figure 60: North America Market Volume (Units) Analysis by Implementation, 2019 to 2034 Figure 61: North America Market Value Share (%) and BPS Analysis by Implementation, 2024 to 2034 Figure 62: North America Market Y-o-Y Growth (%) Projections by Implementation, 2024 to 2034 Figure 63: North America Market Value (US$ Million) Analysis by Detection Range, 2019 to 2034 Figure 64: North America Market Volume (Units) Analysis by Detection Range, 2019 to 2034 Figure 65: North America Market Value Share (%) and BPS Analysis by Detection Range, 2024 to 2034 Figure 66: North America Market Y-o-Y Growth (%) Projections by Detection Range, 2024 to 2034 Figure 67: North America Market Attractiveness by Product, 2024 to 2034 Figure 68: North America Market Attractiveness by Technology, 2024 to 2034 Figure 69: North America Market Attractiveness by Application, 2024 to 2034 Figure 70: North America Market Attractiveness by Implementation, 2024 to 2034 Figure 71: North America Market Attractiveness by Detection Range, 2024 to 2034 Figure 72: North America Market Attractiveness by Country, 2024 to 2034 Figure 73: Latin America Market Value (US$ Million) by Product, 2024 to 2034 Figure 74: Latin America Market Value (US$ Million) by Technology, 2024 to 2034 Figure 75: Latin America Market Value (US$ Million) by Application, 2024 to 2034 Figure 76: Latin America Market Value (US$ Million) by Implementation, 2024 to 2034 Figure 77: Latin America Market Value (US$ Million) by Detection Range, 2024 to 2034 Figure 78: Latin America Market Value (US$ Million) by Country, 2024 to 2034 Figure 79: Latin America Market Value (US$ Million) Analysis by Country, 2019 to 2034 Figure 80: Latin America Market Volume (Units) Analysis by Country, 2019 to 2034 Figure 81: Latin America Market Value Share (%) and BPS Analysis by Country, 2024 to 2034 Figure 82: Latin America Market Y-o-Y Growth (%) Projections by Country, 2024 to 2034 Figure 83: Latin America Market Value (US$ Million) Analysis by Product, 2019 to 2034 Figure 84: Latin America Market Volume (Units) Analysis by Product, 2019 to 2034 Figure 85: Latin America Market Value Share (%) and BPS Analysis by Product, 2024 to 2034 Figure 86: Latin America Market Y-o-Y Growth (%) Projections by Product, 2024 to 2034 Figure 87: Latin America Market Value (US$ Million) Analysis by Technology, 2019 to 2034 Figure 88: Latin America Market Volume (Units) Analysis by Technology, 2019 to 2034 Figure 89: Latin America Market Value Share (%) and BPS Analysis by Technology, 2024 to 2034 Figure 90: Latin America Market Y-o-Y Growth (%) Projections by Technology, 2024 to 2034 Figure 91: Latin America Market Value (US$ Million) Analysis by Application, 2019 to 2034 Figure 92: Latin America Market Volume (Units) Analysis by Application, 2019 to 2034 Figure 93: Latin America Market Value Share (%) and BPS Analysis by Application, 2024 to 2034 Figure 94: Latin America Market Y-o-Y Growth (%) Projections by Application, 2024 to 2034 Figure 95: Latin America Market Value (US$ Million) Analysis by Implementation, 2019 to 2034 Figure 96: Latin America Market Volume (Units) Analysis by Implementation, 2019 to 2034 Figure 97: Latin America Market Value Share (%) and BPS Analysis by Implementation, 2024 to 2034 Figure 98: Latin America Market Y-o-Y Growth (%) Projections by Implementation, 2024 to 2034 Figure 99: Latin America Market Value (US$ Million) Analysis by Detection Range, 2019 to 2034 Figure 100: Latin America Market Volume (Units) Analysis by Detection Range, 2019 to 2034 Figure 101: Latin America Market Value Share (%) and BPS Analysis by Detection Range, 2024 to 2034 Figure 102: Latin America Market Y-o-Y Growth (%) Projections by Detection Range, 2024 to 2034 Figure 103: Latin America Market Attractiveness by Product, 2024 to 2034 Figure 104: Latin America Market Attractiveness by Technology, 2024 to 2034 Figure 105: Latin America Market Attractiveness by Application, 2024 to 2034 Figure 106: Latin America Market Attractiveness by Implementation, 2024 to 2034 Figure 107: Latin America Market Attractiveness by Detection Range, 2024 to 2034 Figure 108: Latin America Market Attractiveness by Country, 2024 to 2034 Figure 109: Western Europe Market Value (US$ Million) by Product, 2024 to 2034 Figure 110: Western Europe Market Value (US$ Million) by Technology, 2024 to 2034 Figure 111: Western Europe Market Value (US$ Million) by Application, 2024 to 2034 Figure 112: Western Europe Market Value (US$ Million) by Implementation, 2024 to 2034 Figure 113: Western Europe Market Value (US$ Million) by Detection Range, 2024 to 2034 Figure 114: Western Europe Market Value (US$ Million) by Country, 2024 to 2034 Figure 115: Western Europe Market Value (US$ Million) Analysis by Country, 2019 to 2034 Figure 116: Western Europe Market Volume (Units) Analysis by Country, 2019 to 2034 Figure 117: Western Europe Market Value Share (%) and BPS Analysis by Country, 2024 to 2034 Figure 118: Western Europe Market Y-o-Y Growth (%) Projections by Country, 2024 to 2034 Figure 119: Western Europe Market Value (US$ Million) Analysis by Product, 2019 to 2034 Figure 120: Western Europe Market Volume (Units) Analysis by Product, 2019 to 2034 Figure 121: Western Europe Market Value Share (%) and BPS Analysis by Product, 2024 to 2034 Figure 122: Western Europe Market Y-o-Y Growth (%) Projections by Product, 2024 to 2034 Figure 123: Western Europe Market Value (US$ Million) Analysis by Technology, 2019 to 2034 Figure 124: Western Europe Market Volume (Units) Analysis by Technology, 2019 to 2034 Figure 125: Western Europe Market Value Share (%) and BPS Analysis by Technology, 2024 to 2034 Figure 126: Western Europe Market Y-o-Y Growth (%) Projections by Technology, 2024 to 2034 Figure 127: Western Europe Market Value (US$ Million) Analysis by Application, 2019 to 2034 Figure 128: Western Europe Market Volume (Units) Analysis by Application, 2019 to 2034 Figure 129: Western Europe Market Value Share (%) and BPS Analysis by Application, 2024 to 2034 Figure 130: Western Europe Market Y-o-Y Growth (%) Projections by Application, 2024 to 2034 Figure 131: Western Europe Market Value (US$ Million) Analysis by Implementation, 2019 to 2034 Figure 132: Western Europe Market Volume (Units) Analysis by Implementation, 2019 to 2034 Figure 133: Western Europe Market Value Share (%) and BPS Analysis by Implementation, 2024 to 2034 Figure 134: Western Europe Market Y-o-Y Growth (%) Projections by Implementation, 2024 to 2034 Figure 135: Western Europe Market Value (US$ Million) Analysis by Detection Range, 2019 to 2034 Figure 136: Western Europe Market Volume (Units) Analysis by Detection Range, 2019 to 2034 Figure 137: Western Europe Market Value Share (%) and BPS Analysis by Detection Range, 2024 to 2034 Figure 138: Western Europe Market Y-o-Y Growth (%) Projections by Detection Range, 2024 to 2034 Figure 139: Western Europe Market Attractiveness by Product, 2024 to 2034 Figure 140: Western Europe Market Attractiveness by Technology, 2024 to 2034 Figure 141: Western Europe Market Attractiveness by Application, 2024 to 2034 Figure 142: Western Europe Market Attractiveness by Implementation, 2024 to 2034 Figure 143: Western Europe Market Attractiveness by Detection Range, 2024 to 2034 Figure 144: Western Europe Market Attractiveness by Country, 2024 to 2034 Figure 145: Eastern Europe Market Value (US$ Million) by Product, 2024 to 2034 Figure 146: Eastern Europe Market Value (US$ Million) by Technology, 2024 to 2034 Figure 147: Eastern Europe Market Value (US$ Million) by Application, 2024 to 2034 Figure 148: Eastern Europe Market Value (US$ Million) by Implementation, 2024 to 2034 Figure 149: Eastern Europe Market Value (US$ Million) by Detection Range, 2024 to 2034 Figure 150: Eastern Europe Market Value (US$ Million) by Country, 2024 to 2034 Figure 151: Eastern Europe Market Value (US$ Million) Analysis by Country, 2019 to 2034 Figure 152: Eastern Europe Market Volume (Units) Analysis by Country, 2019 to 2034 Figure 153: Eastern Europe Market Value Share (%) and BPS Analysis by Country, 2024 to 2034 Figure 154: Eastern Europe Market Y-o-Y Growth (%) Projections by Country, 2024 to 2034 Figure 155: Eastern Europe Market Value (US$ Million) Analysis by Product, 2019 to 2034 Figure 156: Eastern Europe Market Volume (Units) Analysis by Product, 2019 to 2034 Figure 157: Eastern Europe Market Value Share (%) and BPS Analysis by Product, 2024 to 2034 Figure 158: Eastern Europe Market Y-o-Y Growth (%) Projections by Product, 2024 to 2034 Figure 159: Eastern Europe Market Value (US$ Million) Analysis by Technology, 2019 to 2034 Figure 160: Eastern Europe Market Volume (Units) Analysis by Technology, 2019 to 2034 Figure 161: Eastern Europe Market Value Share (%) and BPS Analysis by Technology, 2024 to 2034 Figure 162: Eastern Europe Market Y-o-Y Growth (%) Projections by Technology, 2024 to 2034 Figure 163: Eastern Europe Market Value (US$ Million) Analysis by Application, 2019 to 2034 Figure 164: Eastern Europe Market Volume (Units) Analysis by Application, 2019 to 2034 Figure 165: Eastern Europe Market Value Share (%) and BPS Analysis by Application, 2024 to 2034 Figure 166: Eastern Europe Market Y-o-Y Growth (%) Projections by Application, 2024 to 2034 Figure 167: Eastern Europe Market Value (US$ Million) Analysis by Implementation, 2019 to 2034 Figure 168: Eastern Europe Market Volume (Units) Analysis by Implementation, 2019 to 2034 Figure 169: Eastern Europe Market Value Share (%) and BPS Analysis by Implementation, 2024 to 2034 Figure 170: Eastern Europe Market Y-o-Y Growth (%) Projections by Implementation, 2024 to 2034 Figure 171: Eastern Europe Market Value (US$ Million) Analysis by Detection Range, 2019 to 2034 Figure 172: Eastern Europe Market Volume (Units) Analysis by Detection Range, 2019 to 2034 Figure 173: Eastern Europe Market Value Share (%) and BPS Analysis by Detection Range, 2024 to 2034 Figure 174: Eastern Europe Market Y-o-Y Growth (%) Projections by Detection Range, 2024 to 2034 Figure 175: Eastern Europe Market Attractiveness by Product, 2024 to 2034 Figure 176: Eastern Europe Market Attractiveness by Technology, 2024 to 2034 Figure 177: Eastern Europe Market Attractiveness by Application, 2024 to 2034 Figure 178: Eastern Europe Market Attractiveness by Implementation, 2024 to 2034 Figure 179: Eastern Europe Market Attractiveness by Detection Range, 2024 to 2034 Figure 180: Eastern Europe Market Attractiveness by Country, 2024 to 2034 Figure 181: South Asia and Pacific Market Value (US$ Million) by Product, 2024 to 2034 Figure 182: South Asia and Pacific Market Value (US$ Million) by Technology, 2024 to 2034 Figure 183: South Asia and Pacific Market Value (US$ Million) by Application, 2024 to 2034 Figure 184: South Asia and Pacific Market Value (US$ Million) by Implementation, 2024 to 2034 Figure 185: South Asia and Pacific Market Value (US$ Million) by Detection Range, 2024 to 2034 Figure 186: South Asia and Pacific Market Value (US$ Million) by Country, 2024 to 2034 Figure 187: South Asia and Pacific Market Value (US$ Million) Analysis by Country, 2019 to 2034 Figure 188: South Asia and Pacific Market Volume (Units) Analysis by Country, 2019 to 2034 Figure 189: South Asia and Pacific Market Value Share (%) and BPS Analysis by Country, 2024 to 2034 Figure 190: South Asia and Pacific Market Y-o-Y Growth (%) Projections by Country, 2024 to 2034 Figure 191: South Asia and Pacific Market Value (US$ Million) Analysis by Product, 2019 to 2034 Figure 192: South Asia and Pacific Market Volume (Units) Analysis by Product, 2019 to 2034 Figure 193: South Asia and Pacific Market Value Share (%) and BPS Analysis by Product, 2024 to 2034 Figure 194: South Asia and Pacific Market Y-o-Y Growth (%) Projections by Product, 2024 to 2034 Figure 195: South Asia and Pacific Market Value (US$ Million) Analysis by Technology, 2019 to 2034 Figure 196: South Asia and Pacific Market Volume (Units) Analysis by Technology, 2019 to 2034 Figure 197: South Asia and Pacific Market Value Share (%) and BPS Analysis by Technology, 2024 to 2034 Figure 198: South Asia and Pacific Market Y-o-Y Growth (%) Projections by Technology, 2024 to 2034 Figure 199: South Asia and Pacific Market Value (US$ Million) Analysis by Application, 2019 to 2034 Figure 200: South Asia and Pacific Market Volume (Units) Analysis by Application, 2019 to 2034 Figure 201: South Asia and Pacific Market Value Share (%) and BPS Analysis by Application, 2024 to 2034 Figure 202: South Asia and Pacific Market Y-o-Y Growth (%) Projections by Application, 2024 to 2034 Figure 203: South Asia and Pacific Market Value (US$ Million) Analysis by Implementation, 2019 to 2034 Figure 204: South Asia and Pacific Market Volume (Units) Analysis by Implementation, 2019 to 2034 Figure 205: South Asia and Pacific Market Value Share (%) and BPS Analysis by Implementation, 2024 to 2034 Figure 206: South Asia and Pacific Market Y-o-Y Growth (%) Projections by Implementation, 2024 to 2034 Figure 207: South Asia and Pacific Market Value (US$ Million) Analysis by Detection Range, 2019 to 2034 Figure 208: South Asia and Pacific Market Volume (Units) Analysis by Detection Range, 2019 to 2034 Figure 209: South Asia and Pacific Market Value Share (%) and BPS Analysis by Detection Range, 2024 to 2034 Figure 210: South Asia and Pacific Market Y-o-Y Growth (%) Projections by Detection Range, 2024 to 2034 Figure 211: South Asia and Pacific Market Attractiveness by Product, 2024 to 2034 Figure 212: South Asia and Pacific Market Attractiveness by Technology, 2024 to 2034 Figure 213: South Asia and Pacific Market Attractiveness by Application, 2024 to 2034 Figure 214: South Asia and Pacific Market Attractiveness by Implementation, 2024 to 2034 Figure 215: South Asia and Pacific Market Attractiveness by Detection Range, 2024 to 2034 Figure 216: South Asia and Pacific Market Attractiveness by Country, 2024 to 2034 Figure 217: East Asia Market Value (US$ Million) by Product, 2024 to 2034 Figure 218: East Asia Market Value (US$ Million) by Technology, 2024 to 2034 Figure 219: East Asia Market Value (US$ Million) by Application, 2024 to 2034 Figure 220: East Asia Market Value (US$ Million) by Implementation, 2024 to 2034 Figure 221: East Asia Market Value (US$ Million) by Detection Range, 2024 to 2034 Figure 222: East Asia Market Value (US$ Million) by Country, 2024 to 2034 Figure 223: East Asia Market Value (US$ Million) Analysis by Country, 2019 to 2034 Figure 224: East Asia Market Volume (Units) Analysis by Country, 2019 to 2034 Figure 225: East Asia Market Value Share (%) and BPS Analysis by Country, 2024 to 2034 Figure 226: East Asia Market Y-o-Y Growth (%) Projections by Country, 2024 to 2034 Figure 227: East Asia Market Value (US$ Million) Analysis by Product, 2019 to 2034 Figure 228: East Asia Market Volume (Units) Analysis by Product, 2019 to 2034 Figure 229: East Asia Market Value Share (%) and BPS Analysis by Product, 2024 to 2034 Figure 230: East Asia Market Y-o-Y Growth (%) Projections by Product, 2024 to 2034 Figure 231: East Asia Market Value (US$ Million) Analysis by Technology, 2019 to 2034 Figure 232: East Asia Market Volume (Units) Analysis by Technology, 2019 to 2034 Figure 233: East Asia Market Value Share (%) and BPS Analysis by Technology, 2024 to 2034 Figure 234: East Asia Market Y-o-Y Growth (%) Projections by Technology, 2024 to 2034 Figure 235: East Asia Market Value (US$ Million) Analysis by Application, 2019 to 2034 Figure 236: East Asia Market Volume (Units) Analysis by Application, 2019 to 2034 Figure 237: East Asia Market Value Share (%) and BPS Analysis by Application, 2024 to 2034 Figure 238: East Asia Market Y-o-Y Growth (%) Projections by Application, 2024 to 2034 Figure 239: East Asia Market Value (US$ Million) Analysis by Implementation, 2019 to 2034 Figure 240: East Asia Market Volume (Units) Analysis by Implementation, 2019 to 2034 Figure 241: East Asia Market Value Share (%) and BPS Analysis by Implementation, 2024 to 2034 Figure 242: East Asia Market Y-o-Y Growth (%) Projections by Implementation, 2024 to 2034 Figure 243: East Asia Market Value (US$ Million) Analysis by Detection Range, 2019 to 2034 Figure 244: East Asia Market Volume (Units) Analysis by Detection Range, 2019 to 2034 Figure 245: East Asia Market Value Share (%) and BPS Analysis by Detection Range, 2024 to 2034 Figure 246: East Asia Market Y-o-Y Growth (%) Projections by Detection Range, 2024 to 2034 Figure 247: East Asia Market Attractiveness by Product, 2024 to 2034 Figure 248: East Asia Market Attractiveness by Technology, 2024 to 2034 Figure 249: East Asia Market Attractiveness by Application, 2024 to 2034 Figure 250: East Asia Market Attractiveness by Implementation, 2024 to 2034 Figure 251: East Asia Market Attractiveness by Detection Range, 2024 to 2034 Figure 252: East Asia Market Attractiveness by Country, 2024 to 2034 Figure 253: Middle East and Africa Market Value (US$ Million) by Product, 2024 to 2034 Figure 254: Middle East and Africa Market Value (US$ Million) by Technology, 2024 to 2034 Figure 255: Middle East and Africa Market Value (US$ Million) by Application, 2024 to 2034 Figure 256: Middle East and Africa Market Value (US$ Million) by Implementation, 2024 to 2034 Figure 257: Middle East and Africa Market Value (US$ Million) by Detection Range, 2024 to 2034 Figure 258: Middle East and Africa Market Value (US$ Million) by Country, 2024 to 2034 Figure 259: Middle East and Africa Market Value (US$ Million) Analysis by Country, 2019 to 2034 Figure 260: Middle East and Africa Market Volume (Units) Analysis by Country, 2019 to 2034 Figure 261: Middle East and Africa Market Value Share (%) and BPS Analysis by Country, 2024 to 2034 Figure 262: Middle East and Africa Market Y-o-Y Growth (%) Projections by Country, 2024 to 2034 Figure 263: Middle East and Africa Market Value (US$ Million) Analysis by Product, 2019 to 2034 Figure 264: Middle East and Africa Market Volume (Units) Analysis by Product, 2019 to 2034 Figure 265: Middle East and Africa Market Value Share (%) and BPS Analysis by Product, 2024 to 2034 Figure 266: Middle East and Africa Market Y-o-Y Growth (%) Projections by Product, 2024 to 2034 Figure 267: Middle East and Africa Market Value (US$ Million) Analysis by Technology, 2019 to 2034 Figure 268: Middle East and Africa Market Volume (Units) Analysis by Technology, 2019 to 2034 Figure 269: Middle East and Africa Market Value Share (%) and BPS Analysis by Technology, 2024 to 2034 Figure 270: Middle East and Africa Market Y-o-Y Growth (%) Projections by Technology, 2024 to 2034 Figure 271: Middle East and Africa Market Value (US$ Million) Analysis by Application, 2019 to 2034 Figure 272: Middle East and Africa Market Volume (Units) Analysis by Application, 2019 to 2034 Figure 273: Middle East and Africa Market Value Share (%) and BPS Analysis by Application, 2024 to 2034 Figure 274: Middle East and Africa Market Y-o-Y Growth (%) Projections by Application, 2024 to 2034 Figure 275: Middle East and Africa Market Value (US$ Million) Analysis by Implementation, 2019 to 2034 Figure 276: Middle East and Africa Market Volume (Units) Analysis by Implementation, 2019 to 2034 Figure 277: Middle East and Africa Market Value Share (%) and BPS Analysis by Implementation, 2024 to 2034 Figure 278: Middle East and Africa Market Y-o-Y Growth (%) Projections by Implementation, 2024 to 2034 Figure 279: Middle East and Africa Market Value (US$ Million) Analysis by Detection Range, 2019 to 2034 Figure 280: Middle East and Africa Market Volume (Units) Analysis by Detection Range, 2019 to 2034 Figure 281: Middle East and Africa Market Value Share (%) and BPS Analysis by Detection Range, 2024 to 2034 Figure 282: Middle East and Africa Market Y-o-Y Growth (%) Projections by Detection Range, 2024 to 2034 Figure 283: Middle East and Africa Market Attractiveness by Product, 2024 to 2034 Figure 284: Middle East and Africa Market Attractiveness by Technology, 2024 to 2034 Figure 285: Middle East and Africa Market Attractiveness by Application, 2024 to 2034 Figure 286: Middle East and Africa Market Attractiveness by Implementation, 2024 to 2034 Figure 287: Middle East and Africa Market Attractiveness by Detection Range, 2024 to 2034 Figure 288: Middle East and Africa Market Attractiveness by Country, 2024 to 2034
Recommendations
Explore Industrial Automation Insights
View Reports