Reports

- Global Locations -

Headquarters

Future Market Insights, Inc.

Christiana Corporate, 200
Continental Drive, Suite 401,
Newark, Delaware - 19713,
United States

T: +1-845-579-5705

Americas

Future Market Insights, Inc.

616 Corporate Way, Suite 2-9018,
Valley Cottage, NY 10989, United States

T: +1-347-918-3531

MEA

Future Market Insights

1602-6 Jumeirah Bay X2 Tower, Plot No: JLT-PH2-X2A,
Jumeirah Lakes Towers, Dubai,
United Arab Emirates

Europe

Future Market Insights

3rd Floor, 207 Regent Street,
W1B 3HH London
United Kingdom

T: + 44 (0) 20 8123 9659
D: +44 (0) 20 3287 4268

Asia Pacific

Future Market Insights

IndiaLand Global Tech Park, Unit UG-1, Behind Grand HighStreet, Phase 1, Hinjawadi, MH, Pune – 411057, India

Anhydrous Hydrogen Fluoride Market Snapshot (2023 to 2033)

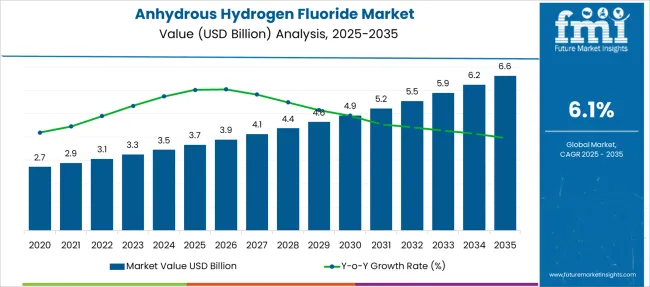
The global anhydrous hydrogen fluoride market is expected to be worth US$ 3.25 Billion in the fiscal year 2023, up from US$ 3.07 Billion in the fiscal year 2022. From 2023 to 2033, the market is expected to grow at a 5.8% CAGR, reaching a value of US$ 5.7 Billion by the end of 2033.

During the projected period, the market expansion is predicted to be driven by rising consumer demand for items such as refrigerator gasses, air conditioners, electronics, and cars. In addition, it is projected that the expanding chemical sector in the region, together with expanding production facilities, subsidiaries, and a number of mergers and acquisitions, would fuel demand for the product. For instance, Arkema collaborated with the enormous fertilizer manufacturer Nutrien Ltd. to secure anhydrous hydrogen fluoride supplies.

The primary raw material utilized to create anhydrous hydrogen fluoride is the fluorspar. China mines 2,500 ktons of acid-grade fluorspar yearly, surpassing any other nation in the world, according to the national renewable energy laboratory (USGS 2017). South Africa and Mexico are the next two biggest producers of acid-grade fluorspar, each producing around 600 ktons yearly (150 ktons).

Due to the rapid expansion of the chemical and consumer products industries, anhydrous hydrogen fluoride has become one of the world's fastest-growing markets. Furthermore, North America has seen a growth in demand because of the region's expanding chemical manufacturing sector, while Asia Pacific has seen a surge in demand for fluorine compounds used in metal extraction as well as metallurgical applications.

Attributes Details
Anticipated Base Year Value (2022) US$ 3.07 Billion
Expected Market Value (2023) US$ 3.25 Billion
Projected Forecast Value (2033) US$ 5.7 Billion
Global Growth Rate (2023 to 2033) 5.8%
CAGR of North America (2023) 6.1%
CAGR of APAC (2023 to 2033) 5.6%

Don't pay for what you don't need

Customize your report by selecting specific countries or regions and save 30%!

2018 to 2022 Anhydrous Hydrogen Fluoride Market Demand Analysis Vs. Forecast 2023 to 2033

The global anhydrous hydrogen fluoride market grew at a CAGR of 3.7% from 2018 to 2022, as per Future Market Insights, a provider of market research and competitive intelligence. During the anticipated period, rising consumer demand for the benefits of these materials is predicted to drive up the anhydrous hydrogen fluoride market demand.

Anhydrous hydrogen fluoride is now more in demand than ever before since it is a necessary ingredient in the production of several fluorine-containing compounds. These compounds are used in many things, including kitchenware and automobiles.

Teflon, a fluoropolymer, is widely utilized in a range of applications including semiconductors, domestic cookware, textiles, electrical appliances, and vehicles due to its high thermal stability, superior chemical resistance, as well as efficient electrical qualities. Such benefits are expected to boost the demand for anhydrous hydrogen fluoride globally during the forecast period.

Prominent Growth Drivers Influencing anhydrous hydrogen fluoride market

Rising consumer goods demand being produced from anhydrous hydrogen fluoride materials to accelerate industry growth

Anhydrous hydrogen fluoride is used to make a variety of fluorine-containing compounds. The strong demand for consumer goods materials made from anhydrous hydrogen fluoride may help the sector thrive.

Furthermore, the growing use of anhydrous hydrogen fluoride in a variety of contemporary applications is expected to boost sales. Furthermore, the growing usage of gas in the production of aluminum, electrical components, high-octane gasoline, fluorescent light bulbs, plastic goods, medicines, refrigerants, and herbicides is likely to drive up anhydrous hydrogen fluoride demand. These reasons might propel the anhydrous hydrogen fluoride market forward.

Wide application of fluoro gases to boost the demand

The widespread usage of fluoro gases in the production of HFCs, CFCs, and HCFCs used in refrigeration equipment, ventilation, heating, and air-conditioning (HVAC) systems, self-chilling beverage cans, and defrost systems supports the expansion of the anhydrous hydrogen fluoride market.

Vapor compression systems are the dominating technology for commercial, residential, as well as mobile air conditioning and refrigeration. Furthermore, due to the ease and ample availability of huge amounts of raw resources such as fluorite, producers of anhydrous hydrogen fluoride are increasing their production facilities internationally. Thus, during the projection period, it is predicted that the global market for anhydrous hydrogen fluoride would grow as a result of such factors globally.

Nikhil Kaitwade
Nikhil Kaitwade

Principal Consultant

Talk to Analyst

Find your sweet spots for generating winning opportunities in this market.

What Could Possibly Hinder Anhydrous Hydrogen Fluoride Market Demand?

Strict Regulation on the usage of these products will hinder Market Growth

Hydrogen fluoride is being consumed by a number of commercial and industrial products. Hence, when the gas is released directly into the air, it causes harmful environmental impacts. Such factors have led to the formation of strict government laws on the usage of these products.

Other declining reasons include the limited availability of fluorspar. The production of hydrogen fluoride is anticipated to decrease as fluorspar supplies decline. Also Even at low concentrations, hydrogen fluoride gas can irritate the respiratory system, nose, and eyes. High concentrations of hydrogen fluoride inhaled, together with skin contact, can result in irregular heartbeats and fluid accumulation in the lungs, which can lead to death. Such elements are predicted to impede market expansion from 2023 to 2033.

Region-wise Analysis

What is the outlook for the North American anhydrous hydrogen fluoride market?

Demand for Chemicals and Presence of key players to propel the Regional Demand

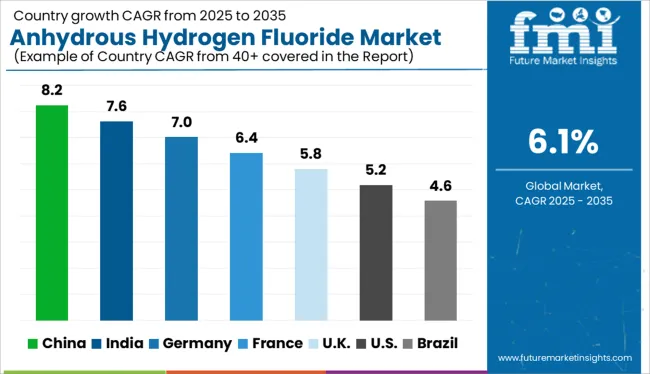
North America is predicted to expand with a revenue share of 29.5% in 2023 and is the fastest-growing market for anhydrous hydrogen fluoride, with a 6.1% CAGR from 2023 to 2033. This is justified by the region's abundance of chemical makers. The USA produces the most anhydrous hydrogen fluoride in North America due to the area's developed chemical sector and the expanding production capacity of significant firms like Solvay S.A.

The demand for chemicals used in metal extraction and metallurgical applications has increased in the USA. Over the projected period, it is predicted that this would eventually help the anhydrous hydrogen fluoride business in the USA flourish. Due to the simple and sufficient access to huge quantities of raw materials like fluorite, the production of fluorochemicals has significantly increased in the USA, supporting the market's expansion.

As a result, producers of anhydrous hydrogen fluoride are moving and expanding their facilities to the USA. The market for anhydrous hydrogen fluoride is expanding in the country as a result of the USA's rising demand for electrical goods like air conditioners and refrigerators.

What can be expected from the Asia Pacific market for Anhydrous Hydrogen Fluoride?

Increased usage across various sectors will boost the demand during the forecast period

With a 42% revenue share in 2023, Asia Pacific is anticipated to dominate the anhydrous hydrogen fluoride market. This is due to an increased demand for anhydrous hydrogen fluoride from the region's application industries, particularly the consumer goods, electronics, and automotive sectors. The expansion of these businesses in the area is attributed to the region's growing population as well as its inhabitants' rising standard of living.

In Asia Pacific, the laws governing the manufacturing and use of fluorine-based chemicals are weak, which encourages end-use businesses to produce and employ anhydrous hydrogen fluoride, fueling the product market's explosive expansion. Anhydrous hydrogen fluoride is commonly used in the manufacture of stainless steel, aluminum, and alloy for pickling and descaling different metals, so the rising mining-related activities in nations like China and India due to the abundance of mineral ores will ultimately boost the market in the region.

Due to the region's abundance of enormous agricultural lands and rising food demand, the pesticides, as well as crop protection business, is one of the fastest expanding sectors in the Asia Pacific. Since most pesticides created are fluorine-containing substances like hydrogen fluoride, this is pushing the demand for anhydrous hydrogen fluoride in nations like China and India with a global CAGR of 5.6% during the forecast period.

Get the data you need at a Fraction of the cost

Personalize your report by choosing insights you need
and save 40%!

Category-wise Insights

Which application segment is expected to gain traction from 2023 to 2033?

The fluoro gases segment will gain the Dominant Market Share

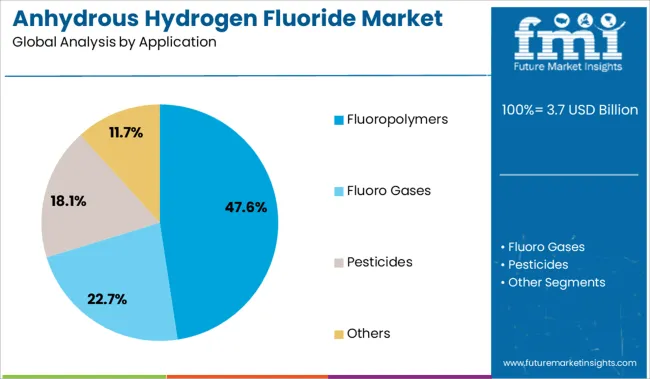
In 2023, the fluoro gases application category is anticipated to dominate with a 64% revenue share. This is due to their broad range of industrial uses, which include air conditioning systems, commercial refrigeration, as well as industrial refrigeration.

Due to their numerous advantages, these gasses are likewise becoming more and more popular worldwide. Some of the biggest sources of fluoro gas emissions are stationary refrigeration, and heat pump (RAC) equipment. HFCs are now used in several portable and permanent fire extinguishers and fire protection systems. HFCs are now used in mobile air conditioning in vehicles and small vans. Fluorogases are also used in other air-conditioned and chilled modes of transportation.

In the electronics and aerospace sectors, for example, cleaning agents containing F-gasses are employed on component surfaces. Fluorogases are used in a wide variety of specialized applications, including the manufacture of magnesium, various foams, and high-voltage switchgear. Such factors are expected to boost segmental growth during the forecast period.

What would be the outlook of the Other Application Segments?

The fluoropolymers segment of the anhydrous hydrogen fluoride market will become significant

The fluoropolymers segment will be the fastest-growing segment during the forecast period with a 5.7% CAGR. In the year 2023, this segment is predicted to acquire almost 48% of the market share.

A class of plastics composed of fluorine and carbon are referred to as fluoropolymers, which are fluorocarbon-based polymers. Fluoropolymers are commonly utilized in the automobile, electronics, semiconductor, and home appliance sectors as well as in common household products because of their unique, non-adhesive, and low-friction properties. In terms of electrical performance, chemical resistance, heat resistance, and weather resistance, fluoropolymers perform better than conventional polymers. Therefore, during the course of the predicted period, these benefits will fuel segmental growth.

Start-up Scenario

To satisfy the rising demand from the end-use sectors, the manufacturers are more concerned with growing the anhydrous hydrogen fluoride manufacturing capacity. These firms continuously conduct Research and Development operations to provide a variety of high-quality product lines.
  • Chemicals Direct USA is a distributor of chemicals for the construction, agriculture, hotel, power generation, mining, water treatment, oil, laundry, gas, food, and dairy industries. Products include polymers, anhydrous hydrogen fluoride, detergents, nitrates, flocculants, glycols, acids, clays, activated carbon, ammonia, acetone, soda, sulfate, xylene, and glycerine. Laundry products such as sodium hypochlorite, boric acid, hydrogen peroxide, and salt water softeners are available. Caustic soda, citric acid, chlorine, salt, sulfamic acid, soda ash, and sulfuric acid are also offered.

Competitive Landscape

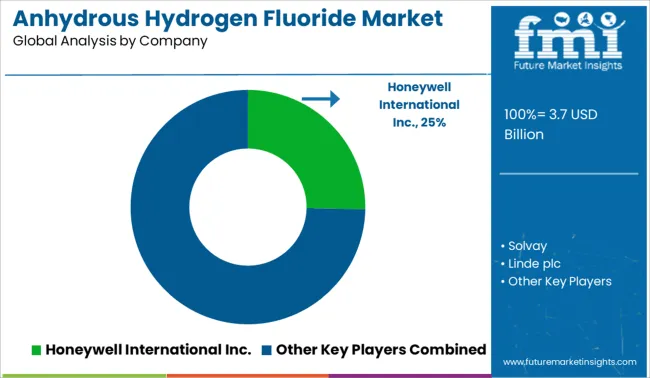
Some of the prominent players in the global anhydrous hydrogen fluoride market are Honeywell International Inc., Solvay, Linde plc, Arkema, Lanxess, Navin Fluorine International Limited, Fubao Group, Foosung, Co Ltd, Fluorchemie Dohna GmbH, Fluorsid S.p.A., and Derivados del Fluor SA.

Some of the prominent developments of the key players in the market are:

  • Arkema announced a unique and long-term collaboration with Nutrien Ltd, the world's biggest integrated agricultural enterprise, in 2020 for the delivery of anhydrous hydrogen fluoride to Arkema's Calvert City (KY) plant. It supported the expansion of fluoropolymers in the lucrative markets of water treatment, electronics, and batteries, and it provided higher environmental protection than more conventional manufacturing procedures. Anhydrous hydrogen fluoride is the primary raw material for fluorine chemistry, and this effort guaranteed competitive access to it.
  • Honeywell is committed to creating tech-driven solutions for the next generation of healthcare delivery in 2022. Honeywell inked Memorandums of Understanding (MOUs) with two of the top healthcare organizations, building on its extensive experience in the hospital context, with the possibility of future international and domestic cooperation. Through the use of digitalization, the agreements offer a framework for co-innovating jobs and processes that are prone to mistakes, improving patient experiences, and increasing operational agility.

Key Segments Covered in the Anhydrous Hydrogen Fluoride Market Report

Anhydrous Hydrogen Fluoride Market by Application:

  • Fluoropolymers
  • Fluoro Gases
  • Pesticides
  • Others

Anhydrous Hydrogen Fluoride Market by Region:

  • North America
  • Latin America
  • Europe
  • Asia Pacific
  • Middle East & Africa (MEA)

Frequently Asked Questions

At what rate did the anhydrous hydrogen fluoride market flourish from 2018 to 2022?

During the historical period of 2018 to 2022, the anhydrous hydrogen fluoride market grew at a CAGR of 3.7 %.

What will be the growth rate of the global anhydrous hydrogen fluoride market during the forecast period?

The global anhydrous hydrogen fluoride market is predicted to rise with a steady 5.8% CAGR from 2023 to 2033.

What is the present market value of the anhydrous hydrogen fluoride market?

The global anhydrous hydrogen fluoride market is currently worth more than US$ 3.2 Billion.

What will be the projected market size of the anhydrous hydrogen fluoride market by 2033?

By 2033, the global anhydrous hydrogen fluoride market is projected to reach a market size of US$ 5.7 Billion.

Which segment is expected to dominate the global anhydrous hydrogen fluoride market during 2023?

In 2023, the fluoro gases application category is anticipated to dominate with a 64% revenue share.

What will be the outlook of the other segment during the forecast period?

The fluoropolymers segment will be the fastest-growing segment during the forecast period with a 5.7% CAGR.

How is the North American anhydrous hydrogen fluoride market projected to grow during 2023 to 2033?

The North American region is predicted to grow with a steady CAGR of 6.1% from 2023 to 2033.

What is the outlook of the Asia Pacific anhydrous hydrogen fluoride market during 2023?

The Asia Pacific anhydrous hydrogen fluoride market is expected to grow with a steady CAGR of 5.6% from 2023 to 2033.

Table of Content

1. Executive Summary | Anhydrous Hydrogen Fluoride Market

    1.1. Global Market Outlook

    1.2. Demand-side Trends

    1.3. Supply-side Trends

    1.4. Technology Roadmap Analysis

    1.5. Analysis and Recommendations

2. Market Overview

    2.1. Market Coverage / Taxonomy

    2.2. Market Definition / Scope / Limitations

3. Market Background

    3.1. Market Dynamics

        3.1.1. Drivers

        3.1.2. Restraints

        3.1.3. Opportunity

        3.1.4. Trends

    3.2. Scenario Forecast

        3.2.1. Demand in Optimistic Scenario

        3.2.2. Demand in Likely Scenario

        3.2.3. Demand in Conservative Scenario

    3.3. Opportunity Map Analysis

    3.4. Product Life Cycle Analysis

    3.5. Supply Chain Analysis

        3.5.1. Supply Side Participants and their Roles

            3.5.1.1. Producers

            3.5.1.2. Mid-Level Participants (Traders/ Agents/ Brokers)

            3.5.1.3. Wholesalers and Distributors

        3.5.2. Value Added and Value Created at Node in the Supply Chain

        3.5.3. List of Raw Material Suppliers

        3.5.4. List of Existing and Potential Buyers

    3.6. Investment Feasibility Matrix

    3.7. Value Chain Analysis

        3.7.1. Profit Margin Analysis

        3.7.2. Wholesalers and Distributors

        3.7.3. Retailers

    3.8. PESTLE and Porter’s Analysis

    3.9. Regulatory Landscape

        3.9.1. By Key Regions

        3.9.2. By Key Countries

    3.10. Regional Parent Market Outlook

    3.11. Production and Consumption Statistics

    3.12. Import and Export Statistics

4. Global Market Analysis 2018 to 2022 and Forecast, 2023 to 2033

    4.1. Historical Market Size Value (US$ Billion) & Volume (Tons) Analysis, 2018 to 2022

    4.2. Current and Future Market Size Value (US$ Billion) & Volume (Tons) Projections, 2023 to 2033

        4.2.1. Y-o-Y Growth Trend Analysis

        4.2.2. Absolute $ Opportunity Analysis

5. Global Market Analysis 2018 to 2022 and Forecast 2023 to 2033, By Application

    5.1. Introduction / Key Findings

    5.2. Historical Market Size Value (US$ Billion) & Volume (Tons) Analysis By Application, 2018 to 2022

    5.3. Current and Future Market Size Value (US$ Billion) & Volume (Tons) Analysis and Forecast By Application, 2023 to 2033

        5.3.1. Fluoropolymers

        5.3.2. Fluorogases

        5.3.3. Pesticides

        5.3.4. Others

    5.4. Y-o-Y Growth Trend Analysis By Application, 2018 to 2022

    5.5. Absolute $ Opportunity Analysis By Application, 2023 to 2033

6. Global Market Analysis 2018 to 2022 and Forecast 2023 to 2033, By Region

    6.1. Introduction

    6.2. Historical Market Size Value (US$ Billion) & Volume (Tons) Analysis By Region, 2018 to 2022

    6.3. Current Market Size Value (US$ Billion) & Volume (Tons) Analysis and Forecast By Region, 2023 to 2033

        6.3.1. North America

        6.3.2. Latin America

        6.3.3. Europe

        6.3.4. Asia Pacific

        6.3.5. Middle East and Africa(MEA)

    6.4. Market Attractiveness Analysis By Region

7. North America Market Analysis 2018 to 2022 and Forecast 2023 to 2033, By Country

    7.1. Historical Market Size Value (US$ Billion) & Volume (Tons) Trend Analysis By Market Taxonomy, 2018 to 2022

    7.2. Market Size Value (US$ Billion) & Volume (Tons) Forecast By Market Taxonomy, 2023 to 2033

        7.2.1. By Country

            7.2.1.1. USA

            7.2.1.2. Canada

        7.2.2. By Application

    7.3. Market Attractiveness Analysis

        7.3.1. By Country

        7.3.2. By Application

    7.4. Key Takeaways

8. Latin America Market Analysis 2018 to 2022 and Forecast 2023 to 2033, By Country

    8.1. Historical Market Size Value (US$ Billion) & Volume (Tons) Trend Analysis By Market Taxonomy, 2018 to 2022

    8.2. Market Size Value (US$ Billion) & Volume (Tons) Forecast By Market Taxonomy, 2023 to 2033

        8.2.1. By Country

            8.2.1.1. Brazil

            8.2.1.2. Mexico

            8.2.1.3. Rest of Latin America

        8.2.2. By Application

    8.3. Market Attractiveness Analysis

        8.3.1. By Country

        8.3.2. By Application

    8.4. Key Takeaways

9. Europe Market Analysis 2018 to 2022 and Forecast 2023 to 2033, By Country

    9.1. Historical Market Size Value (US$ Billion) & Volume (Tons) Trend Analysis By Market Taxonomy, 2018 to 2022

    9.2. Market Size Value (US$ Billion) & Volume (Tons) Forecast By Market Taxonomy, 2023 to 2033

        9.2.1. By Country

            9.2.1.1. Germany

            9.2.1.2. United Kingdom

            9.2.1.3. France

            9.2.1.4. Spain

            9.2.1.5. Italy

            9.2.1.6. Russia

            9.2.1.7. Rest of Europe

        9.2.2. By Application

    9.3. Market Attractiveness Analysis

        9.3.1. By Country

        9.3.2. By Application

    9.4. Key Takeaways

10. Asia Pacific Market Analysis 2018 to 2022 and Forecast 2023 to 2033, By Country

    10.1. Historical Market Size Value (US$ Billion) & Volume (Tons) Trend Analysis By Market Taxonomy, 2018 to 2022

    10.2. Market Size Value (US$ Billion) & Volume (Tons) Forecast By Market Taxonomy, 2023 to 2033

        10.2.1. By Country

            10.2.1.1. China

            10.2.1.2. Japan

            10.2.1.3. India

            10.2.1.4. South Korea

            10.2.1.5. Australia

            10.2.1.6. Rest of Asia Pacific

        10.2.2. By Application

    10.3. Market Attractiveness Analysis

        10.3.1. By Country

        10.3.2. By Application

    10.4. Key Takeaways

11. MEA Market Analysis 2018 to 2022 and Forecast 2023 to 2033, By Country

    11.1. Historical Market Size Value (US$ Billion) & Volume (Tons) Trend Analysis By Market Taxonomy, 2018 to 2022

    11.2. Market Size Value (US$ Billion) & Volume (Tons) Forecast By Market Taxonomy, 2023 to 2033

        11.2.1. By Country

            11.2.1.1. South Africa

            11.2.1.2. Saudi Arabia

            11.2.1.3. United Arab Emirates(UAE)

            11.2.1.4. Israel

            11.2.1.5. Rest of Middle East and Africa(MEA)

        11.2.2. By Application

    11.3. Market Attractiveness Analysis

        11.3.1. By Country

        11.3.2. By Application

    11.4. Key Takeaways

12. Key Countries Market Analysis

    12.1. Value (US$ Billion) & Volume (Tons)ed States

        12.1.1. Pricing Analysis

        12.1.2. Market Share Analysis, 2022

            12.1.2.1. By Application

    12.2. Canada

        12.2.1. Pricing Analysis

        12.2.2. Market Share Analysis, 2022

            12.2.2.1. By Application

    12.3. Brazil

        12.3.1. Pricing Analysis

        12.3.2. Market Share Analysis, 2022

            12.3.2.1. By Application

    12.4. Mexico

        12.4.1. Pricing Analysis

        12.4.2. Market Share Analysis, 2022

            12.4.2.1. By Application

    12.5. Germany

        12.5.1. Pricing Analysis

        12.5.2. Market Share Analysis, 2022

            12.5.2.1. By Application

    12.6. United Kingdom

        12.6.1. Pricing Analysis

        12.6.2. Market Share Analysis, 2022

            12.6.2.1. By Application

    12.7. France

        12.7.1. Pricing Analysis

        12.7.2. Market Share Analysis, 2022

            12.7.2.1. By Application

    12.8. Spain

        12.8.1. Pricing Analysis

        12.8.2. Market Share Analysis, 2022

            12.8.2.1. By Application

    12.9. Italy

        12.9.1. Pricing Analysis

        12.9.2. Market Share Analysis, 2022

            12.9.2.1. By Application

    12.10. Russia

        12.10.1. Pricing Analysis

        12.10.2. Market Share Analysis, 2022

            12.10.2.1. By Application

    12.11. China

        12.11.1. Pricing Analysis

        12.11.2. Market Share Analysis, 2022

            12.11.2.1. By Application

    12.12. Japan

        12.12.1. Pricing Analysis

        12.12.2. Market Share Analysis, 2022

            12.12.2.1. By Application

    12.13. India

        12.13.1. Pricing Analysis

        12.13.2. Market Share Analysis, 2022

            12.13.2.1. By Application

    12.14. South Korea

        12.14.1. Pricing Analysis

        12.14.2. Market Share Analysis, 2022

            12.14.2.1. By Application

    12.15. Australia

        12.15.1. Pricing Analysis

        12.15.2. Market Share Analysis, 2022

            12.15.2.1. By Application

    12.16. South Africa

        12.16.1. Pricing Analysis

        12.16.2. Market Share Analysis, 2022

            12.16.2.1. By Application

    12.17. Saudi Arabia

        12.17.1. Pricing Analysis

        12.17.2. Market Share Analysis, 2022

            12.17.2.1. By Application

    12.18. United Arab Emirates(UAE)

        12.18.1. Pricing Analysis

        12.18.2. Market Share Analysis, 2022

            12.18.2.1. By Application

    12.19. Israel

        12.19.1. Pricing Analysis

        12.19.2. Market Share Analysis, 2022

            12.19.2.1. By Application

13. Market Structure Analysis

    13.1. Competition Dashboard

    13.2. Competition Benchmarking

    13.3. Market Share Analysis of Top Players

        13.3.1. By Regional

        13.3.2. By Application

14. Competition Analysis

    14.1. Competition Deep Dive

        14.1.1. Honeywell International Inc.

            14.1.1.1. Overview

            14.1.1.2. Product Portfolio

            14.1.1.3. Profitability by Market Segments

            14.1.1.4. Sales Footprint

            14.1.1.5. Strategy Overview

                14.1.1.5.1. Marketing Strategy

                14.1.1.5.2. Product Strategy

                14.1.1.5.3. Channel Strategy

        14.1.2. Solvay

            14.1.2.1. Overview

            14.1.2.2. Product Portfolio

            14.1.2.3. Profitability by Market Segments

            14.1.2.4. Sales Footprint

            14.1.2.5. Strategy Overview

                14.1.2.5.1. Marketing Strategy

                14.1.2.5.2. Product Strategy

                14.1.2.5.3. Channel Strategy

        14.1.3. Linde plc

            14.1.3.1. Overview

            14.1.3.2. Product Portfolio

            14.1.3.3. Profitability by Market Segments

            14.1.3.4. Sales Footprint

            14.1.3.5. Strategy Overview

                14.1.3.5.1. Marketing Strategy

                14.1.3.5.2. Product Strategy

                14.1.3.5.3. Channel Strategy

        14.1.4. Arkema

            14.1.4.1. Overview

            14.1.4.2. Product Portfolio

            14.1.4.3. Profitability by Market Segments

            14.1.4.4. Sales Footprint

            14.1.4.5. Strategy Overview

                14.1.4.5.1. Marketing Strategy

                14.1.4.5.2. Product Strategy

                14.1.4.5.3. Channel Strategy

        14.1.5. Lanxess

            14.1.5.1. Overview

            14.1.5.2. Product Portfolio

            14.1.5.3. Profitability by Market Segments

            14.1.5.4. Sales Footprint

            14.1.5.5. Strategy Overview

                14.1.5.5.1. Marketing Strategy

                14.1.5.5.2. Product Strategy

                14.1.5.5.3. Channel Strategy

        14.1.6. Navin Fluorine International Limited

            14.1.6.1. Overview

            14.1.6.2. Product Portfolio

            14.1.6.3. Profitability by Market Segments

            14.1.6.4. Sales Footprint

            14.1.6.5. Strategy Overview

                14.1.6.5.1. Marketing Strategy

                14.1.6.5.2. Product Strategy

                14.1.6.5.3. Channel Strategy

        14.1.7. Fubao Group

            14.1.7.1. Overview

            14.1.7.2. Product Portfolio

            14.1.7.3. Profitability by Market Segments

            14.1.7.4. Sales Footprint

            14.1.7.5. Strategy Overview

                14.1.7.5.1. Marketing Strategy

                14.1.7.5.2. Product Strategy

                14.1.7.5.3. Channel Strategy

        14.1.8. Foosung, Co Ltd

            14.1.8.1. Overview

            14.1.8.2. Product Portfolio

            14.1.8.3. Profitability by Market Segments

            14.1.8.4. Sales Footprint

            14.1.8.5. Strategy Overview

                14.1.8.5.1. Marketing Strategy

                14.1.8.5.2. Product Strategy

                14.1.8.5.3. Channel Strategy

        14.1.9. Fluorchemie Dohna GmbH

            14.1.9.1. Overview

            14.1.9.2. Product Portfolio

            14.1.9.3. Profitability by Market Segments

            14.1.9.4. Sales Footprint

            14.1.9.5. Strategy Overview

                14.1.9.5.1. Marketing Strategy

                14.1.9.5.2. Product Strategy

                14.1.9.5.3. Channel Strategy

        14.1.10. Fluorsid S.p.A.

            14.1.10.1. Overview

            14.1.10.2. Product Portfolio

            14.1.10.3. Profitability by Market Segments

            14.1.10.4. Sales Footprint

            14.1.10.5. Strategy Overview

                14.1.10.5.1. Marketing Strategy

                14.1.10.5.2. Product Strategy

                14.1.10.5.3. Channel Strategy

        14.1.11. Derivados del Fluor SA

            14.1.11.1. Overview

            14.1.11.2. Product Portfolio

            14.1.11.3. Profitability by Market Segments

            14.1.11.4. Sales Footprint

            14.1.11.5. Strategy Overview

                14.1.11.5.1. Marketing Strategy

                14.1.11.5.2. Product Strategy

                14.1.11.5.3. Channel Strategy

15. Assumptions & Acronyms Used

16. Research Methodology

List of Tables

Table 1: Global Market Value (US$ Billion) Forecast by Region, 2018 to 2033

Table 2: Global Market Volume (Tons) Forecast by Region, 2018 to 2033

Table 3: Global Market Value (US$ Billion) Forecast by Application, 2018 to 2033

Table 4: Global Market Volume (Tons) Forecast by Application, 2018 to 2033

Table 5: North America Market Value (US$ Billion) Forecast by Country, 2018 to 2033

Table 6: North America Market Volume (Tons) Forecast by Country, 2018 to 2033

Table 7: North America Market Value (US$ Billion) Forecast by Application, 2018 to 2033

Table 8: North America Market Volume (Tons) Forecast by Application, 2018 to 2033

Table 9: Latin America Market Value (US$ Billion) Forecast by Country, 2018 to 2033

Table 10: Latin America Market Volume (Tons) Forecast by Country, 2018 to 2033

Table 11: Latin America Market Value (US$ Billion) Forecast by Application, 2018 to 2033

Table 12: Latin America Market Volume (Tons) Forecast by Application, 2018 to 2033

Table 13: Europe Market Value (US$ Billion) Forecast by Country, 2018 to 2033

Table 14: Europe Market Volume (Tons) Forecast by Country, 2018 to 2033

Table 15: Europe Market Value (US$ Billion) Forecast by Application, 2018 to 2033

Table 16: Europe Market Volume (Tons) Forecast by Application, 2018 to 2033

Table 17: Asia Pacific Market Value (US$ Billion) Forecast by Country, 2018 to 2033

Table 18: Asia Pacific Market Volume (Tons) Forecast by Country, 2018 to 2033

Table 19: Asia Pacific Market Value (US$ Billion) Forecast by Application, 2018 to 2033

Table 20: Asia Pacific Market Volume (Tons) Forecast by Application, 2018 to 2033

Table 21: MEA Market Value (US$ Billion) Forecast by Country, 2018 to 2033

Table 22: MEA Market Volume (Tons) Forecast by Country, 2018 to 2033

Table 23: MEA Market Value (US$ Billion) Forecast by Application, 2018 to 2033

Table 24: MEA Market Volume (Tons) Forecast by Application, 2018 to 2033

List of Charts

Figure 1: Global Market Value (US$ Billion) by Application, 2023 to 2033

Figure 2: Global Market Value (US$ Billion) by Region, 2023 to 2033

Figure 3: Global Market Value (US$ Billion) Analysis by Region, 2018 to 2033

Figure 4: Global Market Volume (Tons) Analysis by Region, 2018 to 2033

Figure 5: Global Market Value Share (%) and BPS Analysis by Region, 2023 to 2033

Figure 6: Global Market Y-o-Y Growth (%) Projections by Region, 2023 to 2033

Figure 7: Global Market Value (US$ Billion) Analysis by Application, 2018 to 2033

Figure 8: Global Market Volume (Tons) Analysis by Application, 2018 to 2033

Figure 9: Global Market Value Share (%) and BPS Analysis by Application, 2023 to 2033

Figure 10: Global Market Y-o-Y Growth (%) Projections by Application, 2023 to 2033

Figure 11: Global Market Attractiveness by Application, 2023 to 2033

Figure 12: Global Market Attractiveness by Region, 2023 to 2033

Figure 13: North America Market Value (US$ Billion) by Application, 2023 to 2033

Figure 14: North America Market Value (US$ Billion) by Country, 2023 to 2033

Figure 15: North America Market Value (US$ Billion) Analysis by Country, 2018 to 2033

Figure 16: North America Market Volume (Tons) Analysis by Country, 2018 to 2033

Figure 17: North America Market Value Share (%) and BPS Analysis by Country, 2023 to 2033

Figure 18: North America Market Y-o-Y Growth (%) Projections by Country, 2023 to 2033

Figure 19: North America Market Value (US$ Billion) Analysis by Application, 2018 to 2033

Figure 20: North America Market Volume (Tons) Analysis by Application, 2018 to 2033

Figure 21: North America Market Value Share (%) and BPS Analysis by Application, 2023 to 2033

Figure 22: North America Market Y-o-Y Growth (%) Projections by Application, 2023 to 2033

Figure 23: North America Market Attractiveness by Application, 2023 to 2033

Figure 24: North America Market Attractiveness by Country, 2023 to 2033

Figure 25: Latin America Market Value (US$ Billion) by Application, 2023 to 2033

Figure 26: Latin America Market Value (US$ Billion) by Country, 2023 to 2033

Figure 27: Latin America Market Value (US$ Billion) Analysis by Country, 2018 to 2033

Figure 28: Latin America Market Volume (Tons) Analysis by Country, 2018 to 2033

Figure 29: Latin America Market Value Share (%) and BPS Analysis by Country, 2023 to 2033

Figure 30: Latin America Market Y-o-Y Growth (%) Projections by Country, 2023 to 2033

Figure 31: Latin America Market Value (US$ Billion) Analysis by Application, 2018 to 2033

Figure 32: Latin America Market Volume (Tons) Analysis by Application, 2018 to 2033

Figure 33: Latin America Market Value Share (%) and BPS Analysis by Application, 2023 to 2033

Figure 34: Latin America Market Y-o-Y Growth (%) Projections by Application, 2023 to 2033

Figure 35: Latin America Market Attractiveness by Application, 2023 to 2033

Figure 36: Latin America Market Attractiveness by Country, 2023 to 2033

Figure 37: Europe Market Value (US$ Billion) by Application, 2023 to 2033

Figure 38: Europe Market Value (US$ Billion) by Country, 2023 to 2033

Figure 39: Europe Market Value (US$ Billion) Analysis by Country, 2018 to 2033

Figure 40: Europe Market Volume (Tons) Analysis by Country, 2018 to 2033

Figure 41: Europe Market Value Share (%) and BPS Analysis by Country, 2023 to 2033

Figure 42: Europe Market Y-o-Y Growth (%) Projections by Country, 2023 to 2033

Figure 43: Europe Market Value (US$ Billion) Analysis by Application, 2018 to 2033

Figure 44: Europe Market Volume (Tons) Analysis by Application, 2018 to 2033

Figure 45: Europe Market Value Share (%) and BPS Analysis by Application, 2023 to 2033

Figure 46: Europe Market Y-o-Y Growth (%) Projections by Application, 2023 to 2033

Figure 47: Europe Market Attractiveness by Application, 2023 to 2033

Figure 48: Europe Market Attractiveness by Country, 2023 to 2033

Figure 49: Asia Pacific Market Value (US$ Billion) by Application, 2023 to 2033

Figure 50: Asia Pacific Market Value (US$ Billion) by Country, 2023 to 2033

Figure 51: Asia Pacific Market Value (US$ Billion) Analysis by Country, 2018 to 2033

Figure 52: Asia Pacific Market Volume (Tons) Analysis by Country, 2018 to 2033

Figure 53: Asia Pacific Market Value Share (%) and BPS Analysis by Country, 2023 to 2033

Figure 54: Asia Pacific Market Y-o-Y Growth (%) Projections by Country, 2023 to 2033

Figure 55: Asia Pacific Market Value (US$ Billion) Analysis by Application, 2018 to 2033

Figure 56: Asia Pacific Market Volume (Tons) Analysis by Application, 2018 to 2033

Figure 57: Asia Pacific Market Value Share (%) and BPS Analysis by Application, 2023 to 2033

Figure 58: Asia Pacific Market Y-o-Y Growth (%) Projections by Application, 2023 to 2033

Figure 59: Asia Pacific Market Attractiveness by Application, 2023 to 2033

Figure 60: Asia Pacific Market Attractiveness by Country, 2023 to 2033

Figure 61: MEA Market Value (US$ Billion) by Application, 2023 to 2033

Figure 62: MEA Market Value (US$ Billion) by Country, 2023 to 2033

Figure 63: MEA Market Value (US$ Billion) Analysis by Country, 2018 to 2033

Figure 64: MEA Market Volume (Tons) Analysis by Country, 2018 to 2033

Figure 65: MEA Market Value Share (%) and BPS Analysis by Country, 2023 to 2033

Figure 66: MEA Market Y-o-Y Growth (%) Projections by Country, 2023 to 2033

Figure 67: MEA Market Value (US$ Billion) Analysis by Application, 2018 to 2033

Figure 68: MEA Market Volume (Tons) Analysis by Application, 2018 to 2033

Figure 69: MEA Market Value Share (%) and BPS Analysis by Application, 2023 to 2033

Figure 70: MEA Market Y-o-Y Growth (%) Projections by Application, 2023 to 2033

Figure 71: MEA Market Attractiveness by Application, 2023 to 2033

Figure 72: MEA Market Attractiveness by Country, 2023 to 2033

Recommendations

Chemicals & Materials

Potassium Hydrogen Fluoride Market

Published : April 2023

Explore Chemicals & Materials Insights

View Reports

Anhydrous Hydrogen Fluoride Market