
- Market Size (2026)
- USD 892.2 Mn
- Forecast (2036)
- USD 47159.8 Mn
- CAGR (2026 to 2036)
- 48.7%
How big is Hydrogen Storage Tank And Transportation Market in 2026?
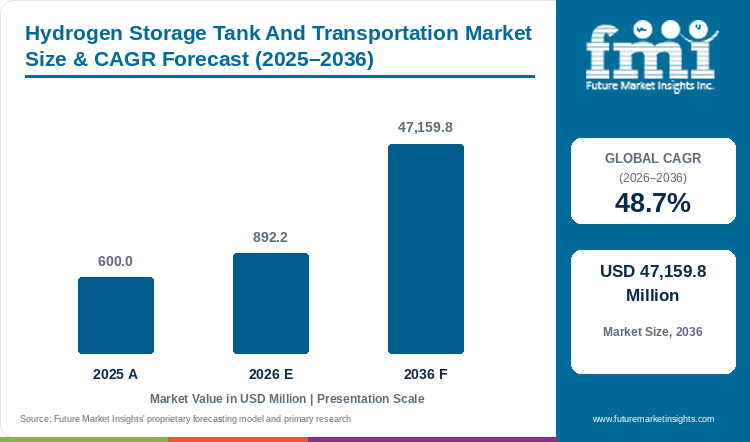
The hydrogen storage tank and transportation market demonstrated steady progress from USD 600.0 million in 2025 to USD 892.2 million in 2026, building toward a targeted valuation of USD 47,159.8 million by 2036 at a CAGR of 48.7%.
In 2025, global hydrogen storage tank and transportation market size stood at USD 600.0 million before rising to USD 892.2 million for 2026. By 2036, sector valuation hits USD 47,159.8 million on a 48.7% compound annual rate, creating USD 46,267.6 million in added industry value. Modular fuel storage systems are forecast to account for 59.4% of modular system demand in 2026 because fleet and station operators buy pre-manifolded cylinder skids that install directly onto truck chassis without site welding. This 48.7% growth rate is significantly higher than the 8.7% CAGR recorded across broader hydrogen energy storage systems, as industrial gas distributors purchase mobile 500-bar composite containers today to move fuel over highways without waiting years for buried pipeline permits. Commercial orders for high-pressure composite vessels are reinforced by falling cylinder costs per kilogram of stored gas, with the U.S. Department of Energy reporting in April 2025 that 700-bar Type IV onboard storage system costs reached USD 12.7 per kWh at 1.71 kWh per kilogram capacity. Nevertheless, high aerospace-grade carbon-fiber prices and strict cyclic pressure qualification rules still restrain adoption among smaller freight operators, meaning purchasing expansion through 2036 depends on automated dry-towpreg winding that lowers tank cost per trailer payload.
Key Market Trends & Insights
- By modular system: Modular fuel storage systems are projected to account for 59.4% of modular system demand in 2026, supported by swapped container frames.
- By pressure rating: Vessels rated 200 to 500 bar are estimated to hold 46.8% of the pressure rating category in 2026, driven by regional tube-trailer compatibility.
- By vessel classification: Type IV carbon-fiber composite vessels are expected to lead vessel classification with 44.2% share in 2026, owing to payload weight savings.
- By end use: Hydrogen refueling stations and mobility are forecast to represent 51.8% of end use demand in 2026, underpinned by heavy-duty bus and truck rollouts.
- By digital and duty tier: IIoT-connected and edge-telemetry enabled systems capture 56.8% of digital tier demand in 2026, while heavy-duty continuous industrial operation holds 51.1%.
Regional Highlights
- National growth outlook: South Korea is projected to expand at a 50.2% CAGR through 2036 under national fuel-cell bus mandates, while the United States advances at a 49.2% CAGR through regional hydrogen hubs.
- Notable market participants: Hexagon Purus ASA, Worthington Enterprises Inc., Chart Industries Inc., Air Liquide S.A., Linde plc, Luxfer Holdings PLC, NPROXX B.V., and Quantum Fuel Systems LLC supply the hydrogen storage tank and transportation market.
Market Size & Forecast
Table 1: Market Size and Forecast for the Hydrogen Storage Tank And Transportation Market (USD million and CAGR percentage), 2025 to 2036
| Metric | Value |
|---|---|
| 2025 Market Size | USD 600.0 million |
| Estimated Market Size in 2026 | USD 892.2 million |
| Projected Market Size by 2036 | USD 47,159.8 million |
| CAGR, 2026 to 2036 | 48.7% |
| Added Valuation, 2026 to 2036 | USD 46,267.6 million |
Expanding clean hydrogen deliveries between remote electrolysis plants and urban bus and truck depots are driving fleet demand for high-pressure composite road trailers. Legacy 200-bar steel tube trailers haul limited gas weight per trip, which inflates driver and fuel transport costs per kilogram delivered. For instance, in January 2026, a pressure-vessel investigation in Polymers showed that reinforcing polyamide-12 cylinder liners cut hydrogen dome permeation at operating temperatures above 48.34 degrees Celsius. This liner durability allows gas distributors to pair 500-bar road trailers with underground hydrogen storage caverns so regional refueling stations maintain uninterrupted fuel supply.
Fleet-Capacity and Vessel-Deployment Sizing
Table 2: Fleet-Capacity and Vessel-Deployment Sizing for the Hydrogen Storage Tank And Transportation Market (USD million and operational ranges), 2025 to 2036
| Metric | 2025 | 2026 | 2036 |
|---|---|---|---|
| Market size (USD million) | 600.0 | 892.2 | 47,159.8 |
| Active high-pressure tube trailers and ISO skids (units) | 4,200 to 4,800 | 5,800 to 6,600 | 95,000 to 112,000 |
| Onboard & modular composite vessels shipped (thousand) | 85.0 to 98.0 | 125.0 to 145.0 | 4,800.0 to 5,400.0 |
| Average modular container skid price (USD thousand) | 320.0 to 410.0 | 310.0 to 395.0 | 220.0 to 285.0 |
Operational note: Fleet-capacity ranges reflect commercial 200 to 700 bar cylinder assemblies and ISO tube-trailer skids deployed across mobility and industrial distribution corridors.
Increasing daily fast-fill frequencies at commercial refueling hubs are compelling gas logistics buyers to specify vessels with verified cyclic fatigue life. Rapid compression and decompression cycles heat tank walls and stress inner polymer liners during back-to-back trailer swaps. To prevent premature cylinder retirement, station integrators combine stationary material-based hydrogen storage media buffers with carbon-fiber composite tube trailers for highway distribution.
Per Capita & Refueling Corridor Sizing
Table 3: Per Capita and Refueling Corridor Allocation Indicators for the Hydrogen Storage Tank And Transportation Market (USD), 2025 to 2036
| Metric | 2025 | 2026 | 2036 |
|---|---|---|---|
| World population (billion) | 8.2 | 8.3 | 9.0 |
| Allocation per 1,000 people (USD) | 73.2 | 107.5 | 5,240.0 |
| Annual vessel capex per refueling station (USD thousand) | 420.0 to 510.0 | 450.0 to 540.0 | 680.0 to 820.0 |
| IIoT-monitored fleet contract share (%) | 53.0% to 56.0% | 55.0% to 58.0% | 76.0% to 81.0% |
Table 4: Corridor & Industrial Hub Allocation Indicators for the Hydrogen Storage Tank And Transportation Market (USD and percentages), 2026
| Metric | Value | Institutional Reference Basis |
|---|---|---|
| Market size, 2026 | USD 892.2 million | 2026 global valuation baseline |
| Active commercial H2 refueling & industrial hubs | 1,450 hubs | Global hydrogen dispensing and distribution registry |
| Average vessel allocation per hub | USD 615,310 | Annualized modular tank and trailer procurement |
| Refueling and mobility share, 2026 | 51.8% | Leading end-use segment share |
Reducing refueling station downtime during peak morning transit bus and heavy truck dispatching is a primary factor driving cascade storage orders. When station buffer pressure drops below vehicle tank targets, compressors must run continuously and delay fleet turnarounds. Industrial gas suppliers therefore purchase multi-bank high-pressure gas cylinders coupled with 500-bar drop-and-swap trailers to sustain peak dispensing rates.
Analyst Perspective
"Hydrogen logistics buyers no longer purchase standalone tanks without integrated telemetry and modular skid frames. Vessel manufacturers that lower carbon-fiber winding costs while certifying 500-bar and 700-bar swap containers will secure multi-year fleet supply contracts."
- Nikhil Kaitwade, Principal Consultant, Future Market Insights.
How is the hydrogen storage tank and transportation market segmented?
The hydrogen storage tank and transportation market is segmented by six primary commercial axes and region: modular system, pressure rating, vessel classification, end use, digital and connectivity tier, and operating duty class. In 2026, modular fuel storage systems are projected at 59.4%, 200 to 500 bar vessels at 46.8%, Type IV carbon-fiber composite at 44.2%, hydrogen refueling stations and mobility at 51.8%, IIoT-connected and edge-telemetry enabled at 56.8%, and heavy-duty continuous industrial operation at 51.1%.
By modular system: Modular Fuel Storage Systems, Tube Trailers and ISO Containers, and Stationary Bulk Storage Cascades.
By pressure rating: 200 to 500 Bar Vessels, Above 500 Bar Type IV Cylinders, and Below 200 Bar and Cryogenic Liquid.
By vessel classification: Type IV Carbon-Fiber Composite, Type III Metal-Lined Composite, Type I and Type II Steel Cylinders, and Cryogenic Liquid H2 Dewars.
By end use: Hydrogen Refueling Stations and Mobility, Industrial Refining and Ammonia, and Grid and Maritime Transport.
By digital and operating duty tier: IIoT-Connected and Edge-Telemetry Enabled (56.8%) vs Standalone Conventional Electromechanical, and Heavy-Duty Continuous Industrial Operation (51.1%) vs Medium-Duty and Light-Duty Cycling.
Why do modular fuel storage systems account for modular system demand?
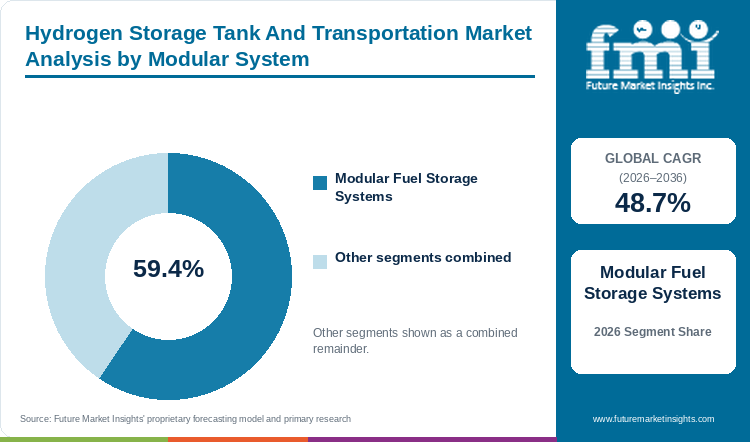
By modular system, modular fuel storage systems are forecast to represent 59.4% in 2026, aided by chassis swap frames.
Table 5: Modular System Share for the Hydrogen Storage Tank And Transportation Market (percentage share), 2026
| Modular System | Share (2026) |
|---|---|
| Modular Fuel Storage Systems | 59.4% |
| Other Segments Combined | 40.6%* |
| Total | 100.0% |
*Note: Remaining modular system segments total 100.0% of 2026 vessel deployment volume.
Table 6: Modular System Leadership and Market Growth for the Hydrogen Storage Tank And Transportation Market (segment and CAGR percentage), 2026 to 2036
| Metric | Value |
|---|---|
| Global CAGR (2026 to 2036) | 48.7% |
| Leading Segment | Modular Fuel Storage Systems |
FMI research indicates that rising demand for rapid refueling station deployment without costly civil piping work is driving buyers toward modular fuel storage systems. Pre-manifolded container skids mount directly onto truck frames and connect to merchant hydrogen generation plants for fast trailer swapping.
- Within the modular system category, modular fuel storage systems are likely to secure 59.4% share in 2026, aided by plug-and-play chassis integration.
- A March 2026 filament-winding study in Polymers demonstrated that optimized 79-newton dry towpreg tension reduced Type IV composite tank mass by 15.4%.
What supports 200 to 500 bar vessels as a preferred choice in pressure rating?
In 2026, 200 to 500 bar vessels are expected to lead pressure rating with 46.8% share, owing to cascade efficiency.
Medium-pressure vessels operating between 200 and 500 bar balance payload density against compressor electricity consumption across regional distribution hubs. Terminal operators fill 450-bar tube trailers and multi-element gas containers directly from metal hydrogen generation units without expensive 900-bar compression stages.
- Vessels rated at 200 to 500 bar are expected to command 46.8% of pressure rating demand in 2026, propelled by regional refueling cascade compatibility.
- Per a November 2025 U.S. Department of Energy OSTI report, a commercial marine hydrogen refueling barge stores 512 kilograms in 517-bar manifolded cylinders.
How are Type IV carbon-fiber composite vessels gaining use in vessel classification?
Type IV carbon-fiber composite vessels are projected to hold 44.2% share in 2026, supported by high gravimetric payload capacity.
High-density polymer liners wrapped in braided carbon fiber allow Type IV vessels to haul three times more compressed gas per highway trip than steel tubes. Freight operators deploy lightweight composite cylinders across regional hydrogen hubs to maximize net fuel payload within axle-weight limits.
- By 2026, Type IV carbon-fiber composite vessels are projected to contribute 44.2% of revenue within vessel classification, supported by high gravimetric payload efficiency.
- A July 2025 liner engineering review in Polymers confirmed that modified polyamide-6 liners wrapped in carbon fiber sustain 70 MPa working pressure with minimal blistering.
Why are buyers selecting hydrogen refueling stations and mobility within end use?
Based on end use, hydrogen refueling stations and mobility are projected to hold 51.8% in 2026, driven by transit fleets.
Municipal transit bus depots and heavy freight corridors require both onboard vehicle fuel racks and high-pressure stationary buffer cascades at dispensing islands. Dispensing stations rely on 500-bar trailer swaps to replenish storage banks without constructing urban pipelines.
- With an estimated 51.8% share in 2026, hydrogen refueling stations and mobility are forecast to dominate the end use category, underpinned by commercial transit fleet rollouts.
- A July 2025 transport assessment in RSC Advances confirmed that 350-bar to 700-bar compressed composite vessels anchor commercial bus, truck, and rail refueling networks.
Which market conditions keep IIoT-connected telemetry relevant within digital and duty tiers?
Within digital tier, IIoT-connected telemetry systems are anticipated to maintain 56.8% share in 2026, reinforced by continuous industrial duty.
High-pressure hydrogen vessels require real-time fiber-optic strain and thermal monitoring during fast-fill compression cycles to prevent liner overheating. Fleet managers integrate acoustic emission sensors and GPS pressure transmitters to automate ADR and DOT safety inspections across continuous industrial duty.
- The IIoT-connected and edge-telemetry enabled segment is anticipated to account for 56.8% of the digital tier in 2026, reinforced by heavy-duty continuous operation at 51.1%.
- A February 2025 rail propulsion study in Scientific Reports documented that 700-bar telemetry-monitored tanks increase volumetric storage capacity by 50% over 350-bar systems.
What are the drivers, restraints, and opportunities in the hydrogen storage tank and transportation market?
In the hydrogen storage tank and transportation market, heavy-duty refueling corridors and green ammonia hubs are projected to expand composite vessel orders whereas carbon-fiber costs restrain adoption and dry towpreg winding creates margin opportunities.
- Driver: Expanding heavy-duty fuel cell truck corridors and green ammonia plants compel operators to procure high-capacity composite storage modules.
- Restraint: High polyacrylonitrile carbon-fiber precursor costs and liquid hydrogen boil-off losses inflate initial capital budgets for fleet buyers.
- Opportunity: Dry towpreg robotic filament winding and cryo-compressed storage designs unlock higher payload capacity per highway trailer trip.
Growth Analysis and Future Potential: Qualitative Demand Catalysts
Clean-energy logistics providers are replacing legacy 200-bar steel tube trailers with 500-bar composite multi-element gas containers to triple hydrogen payload weight per highway trip. Delivering bulk fuel from centralized renewable electrolyzers to urban bus depots requires high-cycle pressure vessels paired with fuel cell air compressor systems at dispensing islands. According to FMI analysis, regional clean-fuel freight corridors convert containerized cylinder modules into critical virtual-pipeline assets where buried pipelines lack permits. In June 2025, a techno-economic evaluation in Advanced Science demonstrated that 350-bar compressed and metal-hydride storage configurations reduce refueling station land footprints by 65% in urban centers. Industrial gas distributors therefore establish multi-year frame agreements for 40-foot ISO composite cylinder modules that maximize daily station dispensing throughput.
Risk Assessment of the Hydrogen Storage Tank And Transportation Market: Operational and Formulation Friction
High aerospace-grade carbon-fiber shell costs and polymer liner blistering during rapid decompression represent the primary technical hurdles restricting commercial vessel adoption. Carbon-fiber composite overwraps account for more than half of total Type IV cylinder manufacturing cost, while cyclic thermal swings between minus 40 and plus 85 degrees Celsius stress inner thermoplastic liners. In March 2025, a materials mechanics study in Materials demonstrated that elastomer-toughened polyamide liners require precise thermal crystallinity control to prevent micro-cracking under 70 MPa cyclic loading. Fleet engineers therefore mandate burst testing and 15,000-cycle fatigue qualification before certifying cylinder vendors. When industrial plants compare road trailer delivery against on-site industrial hydrogen electrolyzers, high composite trailer capex slows fleet expansion across price-sensitive chemical buyers.
Commercial Opportunity Analysis: Formulation Differentiation and Value-Add Formats
Vessel manufacturers capture higher gross margins by engineering sub-cooled liquid hydrogen dewars and cryo-adsorption tanks that suppress boil-off losses during long-haul shipping. Conventional cryogenic tanks lose 0.5% to 2.0% of payload daily through parasitic heat ingress, eroding commercial margins across maritime and heavy rail fuel distribution. Suppliers capturing premium port and mobility tenders integrate multi-layer vacuum super-insulation that connects directly with cryogenic liquid hydrogen supply terminals. In June 2026, a techno-economic investigation in Nature Communications established that capturing and reliquefying 1.5 to 70 tonnes per day of liquid hydrogen boil-off gas is cost-effective whenever hydrogen exceeds USD 0.90 per kilogram. Manufacturers offering zero-boil-off cryogenic ISO containers and automated dry-towpreg Type IV cylinders secure multi-year supply contracts across global export hubs.
Hydrogen Storage Tank And Transportation Market by Country (2026 to 2036)
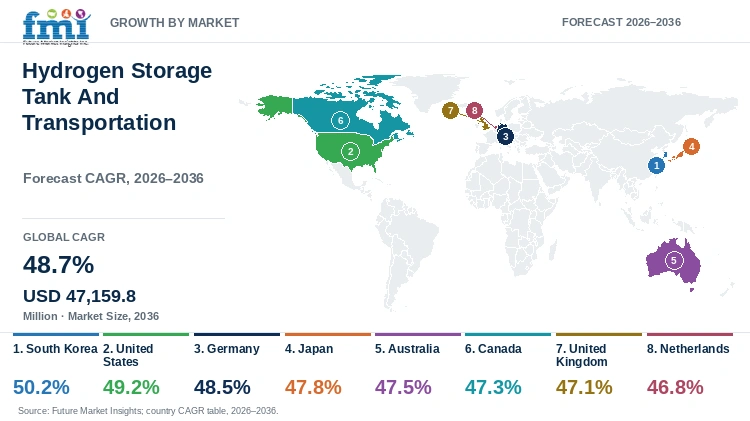
Future Market Insights estimates place South Korea at the front of national hydrogen containment growth with a 50.2% annual rate through 2036, whereas the Netherlands records 46.8%. Regional demand across Asian, North American, and European freight corridors tracks 500-bar road permits and refueling station subsidies.
Table 7: Country CAGR and Primary Growth Levers for the Hydrogen Storage Tank And Transportation Market (CAGR percentage and operational drivers), 2026 to 2036
| Country | CAGR (2026 to 2036) | Primary Growth Lever |
|---|---|---|
| South Korea | 50.2% | National fuel-cell bus fleet mandates and 450-bar petrochemical filling centers |
| United States | 49.2% | Regional Clean Hydrogen Hubs (H2Hubs) and ultra-pure semiconductor gas logistics |
| Germany | 48.5% | Heavy-duty fuel-cell freight corridors and ADR-certified 500-bar swap containers |
| Japan | 47.8% | Compact 820-bar urban station cascades and maritime liquid hydrogen import terminals |
| Australia | 47.5% | Remote mining haul-truck refueling modules and coastal green-hydrogen export hubs |
| Canada | 47.3% | Federal hydrogen codes roadmap and cold-weather 500-bar intermodal freight corridors |
| United Kingdom | 47.1% | Teesside and Humber industrial cluster tube-trailer bridging and bus depot cascades |
| Netherlands | 46.8% | Port of Rotterdam import terminals and intermodal 40-foot ISO barge containers |
Source: Future Market Insights analysis
South Korea Hydrogen Storage Tank And Transportation Market Outlook (2026 to 2036)
In December 2025, Air Liquide and Hyundai Motor Group expanded their strategic hydrogen mobility partnership in South Korea across 2,000 municipal fuel-cell buses, 37,000 passenger vehicles, and Daesan's 450-bar petrochemical filling center. That dense national fleet rollout creates immediate operational demand for high-pressure composite tube trailers capable of servicing urban bus depots multiple times per day. Through 2036, South Korean containment demand will compound 50.2% yearly until 2036, propelled by Ministry of Trade, Industry and Energy clean-hydrogen mobility mandates. Scarce metropolitan land parcels and strict high-pressure gas safety setback distances still constrain station storage footprints across Seoul and Incheon. Equipment vendors overcome space limits by supplying vertical 820-bar cascade racks and 450-bar composite multi-element gas containers.
Key takeaway: Across South Korea, municipal fuel-cell bus deployments and 450-bar filling hubs are projected to drive rapid procurement of high-pressure composite tube trailers.
United States Hydrogen Storage Tank And Transportation Market Outlook (2026 to 2036)
Wide geographic distances between Gulf Coast and Southwestern hydrogen production plants and coastal heavy-freight and semiconductor clusters shape United States storage and transport procurement. In July 2026, Air Liquide committed over USD 160 million in Arizona to construct ultra-pure hydrogen supply and high-pressure storage infrastructure for advanced semiconductor wafer fabrication. United States hydrogen vessel orders expand at a 49.2% annual rate until 2036, supported by federal Regional Clean Hydrogen Hubs and clean-fuel tax credits. Strict Department of Transportation special permits for 500-bar composite trailers still lengthen commissioning timelines. Manufacturers like Worthington Enterprises and Chart Industries address regulatory gates by pre-certifying DOT-compliant modular composite tube trailers and liquid tankers.
Key takeaway: Across the United States, regional hydrogen hub buildouts and semiconductor gas contracts are anticipated to accelerate 500-bar composite trailer fleet orders.
Germany Hydrogen Storage Tank And Transportation Market Outlook (2026 to 2036)
Delays in completing cross-country hydrogen transmission pipelines across industrial Rhine-Ruhr and southern German manufacturing clusters force chemical and steel buyers to rely on road and rail container logistics. In September 2026, Air Liquide, Daimler Truck, and Volvo Group advanced European heavy-duty hydrogen freight corridors following 600,000 kilometers of fuel-cell truck trials linking German and Dutch hubs. German orders for high-pressure storage tanks and transport modules climb 48.5% per year until 2036, driven by federal heavy-mobility subsidies. Strict European ADR dangerous-goods tunnel and axle-weight limits still restrict payload mass per highway trailer. Suppliers counter axle-weight caps by delivering lightweight Type IV carbon-fiber 40-foot swap-body containers rated at 500 bar.
Key takeaway: Within Germany, heavy-duty fuel-cell truck corridors and industrial decarbonization contracts will sustain procurement of ADR-certified Type IV swap containers.
Japan Hydrogen Storage Tank And Transportation Market Outlook (2026 to 2036)
Stringent High Pressure Gas Safety Act seismic codes and high urban compression electricity tariffs govern hydrogen station buffer and marine transport engineering across Japan. In March 2026, Japan's New Energy and Industrial Technology Development Organization documented technical readiness for large-scale hydrogen power co-firing at Himeji No. 2 Power Station following testing completed in September 2025. Japanese adoption of high-pressure cascades and liquid carriers will progress 47.8% yearly to 2036, underpinned by marine import terminals and truck plazas. High power tariffs for 820-bar compressors still pressure station margins. Japanese engineering groups mitigate compression costs by pairing liquid hydrogen delivery tankers with compact cryo-compressed station buffer banks.
Key takeaway: In Japan, strict seismic station codes and maritime hydrogen import terminals are estimated to guide demand for compact high-pressure cascades and cryogenic tanks.
Australia Hydrogen Storage Tank And Transportation Market Outlook (2026 to 2036)
In August 2026, Australia's CSIRO HyResource program documented successful cold commissioning and contractor handover of the 2.6-megawatt Hydrogen Refueller at H2Perth targeting up to 1.0 tonne per day of high-pressure dispensing capacity. Australia's vast mining haulage distances across the Pilbara and coastal solar electrolysis hubs create specialized demand for ruggedized mobile storage skids that operate without pipeline connections. Australian hydrogen containment and transport demand advance 47.5% yearly through 2036, aided by federal Hydrogen Headstart funding and mining trials. Extreme desert ambient temperatures above 45 degrees Celsius and unpaved road vibration challenge composite cylinder liner durability. Suppliers engineer heat-stabilized Type IV container skids with reinforced steel exo-frames for remote Australian mine sites.
Key takeaway: In Australia, remote mining haul-truck refueling and coastal electrolysis hubs are projected to sustain demand for ruggedized mobile composite storage skids.
Netherlands Hydrogen Storage Tank And Transportation Market Outlook (2026 to 2036)
Abundant low-cost hydroelectric and natural gas feedstocks across British Columbia, Alberta, and Quebec anchor Canada's merchant hydrogen production and cross-border rail and highway distribution networks. In March 2026, Natural Resources Canada published its updated Canadian Hydrogen Codes and Standards Roadmap and industry profiles documenting nearly 1,500 full-time hydrogen technology positions in British Columbia and USD 500 million in federal refueling infrastructure support. Canadian demand for composite storage cylinders and transport skids will grow 47.3% per year to 2036, reinforced by heavy freight corridors. Sub-zero winter temperatures across prairie highways risk embrittling conventional valve seals. Vessel manufacturers qualify cold-weather elastomer seals and insulated 500-bar Type IV tube trailers for Canadian fleet operators.
Key takeaway: In Canada, federal hydrogen codes and cold-weather freight corridors are predicted to drive orders for low-temperature-certified 500-bar composite tube trailers.
United Kingdom Hydrogen Storage Tank And Transportation Market Outlook (2026 to 2036)
During July 2026, Britain's Department for Energy Security and Net Zero reported that national grid flexibility markets achieved their first-year 170-megawatt industrial target while advancing Hydrogen Allocation Round electrolytic capacity contracts. Industrial cluster decarbonization across Teesside, Humber, and HyNet North West compels British electrolytic producers to deploy mobile tube trailers ahead of regional pipeline completion. British hydrogen vessel and trailer procurement increase 47.1% yearly until 2036, influenced by municipal bus depots and industrial fuel switching. Delays in finalizing grid-connection queues and storage business-model subsidies still slow permanent stationary tank installations. UK gas distributors bridge industrial customers by leasing 500-bar composite multi-element gas containers on flexible multi-year service contracts.
Key takeaway: Across Britain, industrial cluster fuel-switching and transit bus depots are estimated to sustain leasing and purchases of 500-bar composite trailers.
Netherlands Hydrogen Storage Tank And Transportation Market Outlook (2026 to 2036)
Severe electrical grid congestion and nitrogen-deposition permitting caps across Dutch industrial provinces make intermodal barge and road hydrogen containers necessary for linking coastal import terminals with inland chemical parks. In November 2025, the Port of Rotterdam Authority launched its formal market consultation running through January 2026 to remove storage and transport bottlenecks across hydrogen carrier import terminals targeting 400 kilotonnes by 2030. Dutch procurement of multimodal hydrogen tanks will rise 46.8% per year to 2036, resulting from Rotterdam terminal buildouts and Rhine barge integration. Coastal safety zoning limits low-pressure spheres near port berths. Operators therefore specify 40-foot ISO high-pressure composite containers for rapid crane transfer between port electrolyzers and inland barges.
Key takeaway: In the Netherlands, Port of Rotterdam import terminals and inland barge corridors are forecast to anchor procurement of 40-foot ISO composite gas containers.
Full report country CAGRs cover: North America; Latin America; Western Europe; Eastern Europe; East Asia; South Asia and Pacific; Middle East and Africa.
Who are the notable companies in the hydrogen storage tank and transportation market?
Hexagon Purus ASA, Worthington Enterprises Inc., Chart Industries Inc., Air Liquide S.A., Linde plc, Luxfer Holdings PLC, NPROXX B.V., and Quantum Fuel Systems LLC are the notable companies in the hydrogen storage tank and transportation market.
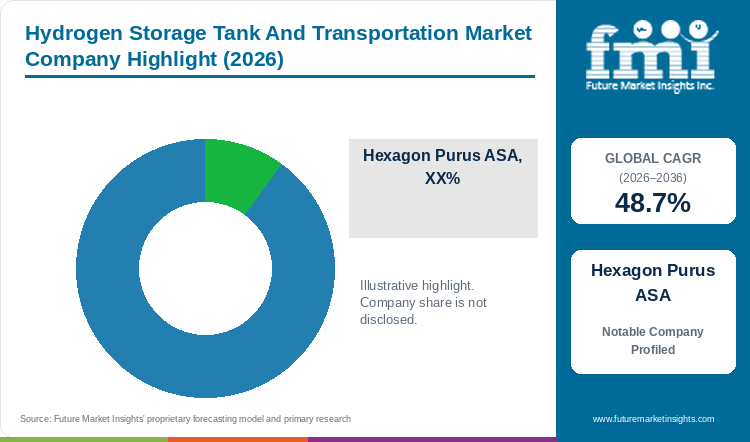
FMI identifies a moderately concentrated hydrogen containment sector split among specialized Type IV composite vessel manufacturers, cryogenic equipment engineers, and integrated industrial gas majors. Composite cylinder specialists supply lightweight 350-bar to 700-bar onboard fuel racks and 450-bar to 500-bar road distribution containers. Cryogenic and industrial gas corporations provide liquid hydrogen trailers, bulk storage spheres, and turnkey refueling station cascades.
- Composite Cylinder and Distribution Module Specialists: Hexagon Purus ASA and Worthington Enterprises Inc. with Luxfer Holdings PLC manufacture Type III and Type IV composite cylinders and containerized distribution skids.
- Cryogenic Storage and Liquid Transport Engineers: Chart Industries Inc. and NPROXX B.V. with Quantum Fuel Systems LLC supply liquid hydrogen trailers, bulk cryogenic tanks, and high-pressure composite vessels.
- Integrated Industrial Gas and Fleet Operators: Air Liquide S.A. and Linde plc operate high-pressure filling centers, cryogenic tanker fleets, and station storage cascades.
Competitive Benchmarking: Hydrogen Storage Tank And Transportation Market
Table 8: Competitive Benchmarking for the Hydrogen Storage Tank And Transportation Market (qualitative capability ratings), 2026
| Company | Composite Vessel Breadth | High-Bar / Cryogenic Depth | Fleet & Hub Access | Geographic Reach |
|---|---|---|---|---|
| Hexagon Purus ASA | High | High | High | High |
| Worthington Enterprises Inc. | High | Medium | High | High |
| Chart Industries Inc. | Medium | High | High | High |
| Air Liquide S.A. | Medium | High | High | High |
| Linde plc | Medium | High | High | High |
| Luxfer Holdings PLC | High | Medium | Medium | Medium |
| NPROXX B.V. | High | High | Medium | Medium |
| Quantum Fuel Systems LLC | High | Medium | Medium | Medium |
Scoring basis: Capability tiers evaluate documented vessel pressure ratings from 200 bar to 700 bar and cryogenic liquid containment capacity. Fleet access and geographic ratings reflect verified ADR, DOT, and ISO transport certifications and multi-region manufacturing plants.
Key Developments in the Hydrogen Storage Tank And Transportation Market
- In March 2026, Hexagon Purus ASA received purchase orders to deliver Type IV composite hydrogen distribution containers to a Central European energy company for commercial and industrial refueling.
- In July 2026, Worthington Enterprises Inc. reported USD 1.4 billion in fiscal 2026 net sales (up 20%) while scaling its sustainable energy composite cylinder joint venture.
- In February 2026, Linde plc reported USD 33,986 million in full-year 2025 sales while expanding clean hydrogen production and high-pressure distribution infrastructure.
Key Players in the Hydrogen Storage Tank And Transportation Market
Composite Cylinder and Modular Skid Specialists
- Hexagon Purus ASA
- Worthington Enterprises Inc.
- Luxfer Holdings PLC
Cryogenic Tank and High-Pressure Vessel Engineers
- Chart Industries Inc.
- NPROXX B.V.
- Quantum Fuel Systems LLC
Integrated Industrial Gas and Refueling Network Operators
- Air Liquide S.A.
- Linde plc
Hydrogen Storage Tank And Transportation Market - Report Scope
Table 9: Report Scope for the Hydrogen Storage Tank And Transportation Market (coverage fields and definitions), 2026 to 2036
| Coverage field | Report scope |
|---|---|
| Market breakdown | Modular System, Pressure Rating, Vessel Classification, End Use, Digital and Connectivity Tier, Operating Duty Class |
| Quantitative Units | USD Million |
| Market Definition | Includes commercial supplier valuation from compressed hydrogen storage cylinders (Types I to IV), cryogenic liquid H2 tanks, modular fuel storage systems, tube trailers, and ISO containers. |
| Regions Covered | North America, Latin America, Western Europe, Eastern Europe, East Asia, South Asia and Pacific, Middle East and Africa |
| Countries Covered | South Korea, United States, Germany, Japan, Australia, Netherlands, China, United Kingdom, and additional countries in the full report |
| Key Companies Covered | Hexagon Purus ASA, Worthington Enterprises Inc., Chart Industries Inc., Air Liquide S.A., Linde plc, Luxfer Holdings PLC, NPROXX B.V., Quantum Fuel Systems LLC |
| Forecast Period | 2026 to 2036 |
| Approach | Primary and secondary research with top-down and bottom-up market triangulation. |
Hydrogen Storage Tank And Transportation Market - Research Methodology
Table 10: Research Methodology for the Hydrogen Storage Tank And Transportation Market (research methods and approach), 2026 edition
| Method | Approach |
|---|---|
| Primary Research | FMI analysts gathered input from manufacturers, service providers, technology developers, distributors, end users, procurement teams, and subject-matter experts across the hydrogen storage tank and transportation value chain to validate purchasing decisions, approval requirements, and adoption barriers. |
| Desk & Secondary Research | Desk research covered government statistics, regulatory publications, trade data, industry associations, technical literature, standards, company filings, investor presentations, product information, and official corporate announcements. |
| Market Sizing and Forecasting | The market assessment combined baseline values with historical performance, segment structure, pricing and volume indicators, adoption levels, and country demand conditions using top-down and bottom-up approaches from 2026 to 2036. |
| Country Demand Reconciliation | Country-level projections reconciled national regulatory mandates, public infrastructure funding, installed-base replacement cycles, and domestic procurement frameworks across evaluated regions. |
| Operational Benchmark Traceability | Volume, unit-economics, and facility allocation indicators in Tables 2, 3, and 4 were reconciled against official government agency records, peer-reviewed studies, and corporate disclosures. |
| Data Triangulation and Validation | Estimates were cross-checked against independent public indicators, company revenues, trade patterns, and primary interviews while excluding adjacent categories to prevent double counting. |
Hydrogen Storage Tank And Transportation Market by Segments
Hydrogen Storage Tank And Transportation Market segmented by Modular System:
- Modular Fuel Storage Systems
- Tube Trailers and ISO Containers
- Stationary Bulk Storage Cascades
- Swappable Pod Racks
Hydrogen Storage Tank And Transportation Market segmented by Pressure Rating:
- 200 to 500 Bar Vessels
- Above 500 Bar Type IV Cylinders
- Below 200 Bar and Cryogenic Liquid
Hydrogen Storage Tank And Transportation Market segmented by Vessel Classification:
- Type IV Carbon-Fiber Composite
- Type III Metal-Lined Composite
- Type I and Type II Steel Cylinders
Hydrogen Storage Tank And Transportation Market segmented by End Use:
- Hydrogen Refueling Stations and Mobility
- Industrial Refining and Ammonia
- Grid and Maritime Transport
- Semiconductor and Specialty Gas
Hydrogen Storage Tank And Transportation Market segmented by Digital and Duty Tier:
- IIoT-Connected and Edge-Telemetry Enabled
- Standalone Conventional Electromechanical
- Heavy-Duty Continuous Industrial Operation
- Medium-Duty Commercial Cycling
- Light-Duty Intermittent Service
Hydrogen Storage Tank And Transportation Market by Region
- North America
- United States
- Canada
- Latin America
- Brazil
- Mexico
- Argentina
- Chile
- Western Europe
- Germany
- France
- United Kingdom
- Italy
- Spain
- Benelux
- Nordics
- Eastern Europe
- Poland
- Czech Republic
- Romania
- Hungary
- East Asia
- China
- Japan
- South Korea
- South Asia and Pacific
- India
- ASEAN
- Australia and New Zealand
- Middle East and Africa
- GCC Countries
- South Africa
- Türkiye
- Israel
Research Sources and Bibliography
- [1] U.S. Department of Energy Hydrogen Program. (2025, April 28). Onboard Type IV Compressed Hydrogen Storage System - Cost and Performance Status (Record 24006). U.S. Department of Energy.
- [2] Huo, G., Zhang, Y., Han, X., Liu, H., Yan, X., Huang, G., Li, R., Li, S., Zheng, K., & Chen, H. (2026, January 15). Hydrogen Permeation Behavior of Locally Reinforced Type IV Hydrogen Storage Vessels. Polymers (Basel), 18(2), 230 (PubMed PMID 41599525).
- [3] Li, R., Zheng, K., & Wuhan University of Technology Group. (2026, March 5). Multi-Objective Optimization of the Dry Towpreg Filament Winding Process for Carbon/Epoxy Type IV Hydrogen Storage Vessels. Polymers (Basel), 18(5), 639 (PubMed PMID 41829337).
- [4] Pal, N. (2025, November 1). Marine Hydrogen Demonstration Technical Report (OSTI 3375699). U.S. Department of Energy Office of Scientific and Technical Information.
- [5] Wang, W., Zhao, G., et al. (2025, July 1). Polyamide 6 as a Liner Material for Type IV Hydrogen Storage Cylinders: Performance Challenges and Modification Strategies. Polymers (Basel), 17(13), 1848 (PMC PMCID PMC12252155).
- [6] Alreshidi, M. A. (2025, July 10). Hydrogen in transport: a review of opportunities, challenges, and sustainability concerns. RSC Advances, 15(29), 23874 (PMC PMCID PMC12242986).
- [7] Marjani, S. R., et al. (2025, February 22). Assessing hydrogen as an alternative fuel for rail transport - a case study. Scientific Reports, 15(1), 6449 (PMC PMCID PMC11846835).
- [8] Peng, P., et al. (2025, June 15). Technoeconomic Insights into Metal Hydrides for Stationary Hydrogen Storage. Advanced Science, 12(21), e2415736 (PubMed PMID 40179034).
- [9] Zhang, L., et al. (2025, March 19). Enhancement of Fracture Toughness of Inner Liner Material for Type IV Hydrogen Storage Cylinders Based on Molecular Dynamics Method. Materials (Basel), 18(6), 1363 (PubMed PMID 40141645).
- [10] Broom, D. P., et al. (2026, June 10). Capture, storage, and re-use of liquid hydrogen boil-off for aviation and aerospace applications. Nature Communications (PubMed PMID 42270671).
- [11] Air Liquide S.A. (2025, December 4). Air Liquide and Hyundai Motor Group advance global partnership to accelerate hydrogen economy. Air Liquide Group Newsroom.
- [12] Air Liquide S.A. (2026, July 16). Air Liquide invests over 160M USD in the U.S. to supply advanced chips manufacturing in Arizona. Air Liquide Group Newsroom.
- [13] Air Liquide S.A. (2026, September 15). Industry leaders scale full value chain for hydrogen mobility across Europe. Air Liquide Group Newsroom.
- [14] New Energy and Industrial Technology Development Organization [NEDO]. (2026, March 23). Hydrogen Power Generation Reaches Technical Readiness (Green Innovation Fund Projects). NEDO Green Innovation Fund Portal.
- [15] Commonwealth Scientific and Industrial Research Organisation [CSIRO]. (2026, August 31). Hydrogen Refueller @H2Perth - HyResource Project Specification and Commissioning Status. CSIRO HyResource National Hydrogen Portal.
- [16] Natural Resources Canada. (2026, March 11). Canadian Hydrogen Codes and Standards Roadmap and National Hydrogen Strategy Update. Government of Canada Natural Resources.
- [17] UK Department for Energy Security and Net Zero. (2026, July 13). Clean flexibility roadmap: July 2026 update and Hydrogen Allocation Round deployment. GOV.UK Official Publications.
- [18] Port of Rotterdam Authority. (2025, November 11). Market consultation for the development of hydrogen (carrier) import terminals. Port of Rotterdam Official Newsroom.
- [19] Hexagon Purus ASA. (2026, March 6). Hexagon Purus receive orders for delivery of hydrogen distribution units to a leading European energy company. Hexagon Purus Newsroom.
- [20] Worthington Enterprises, Inc. (2026, July 30). Worthington Enterprises 2026 Annual Report and Form 10-K. U.S. Securities and Exchange Commission (SEC).
- [21] Linde plc. (2026, February 5). Linde Reports Full-Year and Fourth-Quarter 2025 Results. Linde plc Investor Relations.
- [22] Hexagon Purus ASA. (2026, February 10). Hexagon Purus ASA: Results for the fourth quarter 2025. Hexagon Purus Newsroom.
- [23] Chart Industries, Inc. (2026, February 27). Chart Industries, Inc. Form 10-K Annual Report for the Year Ended December 31, 2025. U.S. Securities and Exchange Commission (SEC).
This bibliography is provided for reader reference and is not exhaustive. The full report contains the complete reference list and detailed citations.
This Report Answers
- How large is the hydrogen storage tank and transportation market in 2026 and what is forecast for 2036?
- Which refueling and logistics pressures support demand for hydrogen storage and transport vessels?
- Why do Modular Fuel Storage Systems lead the modular system category?
- Why do 200 to 500 bar vessels lead the pressure rating category globally?
- How do growth rates differ across South Korea, the United States, Germany, and Japan?
- Which leading companies supply composite cylinders, tube trailers, and cryogenic storage today?
- What limits adoption or supplier switching in the hydrogen storage tank and transportation market?
- What should buyers evaluate before purchasing hydrogen storage tanks and transport trailers?
Table of Content
- Key Takeaways
- Market Size and CAGR
- Top Growth Driver
- Fastest Growing Segment
- Leading Region
- Key Companies
- Emerging Opportunities
- Executive Summary
- Global Market Outlook
- Demand-side Trends
- Supply-side Trends
- Technology Roadmap Analysis
- Analysis and Recommendations
- Analyst Perspective (What is happening? Why now? What should investors know?)
- Key Questions Answered
- How large is the market?
- What is the CAGR?
- What are key trends?
- Which region dominates?
- Who are the leaders?
Read More...
- Market Overview
- Market Coverage / Taxonomy
- Market Definition / Scope / Limitations
- Research Methodology
- Chapter Orientation
- Analytical Lens and Working Hypotheses
- Market Structure, Signals, and Trend Drivers
- Benchmarking and Cross-market Comparability
- Market Sizing, Forecasting, and Opportunity Mapping
- Research Design and Evidence Framework
- Desk Research Programme (Secondary Evidence)
- Expert Input and Fieldwork (Primary Evidence)
- Tooling, Models, and Reference Databases
- Data Engineering and Model Build
- Quality Assurance and Audit Trail
- Market Background
- Market Dynamics (Drivers, Restraints, Opportunity, Trends)
- Scenario Forecast (Optimistic, Likely, Conservative)
- Impact Analysis
- AI Impact
- Sustainability Impact
- Regulatory Impact
- Technology Impact
- Consumer / Buyer Analysis
- Purchase Drivers
- Adoption Barriers
- Buyer Journey
- Opportunity Map Analysis
- Product Life Cycle Analysis
- Supply Chain Analysis
- Investment Feasibility Matrix
- Value Chain Analysis
- PESTLE and Porter's Analysis
- Regulatory Landscape
- Regional Parent Market Outlook
- Production and Consumption Statistics
- Import and Export Statistics
- Global Market Analysis and Forecast, 2021 to 2036
- Historical Market Size Value (USD Million) Analysis, 2021 to 2025
- Current and Future Market Size Value (USD Million) Projections, 2026 to 2036
- Y-o-Y Growth Trend Analysis
- Absolute $ Opportunity Analysis
- Global Market Pricing Analysis, 2021 to 2036
- Global Market Analysis and Forecast, By Modular System, 2021 to 2036
- Introduction / Key Findings
- Historical Market Size Value (USD Million) Analysis By Modular System, 2021 to 2025
- Current and Future Market Size Value (USD Million) Analysis and Forecast By Modular System, 2026 to 2036
- Modular Fuel Storage Systems
- Tube Trailers and ISO Containers
- Stationary Bulk Storage Cascades
- Swappable Pod Racks
- Y-o-Y Growth Trend Analysis By Modular System, 2021 to 2025
- Absolute $ Opportunity Analysis By Modular System, 2026 to 2036
- Global Market Analysis and Forecast, By Pressure Rating, 2021 to 2036
- Introduction / Key Findings
- Historical Market Size Value (USD Million) Analysis By Pressure Rating, 2021 to 2025
- Current and Future Market Size Value (USD Million) Analysis and Forecast By Pressure Rating, 2026 to 2036
- 200 to 500 Bar Vessels
- Above 500 Bar Type IV Cylinders
- Below 200 Bar and Cryogenic Liquid
- Y-o-Y Growth Trend Analysis By Pressure Rating, 2021 to 2025
- Absolute $ Opportunity Analysis By Pressure Rating, 2026 to 2036
- Global Market Analysis and Forecast, By Vessel Classification, 2021 to 2036
- Introduction / Key Findings
- Historical Market Size Value (USD Million) Analysis By Vessel Classification, 2021 to 2025
- Current and Future Market Size Value (USD Million) Analysis and Forecast By Vessel Classification, 2026 to 2036
- Type IV Carbon-Fiber Composite
- Type III Metal-Lined Composite
- Type I and Type II Steel Cylinders
- Y-o-Y Growth Trend Analysis By Vessel Classification, 2021 to 2025
- Absolute $ Opportunity Analysis By Vessel Classification, 2026 to 2036
- Global Market Analysis and Forecast, By End Use, 2021 to 2036
- Introduction / Key Findings
- Historical Market Size Value (USD Million) Analysis By End Use, 2021 to 2025
- Current and Future Market Size Value (USD Million) Analysis and Forecast By End Use, 2026 to 2036
- Hydrogen Refueling Stations and Mobility
- Industrial Refining and Ammonia
- Grid and Maritime Transport
- Semiconductor and Specialty Gas
- Y-o-Y Growth Trend Analysis By End Use, 2021 to 2025
- Absolute $ Opportunity Analysis By End Use, 2026 to 2036
- Global Market Analysis and Forecast, By Digital and Duty Tier, 2021 to 2036
- Introduction / Key Findings
- Historical Market Size Value (USD Million) Analysis By Digital and Duty Tier, 2021 to 2025
- Current and Future Market Size Value (USD Million) Analysis and Forecast By Digital and Duty Tier, 2026 to 2036
- IIoT-Connected and Edge-Telemetry Enabled
- Standalone Conventional Electromechanical
- Heavy-Duty Continuous Industrial Operation
- Medium-Duty Commercial Cycling
- Light-Duty Intermittent Service
- Y-o-Y Growth Trend Analysis By Digital and Duty Tier, 2021 to 2025
- Absolute $ Opportunity Analysis By Digital and Duty Tier, 2026 to 2036
- Global Market Analysis and Forecast, By Region, 2021 to 2036
- Introduction
- Historical Market Size Value (USD Million) Analysis By Region, 2021 to 2025
- Current Market Size Value (USD Million) Analysis and Forecast By Region, 2026 to 2036
- North America
- Latin America
- Western Europe
- Eastern Europe
- East Asia
- South Asia and Pacific
- Middle East and Africa
- Market Attractiveness Analysis By Region
- North America Market Analysis and Forecast, By Country, 2021 to 2036
- Historical Market Size Value (USD Million) Trend Analysis By Market Taxonomy, 2021 to 2025
- Market Size Value (USD Million) Forecast By Market Taxonomy, 2026 to 2036
- By Country
- United States
- Canada
- By Modular System
- By Pressure Rating
- By Vessel Classification
- By End Use
- By Digital and Duty Tier
- By Country
- Market Attractiveness Analysis
- By Country
- By Modular System
- By Pressure Rating
- By Vessel Classification
- By End Use
- By Digital and Duty Tier
- Key Takeaways
- Latin America Market Analysis and Forecast, By Country
- Historical Market Size Value (USD Million) Trend Analysis By Market Taxonomy, 2021 to 2025
- Market Size Value (USD Million) Forecast By Market Taxonomy, 2026 to 2036
- By Country
- Brazil
- Mexico
- Argentina
- Chile
- By Modular System
- By Pressure Rating
- By Vessel Classification
- By End Use
- By Digital and Duty Tier
- By Country
- Market Attractiveness Analysis
- By Country
- By Modular System
- By Pressure Rating
- By Vessel Classification
- By End Use
- By Digital and Duty Tier
- Key Takeaways
- Western Europe Market Analysis and Forecast, By Country
- Historical Market Size Value (USD Million) Trend Analysis By Market Taxonomy, 2021 to 2025
- Market Size Value (USD Million) Forecast By Market Taxonomy, 2026 to 2036
- By Country
- Germany
- France
- United Kingdom
- Italy
- Spain
- Benelux
- Nordics
- By Modular System
- By Pressure Rating
- By Vessel Classification
- By End Use
- By Digital and Duty Tier
- By Country
- Market Attractiveness Analysis
- By Country
- By Modular System
- By Pressure Rating
- By Vessel Classification
- By End Use
- By Digital and Duty Tier
- Key Takeaways
- Eastern Europe Market Analysis and Forecast, By Country
- Historical Market Size Value (USD Million) Trend Analysis By Market Taxonomy, 2021 to 2025
- Market Size Value (USD Million) Forecast By Market Taxonomy, 2026 to 2036
- By Country
- Poland
- Czech Republic
- Romania
- Hungary
- By Modular System
- By Pressure Rating
- By Vessel Classification
- By End Use
- By Digital and Duty Tier
- By Country
- Market Attractiveness Analysis
- By Country
- By Modular System
- By Pressure Rating
- By Vessel Classification
- By End Use
- By Digital and Duty Tier
- Key Takeaways
- East Asia Market Analysis and Forecast, By Country
- Historical Market Size Value (USD Million) Trend Analysis By Market Taxonomy, 2021 to 2025
- Market Size Value (USD Million) Forecast By Market Taxonomy, 2026 to 2036
- By Country
- China
- Japan
- South Korea
- By Modular System
- By Pressure Rating
- By Vessel Classification
- By End Use
- By Digital and Duty Tier
- By Country
- Market Attractiveness Analysis
- By Country
- By Modular System
- By Pressure Rating
- By Vessel Classification
- By End Use
- By Digital and Duty Tier
- Key Takeaways
- South Asia and Pacific Market Analysis and Forecast, By Country
- Historical Market Size Value (USD Million) Trend Analysis By Market Taxonomy, 2021 to 2025
- Market Size Value (USD Million) Forecast By Market Taxonomy, 2026 to 2036
- By Country
- India
- ASEAN
- Australia and New Zealand
- By Modular System
- By Pressure Rating
- By Vessel Classification
- By End Use
- By Digital and Duty Tier
- By Country
- Market Attractiveness Analysis
- By Country
- By Modular System
- By Pressure Rating
- By Vessel Classification
- By End Use
- By Digital and Duty Tier
- Key Takeaways
- Middle East and Africa Market Analysis and Forecast, By Country
- Historical Market Size Value (USD Million) Trend Analysis By Market Taxonomy, 2021 to 2025
- Market Size Value (USD Million) Forecast By Market Taxonomy, 2026 to 2036
- By Country
- GCC Countries
- South Africa
- Türkiye
- Israel
- By Modular System
- By Pressure Rating
- By Vessel Classification
- By End Use
- By Digital and Duty Tier
- By Country
- Market Attractiveness Analysis
- By Country
- By Modular System
- By Pressure Rating
- By Vessel Classification
- By End Use
- By Digital and Duty Tier
- Key Takeaways
- Key Countries Market Analysis
- United States
- Pricing Analysis
- Market Share Analysis, 2025
- By Modular System
- By Pressure Rating
- By Vessel Classification
- By End Use
- By Digital and Duty Tier
- Canada
- Pricing Analysis
- Market Share Analysis, 2025
- By Modular System
- By Pressure Rating
- By Vessel Classification
- By End Use
- By Digital and Duty Tier
- Mexico
- Pricing Analysis
- Market Share Analysis, 2025
- By Modular System
- By Pressure Rating
- By Vessel Classification
- By End Use
- By Digital and Duty Tier
- Brazil
- Pricing Analysis
- Market Share Analysis, 2025
- By Modular System
- By Pressure Rating
- By Vessel Classification
- By End Use
- By Digital and Duty Tier
- Chile
- Pricing Analysis
- Market Share Analysis, 2025
- By Modular System
- By Pressure Rating
- By Vessel Classification
- By End Use
- By Digital and Duty Tier
- Germany
- Pricing Analysis
- Market Share Analysis, 2025
- By Modular System
- By Pressure Rating
- By Vessel Classification
- By End Use
- By Digital and Duty Tier
- United Kingdom
- Pricing Analysis
- Market Share Analysis, 2025
- By Modular System
- By Pressure Rating
- By Vessel Classification
- By End Use
- By Digital and Duty Tier
- Italy
- Pricing Analysis
- Market Share Analysis, 2025
- By Modular System
- By Pressure Rating
- By Vessel Classification
- By End Use
- By Digital and Duty Tier
- Spain
- Pricing Analysis
- Market Share Analysis, 2025
- By Modular System
- By Pressure Rating
- By Vessel Classification
- By End Use
- By Digital and Duty Tier
- France
- Pricing Analysis
- Market Share Analysis, 2025
- By Modular System
- By Pressure Rating
- By Vessel Classification
- By End Use
- By Digital and Duty Tier
- India
- Pricing Analysis
- Market Share Analysis, 2025
- By Modular System
- By Pressure Rating
- By Vessel Classification
- By End Use
- By Digital and Duty Tier
- ASEAN
- Pricing Analysis
- Market Share Analysis, 2025
- By Modular System
- By Pressure Rating
- By Vessel Classification
- By End Use
- By Digital and Duty Tier
- Australia and New Zealand
- Pricing Analysis
- Market Share Analysis, 2025
- By Modular System
- By Pressure Rating
- By Vessel Classification
- By End Use
- By Digital and Duty Tier
- China
- Pricing Analysis
- Market Share Analysis, 2025
- By Modular System
- By Pressure Rating
- By Vessel Classification
- By End Use
- By Digital and Duty Tier
- Japan
- Pricing Analysis
- Market Share Analysis, 2025
- By Modular System
- By Pressure Rating
- By Vessel Classification
- By End Use
- By Digital and Duty Tier
- South Korea
- Pricing Analysis
- Market Share Analysis, 2025
- By Modular System
- By Pressure Rating
- By Vessel Classification
- By End Use
- By Digital and Duty Tier
- Poland
- Pricing Analysis
- Market Share Analysis, 2025
- By Modular System
- By Pressure Rating
- By Vessel Classification
- By End Use
- By Digital and Duty Tier
- Hungary
- Pricing Analysis
- Market Share Analysis, 2025
- By Modular System
- By Pressure Rating
- By Vessel Classification
- By End Use
- By Digital and Duty Tier
- Türkiye
- Pricing Analysis
- Market Share Analysis, 2025
- By Modular System
- By Pressure Rating
- By Vessel Classification
- By End Use
- By Digital and Duty Tier
- South Africa
- Pricing Analysis
- Market Share Analysis, 2025
- By Modular System
- By Pressure Rating
- By Vessel Classification
- By End Use
- By Digital and Duty Tier
- Australia
- Pricing Analysis
- Market Share Analysis, 2025
- By Modular System
- By Pressure Rating
- By Vessel Classification
- By End Use
- By Digital and Duty Tier
- Netherlands
- Pricing Analysis
- Market Share Analysis, 2025
- By Modular System
- By Pressure Rating
- By Vessel Classification
- By End Use
- By Digital and Duty Tier
- United States
- Market Structure Analysis
- Competition Dashboard
- Competition Benchmarking
- Market Share Analysis of Top Players
- By Regional
- By Modular System
- By Pressure Rating
- By Vessel Classification
- By End Use
- By Digital and Duty Tier
- Emerging Startups
- Innovation Benchmarking
- Competition Analysis
- Competition Deep Dive
- Hexagon Purus ASA
- Overview
- Product Portfolio
- Profitability by Market Segments
- Sales Footprint
- Strategy Overview
- Marketing Strategy
- Product Strategy
- Channel Strategy
- Worthington Enterprises Inc.
- Chart Industries Inc.
- Air Liquide S.A.
- Linde plc
- Luxfer Holdings PLC
- NPROXX B.V.
- Quantum Fuel Systems LLC
- Hexagon Purus ASA
- Case Studies
- Success Stories
- Recent Developments
- Competition Deep Dive
- Assumptions & Acronyms Used
List of Tables
- Table 1: Global Market Value (USD Million) Forecast by Region, 2021 to 2036
- Table 2: Global Market Value (USD Million) Forecast by Modular System, 2021 to 2036
- Table 3: Global Market Value (USD Million) Forecast by Pressure Rating, 2021 to 2036
- Table 4: Global Market Value (USD Million) Forecast by Vessel Classification, 2021 to 2036
- Table 5: Global Market Value (USD Million) Forecast by End Use, 2021 to 2036
- Table 6: Global Market Value (USD Million) Forecast by Digital and Duty Tier, 2021 to 2036
- Table 7: North America Market Value (USD Million) Forecast by Country, 2021 to 2036
- Table 8: North America Market Value (USD Million) Forecast by Modular System, 2021 to 2036
- Table 9: North America Market Value (USD Million) Forecast by Pressure Rating, 2021 to 2036
- Table 10: North America Market Value (USD Million) Forecast by Vessel Classification, 2021 to 2036
- Table 11: North America Market Value (USD Million) Forecast by End Use, 2021 to 2036
- Table 12: North America Market Value (USD Million) Forecast by Digital and Duty Tier, 2021 to 2036
- Table 13: Latin America Market Value (USD Million) Forecast by Country, 2021 to 2036
- Table 14: Latin America Market Value (USD Million) Forecast by Modular System, 2021 to 2036
- Table 15: Latin America Market Value (USD Million) Forecast by Pressure Rating, 2021 to 2036
- Table 16: Latin America Market Value (USD Million) Forecast by Vessel Classification, 2021 to 2036
- Table 17: Latin America Market Value (USD Million) Forecast by End Use, 2021 to 2036
- Table 18: Latin America Market Value (USD Million) Forecast by Digital and Duty Tier, 2021 to 2036
- Table 19: Western Europe Market Value (USD Million) Forecast by Country, 2021 to 2036
- Table 20: Western Europe Market Value (USD Million) Forecast by Modular System, 2021 to 2036
- Table 21: Western Europe Market Value (USD Million) Forecast by Pressure Rating, 2021 to 2036
- Table 22: Western Europe Market Value (USD Million) Forecast by Vessel Classification, 2021 to 2036
- Table 23: Western Europe Market Value (USD Million) Forecast by End Use, 2021 to 2036
- Table 24: Western Europe Market Value (USD Million) Forecast by Digital and Duty Tier, 2021 to 2036
- Table 25: Eastern Europe Market Value (USD Million) Forecast by Country, 2021 to 2036
- Table 26: Eastern Europe Market Value (USD Million) Forecast by Modular System, 2021 to 2036
- Table 27: Eastern Europe Market Value (USD Million) Forecast by Pressure Rating, 2021 to 2036
- Table 28: Eastern Europe Market Value (USD Million) Forecast by Vessel Classification, 2021 to 2036
- Table 29: Eastern Europe Market Value (USD Million) Forecast by End Use, 2021 to 2036
- Table 30: Eastern Europe Market Value (USD Million) Forecast by Digital and Duty Tier, 2021 to 2036
- Table 31: East Asia Market Value (USD Million) Forecast by Country, 2021 to 2036
- Table 32: East Asia Market Value (USD Million) Forecast by Modular System, 2021 to 2036
- Table 33: East Asia Market Value (USD Million) Forecast by Pressure Rating, 2021 to 2036
- Table 34: East Asia Market Value (USD Million) Forecast by Vessel Classification, 2021 to 2036
- Table 35: East Asia Market Value (USD Million) Forecast by End Use, 2021 to 2036
- Table 36: East Asia Market Value (USD Million) Forecast by Digital and Duty Tier, 2021 to 2036
- Table 37: South Asia and Pacific Market Value (USD Million) Forecast by Country, 2021 to 2036
- Table 38: South Asia and Pacific Market Value (USD Million) Forecast by Modular System, 2021 to 2036
- Table 39: South Asia and Pacific Market Value (USD Million) Forecast by Pressure Rating, 2021 to 2036
- Table 40: South Asia and Pacific Market Value (USD Million) Forecast by Vessel Classification, 2021 to 2036
- Table 41: South Asia and Pacific Market Value (USD Million) Forecast by End Use, 2021 to 2036
- Table 42: South Asia and Pacific Market Value (USD Million) Forecast by Digital and Duty Tier, 2021 to 2036
- Table 43: Middle East and Africa Market Value (USD Million) Forecast by Country, 2021 to 2036
- Table 44: Middle East and Africa Market Value (USD Million) Forecast by Modular System, 2021 to 2036
- Table 45: Middle East and Africa Market Value (USD Million) Forecast by Pressure Rating, 2021 to 2036
- Table 46: Middle East and Africa Market Value (USD Million) Forecast by Vessel Classification, 2021 to 2036
- Table 47: Middle East and Africa Market Value (USD Million) Forecast by End Use, 2021 to 2036
- Table 48: Middle East and Africa Market Value (USD Million) Forecast by Digital and Duty Tier, 2021 to 2036
List of Figures
- Figure 1: Global Market Pricing Analysis
- Figure 2: Global Market Value (USD Million) Forecast 2021-2036
- Figure 3: Global Market Value Share and BPS Analysis by Modular System, 2026 and 2036
- Figure 4: Global Market Y-o-Y Growth Comparison by Modular System, 2026-2036
- Figure 5: Global Market Attractiveness Analysis by Modular System
- Figure 6: Global Market Value Share and BPS Analysis by Pressure Rating, 2026 and 2036
- Figure 7: Global Market Y-o-Y Growth Comparison by Pressure Rating, 2026-2036
- Figure 8: Global Market Attractiveness Analysis by Pressure Rating
- Figure 9: Global Market Value Share and BPS Analysis by Vessel Classification, 2026 and 2036
- Figure 10: Global Market Y-o-Y Growth Comparison by Vessel Classification, 2026-2036
- Figure 11: Global Market Attractiveness Analysis by Vessel Classification
- Figure 12: Global Market Value Share and BPS Analysis by End Use, 2026 and 2036
- Figure 13: Global Market Y-o-Y Growth Comparison by End Use, 2026-2036
- Figure 14: Global Market Attractiveness Analysis by End Use
- Figure 15: Global Market Value Share and BPS Analysis by Digital and Duty Tier, 2026 and 2036
- Figure 16: Global Market Y-o-Y Growth Comparison by Digital and Duty Tier, 2026-2036
- Figure 17: Global Market Attractiveness Analysis by Digital and Duty Tier
- Figure 18: Global Market Value (USD Million) Share and BPS Analysis by Region, 2026 and 2036
- Figure 19: Global Market Y-o-Y Growth Comparison by Region, 2026-2036
- Figure 20: Global Market Attractiveness Analysis by Region
- Figure 21: North America Market Incremental Dollar Opportunity, 2026-2036
- Figure 22: Latin America Market Incremental Dollar Opportunity, 2026-2036
- Figure 23: Western Europe Market Incremental Dollar Opportunity, 2026-2036
- Figure 24: Eastern Europe Market Incremental Dollar Opportunity, 2026-2036
- Figure 25: East Asia Market Incremental Dollar Opportunity, 2026-2036
- Figure 26: South Asia and Pacific Market Incremental Dollar Opportunity, 2026-2036
- Figure 27: Middle East and Africa Market Incremental Dollar Opportunity, 2026-2036
- Figure 28: North America Market Value Share and BPS Analysis by Country, 2026 and 2036
- Figure 29: North America Market Value Share and BPS Analysis by Modular System, 2026 and 2036
- Figure 30: North America Market Y-o-Y Growth Comparison by Modular System, 2026-2036
- Figure 31: North America Market Attractiveness Analysis by Modular System
- Figure 32: North America Market Value Share and BPS Analysis by Pressure Rating, 2026 and 2036
- Figure 33: North America Market Y-o-Y Growth Comparison by Pressure Rating, 2026-2036
- Figure 34: North America Market Attractiveness Analysis by Pressure Rating
- Figure 35: North America Market Value Share and BPS Analysis by Vessel Classification, 2026 and 2036
- Figure 36: North America Market Y-o-Y Growth Comparison by Vessel Classification, 2026-2036
- Figure 37: North America Market Attractiveness Analysis by Vessel Classification
- Figure 38: North America Market Value Share and BPS Analysis by End Use, 2026 and 2036
- Figure 39: North America Market Y-o-Y Growth Comparison by End Use, 2026-2036
- Figure 40: North America Market Attractiveness Analysis by End Use
- Figure 41: North America Market Value Share and BPS Analysis by Digital and Duty Tier, 2026 and 2036
- Figure 42: North America Market Y-o-Y Growth Comparison by Digital and Duty Tier, 2026-2036
- Figure 43: North America Market Attractiveness Analysis by Digital and Duty Tier
- Figure 44: Latin America Market Value Share and BPS Analysis by Country, 2026 and 2036
- Figure 45: Latin America Market Value Share and BPS Analysis by Modular System, 2026 and 2036
- Figure 46: Latin America Market Y-o-Y Growth Comparison by Modular System, 2026-2036
- Figure 47: Latin America Market Attractiveness Analysis by Modular System
- Figure 48: Latin America Market Value Share and BPS Analysis by Pressure Rating, 2026 and 2036
- Figure 49: Latin America Market Y-o-Y Growth Comparison by Pressure Rating, 2026-2036
- Figure 50: Latin America Market Attractiveness Analysis by Pressure Rating
- Figure 51: Latin America Market Value Share and BPS Analysis by Vessel Classification, 2026 and 2036
- Figure 52: Latin America Market Y-o-Y Growth Comparison by Vessel Classification, 2026-2036
- Figure 53: Latin America Market Attractiveness Analysis by Vessel Classification
- Figure 54: Latin America Market Value Share and BPS Analysis by End Use, 2026 and 2036
- Figure 55: Latin America Market Y-o-Y Growth Comparison by End Use, 2026-2036
- Figure 56: Latin America Market Attractiveness Analysis by End Use
- Figure 57: Latin America Market Value Share and BPS Analysis by Digital and Duty Tier, 2026 and 2036
- Figure 58: Latin America Market Y-o-Y Growth Comparison by Digital and Duty Tier, 2026-2036
- Figure 59: Latin America Market Attractiveness Analysis by Digital and Duty Tier
- Figure 60: Western Europe Market Value Share and BPS Analysis by Country, 2026 and 2036
- Figure 61: Western Europe Market Value Share and BPS Analysis by Modular System, 2026 and 2036
- Figure 62: Western Europe Market Y-o-Y Growth Comparison by Modular System, 2026-2036
- Figure 63: Western Europe Market Attractiveness Analysis by Modular System
- Figure 64: Western Europe Market Value Share and BPS Analysis by Pressure Rating, 2026 and 2036
- Figure 65: Western Europe Market Y-o-Y Growth Comparison by Pressure Rating, 2026-2036
- Figure 66: Western Europe Market Attractiveness Analysis by Pressure Rating
- Figure 67: Western Europe Market Value Share and BPS Analysis by Vessel Classification, 2026 and 2036
- Figure 68: Western Europe Market Y-o-Y Growth Comparison by Vessel Classification, 2026-2036
- Figure 69: Western Europe Market Attractiveness Analysis by Vessel Classification
- Figure 70: Western Europe Market Value Share and BPS Analysis by End Use, 2026 and 2036
- Figure 71: Western Europe Market Y-o-Y Growth Comparison by End Use, 2026-2036
- Figure 72: Western Europe Market Attractiveness Analysis by End Use
- Figure 73: Western Europe Market Value Share and BPS Analysis by Digital and Duty Tier, 2026 and 2036
- Figure 74: Western Europe Market Y-o-Y Growth Comparison by Digital and Duty Tier, 2026-2036
- Figure 75: Western Europe Market Attractiveness Analysis by Digital and Duty Tier
- Figure 76: Eastern Europe Market Value Share and BPS Analysis by Country, 2026 and 2036
- Figure 77: Eastern Europe Market Value Share and BPS Analysis by Modular System, 2026 and 2036
- Figure 78: Eastern Europe Market Y-o-Y Growth Comparison by Modular System, 2026-2036
- Figure 79: Eastern Europe Market Attractiveness Analysis by Modular System
- Figure 80: Eastern Europe Market Value Share and BPS Analysis by Pressure Rating, 2026 and 2036
- Figure 81: Eastern Europe Market Y-o-Y Growth Comparison by Pressure Rating, 2026-2036
- Figure 82: Eastern Europe Market Attractiveness Analysis by Pressure Rating
- Figure 83: Eastern Europe Market Value Share and BPS Analysis by Vessel Classification, 2026 and 2036
- Figure 84: Eastern Europe Market Y-o-Y Growth Comparison by Vessel Classification, 2026-2036
- Figure 85: Eastern Europe Market Attractiveness Analysis by Vessel Classification
- Figure 86: Eastern Europe Market Value Share and BPS Analysis by End Use, 2026 and 2036
- Figure 87: Eastern Europe Market Y-o-Y Growth Comparison by End Use, 2026-2036
- Figure 88: Eastern Europe Market Attractiveness Analysis by End Use
- Figure 89: Eastern Europe Market Value Share and BPS Analysis by Digital and Duty Tier, 2026 and 2036
- Figure 90: Eastern Europe Market Y-o-Y Growth Comparison by Digital and Duty Tier, 2026-2036
- Figure 91: Eastern Europe Market Attractiveness Analysis by Digital and Duty Tier
- Figure 92: East Asia Market Value Share and BPS Analysis by Country, 2026 and 2036
- Figure 93: East Asia Market Value Share and BPS Analysis by Modular System, 2026 and 2036
- Figure 94: East Asia Market Y-o-Y Growth Comparison by Modular System, 2026-2036
- Figure 95: East Asia Market Attractiveness Analysis by Modular System
- Figure 96: East Asia Market Value Share and BPS Analysis by Pressure Rating, 2026 and 2036
- Figure 97: East Asia Market Y-o-Y Growth Comparison by Pressure Rating, 2026-2036
- Figure 98: East Asia Market Attractiveness Analysis by Pressure Rating
- Figure 99: East Asia Market Value Share and BPS Analysis by Vessel Classification, 2026 and 2036
- Figure 100: East Asia Market Y-o-Y Growth Comparison by Vessel Classification, 2026-2036
- Figure 101: East Asia Market Attractiveness Analysis by Vessel Classification
- Figure 102: East Asia Market Value Share and BPS Analysis by End Use, 2026 and 2036
- Figure 103: East Asia Market Y-o-Y Growth Comparison by End Use, 2026-2036
- Figure 104: East Asia Market Attractiveness Analysis by End Use
- Figure 105: East Asia Market Value Share and BPS Analysis by Digital and Duty Tier, 2026 and 2036
- Figure 106: East Asia Market Y-o-Y Growth Comparison by Digital and Duty Tier, 2026-2036
- Figure 107: East Asia Market Attractiveness Analysis by Digital and Duty Tier
- Figure 108: South Asia and Pacific Market Value Share and BPS Analysis by Country, 2026 and 2036
- Figure 109: South Asia and Pacific Market Value Share and BPS Analysis by Modular System, 2026 and 2036
- Figure 110: South Asia and Pacific Market Y-o-Y Growth Comparison by Modular System, 2026-2036
- Figure 111: South Asia and Pacific Market Attractiveness Analysis by Modular System
- Figure 112: South Asia and Pacific Market Value Share and BPS Analysis by Pressure Rating, 2026 and 2036
- Figure 113: South Asia and Pacific Market Y-o-Y Growth Comparison by Pressure Rating, 2026-2036
- Figure 114: South Asia and Pacific Market Attractiveness Analysis by Pressure Rating
- Figure 115: South Asia and Pacific Market Value Share and BPS Analysis by Vessel Classification, 2026 and 2036
- Figure 116: South Asia and Pacific Market Y-o-Y Growth Comparison by Vessel Classification, 2026-2036
- Figure 117: South Asia and Pacific Market Attractiveness Analysis by Vessel Classification
- Figure 118: South Asia and Pacific Market Value Share and BPS Analysis by End Use, 2026 and 2036
- Figure 119: South Asia and Pacific Market Y-o-Y Growth Comparison by End Use, 2026-2036
- Figure 120: South Asia and Pacific Market Attractiveness Analysis by End Use
- Figure 121: South Asia and Pacific Market Value Share and BPS Analysis by Digital and Duty Tier, 2026 and 2036
- Figure 122: South Asia and Pacific Market Y-o-Y Growth Comparison by Digital and Duty Tier, 2026-2036
- Figure 123: South Asia and Pacific Market Attractiveness Analysis by Digital and Duty Tier
- Figure 124: Middle East and Africa Market Value Share and BPS Analysis by Country, 2026 and 2036
- Figure 125: Middle East and Africa Market Value Share and BPS Analysis by Modular System, 2026 and 2036
- Figure 126: Middle East and Africa Market Y-o-Y Growth Comparison by Modular System, 2026-2036
- Figure 127: Middle East and Africa Market Attractiveness Analysis by Modular System
- Figure 128: Middle East and Africa Market Value Share and BPS Analysis by Pressure Rating, 2026 and 2036
- Figure 129: Middle East and Africa Market Y-o-Y Growth Comparison by Pressure Rating, 2026-2036
- Figure 130: Middle East and Africa Market Attractiveness Analysis by Pressure Rating
- Figure 131: Middle East and Africa Market Value Share and BPS Analysis by Vessel Classification, 2026 and 2036
- Figure 132: Middle East and Africa Market Y-o-Y Growth Comparison by Vessel Classification, 2026-2036
- Figure 133: Middle East and Africa Market Attractiveness Analysis by Vessel Classification
- Figure 134: Middle East and Africa Market Value Share and BPS Analysis by End Use, 2026 and 2036
- Figure 135: Middle East and Africa Market Y-o-Y Growth Comparison by End Use, 2026-2036
- Figure 136: Middle East and Africa Market Attractiveness Analysis by End Use
- Figure 137: Middle East and Africa Market Value Share and BPS Analysis by Digital and Duty Tier, 2026 and 2036
- Figure 138: Middle East and Africa Market Y-o-Y Growth Comparison by Digital and Duty Tier, 2026-2036
- Figure 139: Middle East and Africa Market Attractiveness Analysis by Digital and Duty Tier
- Figure 140: Global Market - Tier Structure Analysis
- Figure 141: Global Market - Company Share Analysis
Frequently Asked Questions
How big is the hydrogen storage tank and transportation market in 2026, and what is forecast for 2036?
For 2026, FMI analysts value the global hydrogen storage tank and transportation market at USD 892.2 million compared with USD 600.0 million during 2025, reaching USD 47,159.8 million in 2036.
What is the CAGR for the hydrogen storage tank and transportation market from 2026 to 2036?
Future Market Insights forecasts a 48.7% annual growth rate from 2026 through 2036, creating USD 46,267.6 million in incremental sector valuation across mobility and industrial corridors.
Which modular system segment leads the hydrogen storage tank and transportation market?
Modular fuel storage systems will account for 59.4% of modular system demand in 2026 as pre-manifolded cylinder skids simplify vehicle and station integration.
Which pressure rating segment leads the hydrogen storage tank and transportation market?
Vessels rated at 200 to 500 bar will represent 46.8% of pressure rating demand in 2026 as operators balance payload mass with compression energy.
Which country has a notable growth outlook during the assessment period?
South Korea paces country-level expansion at 50.2% annually until 2036, aided by municipal fuel-cell bus fleets and 450-bar filling centers.
Who are the key players in the market?
Hexagon Purus ASA, Worthington Enterprises Inc., Chart Industries Inc., Air Liquide S.A., Linde plc, Luxfer Holdings PLC, NPROXX B.V., and Quantum Fuel Systems LLC supply global hydrogen containment fleets.
Preview the report firsthand - request a free sample
Get SampleGet the brochure for pricing and purchase details.
Get PDF
