

- Market Size (2026)
- USD 407.7 Mn
- Forecast (2036)
- USD 703.1 Mn
- CAGR (2026 to 2036)
- 5.6%
Calcium Caseinate Market Size, Market Forecast and Outlook By FMI
Summary of the Calcium Caseinate Market
- Demand and Growth Drivers
- Sports nutrition and clinical nutrition category expansion is likely to support strong demand as premium protein formulations continue requiring slow-release protein ingredients for muscle recovery, satiety, and sustained amino acid delivery.
- Infant nutrition and functional beverage reformulation is likely to remain a key growth driver as manufacturers increasingly use calcium caseinate for protein fortification, emulsification, and texture improvement across dairy and nutrition products.
- Dairy protein converter capacity scaling is expected to support adoption as processing hubs across Europe, Oceania, and India continue improving supply efficiency and supporting stable procurement during the forecast period.
- Product and Segment View
- Sports Nutrition is likely to remain the leading end use application segment, supported by strong demand for protein powders, recovery beverages, and premium nutritional supplements across fitness-focused consumers.
- Emulsification is likely to lead the functional property segment, driven by strong usage in dairy beverages, nutritional formulations, and processed food products requiring texture stability and consistent product performance.
- Bakery is likely to remain an important high-value product application area as manufacturers continue using calcium caseinate for texture improvement, protein enrichment, and shelf-life enhancement across premium bakery formulations.
- Geography and Competitive Outlook
- China is likely to remain a key market owing to rapid sports nutrition growth, increasing dairy protein demand, and expanding functional food consumption among urban consumers.
- India is likely to sustain strong demand due to rising clinical nutrition awareness, growing dairy processing capacity, and increasing premium nutrition product adoption across retail channels.
- Companies that can combine large-scale dairy protein processing, strong nutrition brand partnerships, and stable ingredient supply capabilities are likely to gain traction during the forecast period.
- Analyst Opinion
- Nandini Roy Choudhury, Principal Consultant at FMI says, “Companies that can improve protein functionality while maintaining cost efficiency and supply reliability are likely to strengthen their position over the forecast period.”
- The calcium caseinate market is evolving from a traditional dairy protein ingredient category into a broader functional nutrition and premium protein solutions segment.
- Adoption is being driven by strong demand for clinical nutrition, sports recovery products, and fortified food applications requiring stable and high-quality milk protein ingredients.
- The market is also benefiting from expanding dairy protein processing capacity and increasing consumer preference for premium nutrition-focused food formulations.
- Demand is further supported by the need for scalable ingredient solutions that balance functionality, affordability, nutritional performance, and long-term application versatility outcomes.
Key Takeaways, Market Size, and Forecast
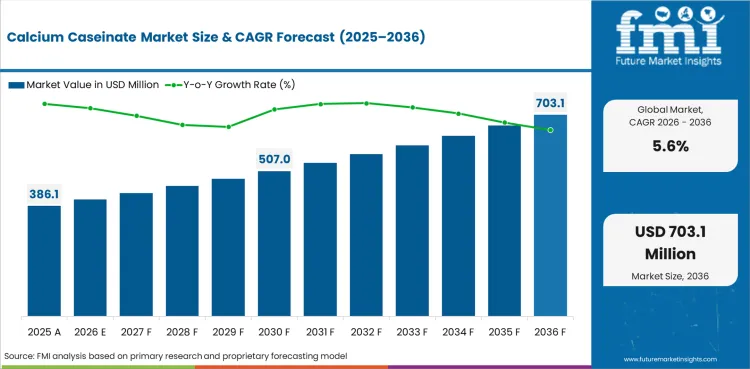
- The calcium caseinate market was valued at USD 386.1 million in 2025.
- The market is set to reach USD 407.7 million by the end of 2026.
- The market is projected to grow at a CAGR of 5.6% between 2026 and 2036, reaching USD 703.1 million by 2036.
- By 2036, the calcium caseinate market is expected to be worth USD 703.1 million.
- From 2026 to 2036, the market is projected to expand at a CAGR of 5.6%.
- The market is projected to create an incremental opportunity of USD 295.36 million between 2026 and 2036.
- In 2026, sports nutrition is expected to account for 31.7% of the end-use application segment, driven by strong demand for premium slow-release protein formulations.
- China (18.37%) and India (17.01%) are two of the fastest growing markets in the world.
Calcium Caseinate Market Definition
The calcium caseinate market encompasses commercially produced calcium caseinate dairy proteins manufactured by treating acid casein with calcium hydroxide, supplied to sports nutrition, clinical nutrition, functional beverages, nutritional powders and bars, dairy beverage, and infant nutrition applications as a slow-release, highly bioavailable milk protein ingredient.
Calcium Caseinate Market Inclusions
Market scope includes all commercially traded calcium caseinate products segmented by end-use application (sports nutrition, clinical nutrition, nutritional and functional beverages, nutritional powders and bars, dairy beverages, infant nutrition), functional property (emulsification, texture improvement, nutritional fortification, heat stability, thickening, stabilizer), product application area (bakery, meat products, frozen desserts, confectionery, cheese, coffee), form (powder, liquid, blended formulations, instant mixes, encapsulated, granules), and distribution channel (B2B direct sales, ingredient distributors, online B2B platforms, specialty nutrition suppliers, export channels, retail nutrition stores). Revenue sizing spans the 2026 to 2036 forecast period.
Calcium Caseinate Market Exclusions
The scope excludes sodium caseinate and potassium caseinate products that do not use calcium as the chelating cation, micellar casein and casein hydrolysate products that are not classified as caseinate, and whey protein concentrate and isolate products that compete with caseinate in nutrition applications.
Calcium Caseinate Market Research Methodology
- Primary Research: FMI analysts conducted interviews with dairy protein converter operations leaders, sports nutrition brand procurement managers, clinical nutrition formulators, and infant nutrition buyers across Europe, Oceania, North America, and Asia-Pacific.
- Desk Research: Data collection aggregated dairy protein trade statistics, sports nutrition association publications, company annual reports, and regulatory filings for nutritional and clinical applications to establish verifiable baseline parameters.
- Market Sizing and Forecasting: Baseline values derive from a bottom-up aggregation of calcium caseinate transaction volumes, applying region-specific sports and clinical nutrition category growth rates to project demand through 2036.
- Data validation and update cycle: Projections are tested against dairy protein shipment disclosures, sports nutrition retailer scan data, and clinical nutrition formulation registrations on a quarterly refresh schedule.
Why is the Calcium Caseinate Market Growing?
- Sports nutrition and clinical nutrition category expansion pulls calcium caseinate into premium slow-release protein formulations.
- Infant nutrition and functional beverage reformulation drives sustained procurement of calcium caseinate for fortification and emulsification.
- Dairy protein converter capacity scaling across European, Oceanian, and Indian hubs reshapes global supply economics.
The calcium caseinate market is expanding steadily, shaped by sports and clinical nutrition category growth, infant nutrition and functional beverage reformulation, and dairy protein converter capacity expansion across key producing geographies. Calcium caseinate delivers slow-release amino acid profile, high bioavailability, and functional emulsification and texture properties that align with premium nutrition and food formulation requirements.
Sports nutrition and clinical nutrition channels are adding specification depth that favours scaled converters. Premium protein powder formulations, ready-to-drink nutrition shakes, and clinical enteral nutrition products require consistent amino acid profile, low allergen risk, and documented origin traceability. These specifications drive customer consolidation toward Fonterra, FrieslandCampina, Armor Protéines, and Erie Foods International.
Dairy protein converter capacity expansion represents both a supply catalyst and a margin positioning dynamic. New Zealand and European converters dominate premium-grade supply through integrated dairy processing, while Indian and Polish converters scale cost-advantaged capacity serving domestic and export customers across sports nutrition and food ingredient applications.
Segmental Analysis
- Sports nutrition leads the end-use segment at 31.7 percent share in 2026, supported by premium protein category expansion and slow-release formulation adoption across powder, ready-to-drink, and bar formats.
- Emulsification at 29.2 percent of functional property, bakery at 22.4 percent of application area, and powder form at 58.6 percent reflect the dominance of emulsification and texture-focused applications across scaled food and nutrition manufacturing.
- B2B direct sales at 47.3 percent reflect the ingredient-supplier procurement structure that anchors converter relationships with sports nutrition, clinical nutrition, and food ingredient customers.
The calcium caseinate market is segmented by end use application, functional property, product application area, form, and geographic regions. Segment shares in 2026 reflect the dominant use cases, format preferences, and channel structures that characterise the category across mature and emerging geographies.
Insights into the Sports Nutrition Segment
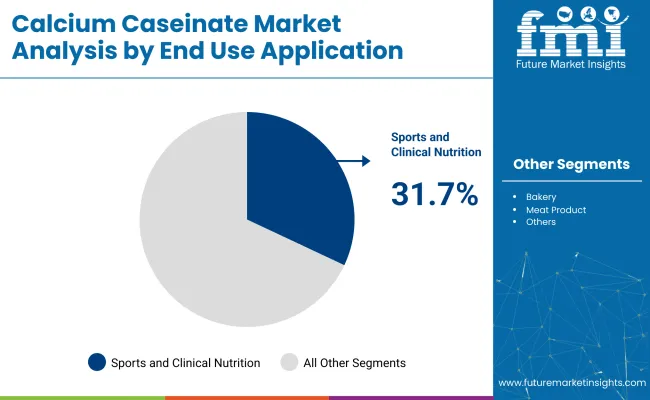
Sports Nutrition is projected to lead the end use application segment with a 31.7% share in 2026. This leadership reflects established manufacturing and supply infrastructure, competitive unit economics, and functional superiority in meeting core customer requirements across the dominant application channels.
Within this category, adjacent sub-segments are gaining share as customers respond to reformulation, regulatory, and consumer preference shifts. Converters and suppliers with format breadth and regional capacity are best positioned to capture this subsegment rotation.
Insights into the Emulsification Segment
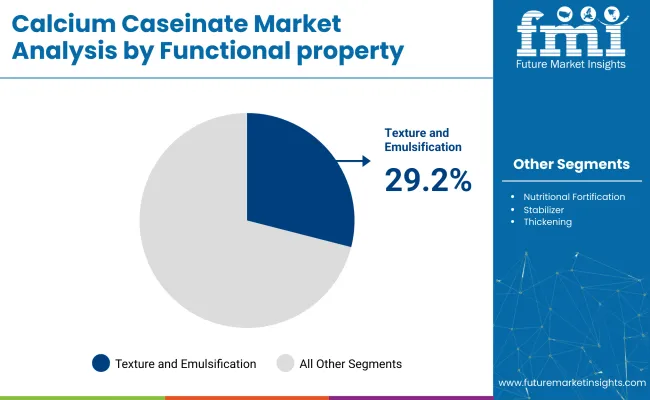
Emulsification is projected to lead the functional property segment with a 29.2% share in 2026. This leadership reflects established manufacturing and supply infrastructure, competitive unit economics, and functional superiority in meeting core customer requirements across the dominant application channels.
Insights into the Bakery Segment
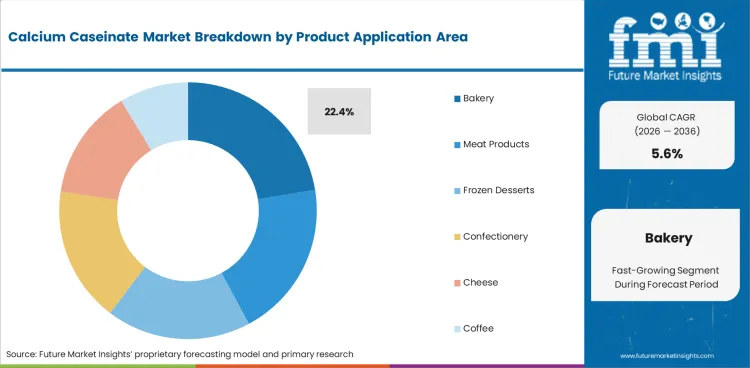
Bakery is projected to lead the product application area segment with a 22.4% share in 2026. This leadership reflects established manufacturing and supply infrastructure, competitive unit economics, and functional superiority in meeting core customer requirements across the dominant application channels.
Calcium Caseinate Market Drivers, Restraints, and Opportunities
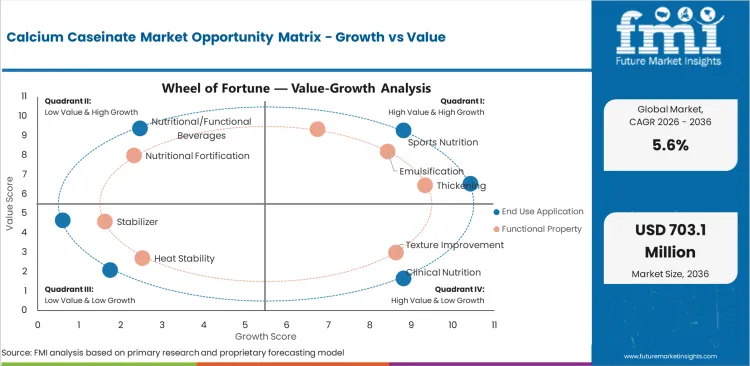
- Sports nutrition and clinical nutrition category expansion drives scaled calcium caseinate procurement.
- Infant nutrition and functional beverage reformulation sustains baseline demand across dairy and nutrition manufacturers.
- Converter capacity scaling across Europe, Oceania, and India reshapes global supply economics.
The calcium caseinate market is shaped by three concurrent dynamics: category expansion pulling baseline demand, regulatory and reformulation pressure reshaping specification, and advanced method or format innovation expanding premium pricing bands. Manufacturers and suppliers are responding by investing in reformulation, capacity expansion, and retailer or regulatory certification partnerships.
Sports and Clinical Nutrition Expansion
Demand is shaped by sports nutrition and clinical nutrition category expansion across North American, European, and Asia-Pacific retail and clinical channels. Calcium caseinate delivers slow-release amino acid profile that differentiates premium protein powder formulations, supports overnight recovery positioning, and anchors clinical enteral nutrition product ranges at premium pricing positioning.
Infant Nutrition and Functional Beverage Reformulation
Growth reflects infant nutrition and functional beverage reformulation where calcium caseinate delivers calcium fortification and emulsification properties suitable for premium infant formula and functional beverage positioning. Scaled dairy and nutrition manufacturers consolidate procurement toward converters with documented safety, allergen control, and batch traceability depth.
Dairy Protein Converter Capacity Expansion
Adoption is supported by converter capacity expansion across New Zealand, Ireland, the Netherlands, France, India, and Poland. Premium-grade supply from Fonterra, FrieslandCampina, and Armor Protéines anchors European and Oceanian positioning, while Indian and Polish converters scale cost-advantaged capacity serving domestic and export customers at mid-tier pricing.
Functional Food and Beverage Emulsification
Substantial opportunity exists in functional food and beverage emulsification applications where calcium caseinate delivers texture, heat stability, and nutritional fortification benefits. Bakery, meat products, frozen dessert, confectionery, and specialty coffee formulations are adopting calcium caseinate for premium positioning and functional ingredient differentiation.
Analysis of Calcium Caseinate Market By Key Countries
.webp "Top Country Growth Comparison Calcium Caseinate Market Cagr (2026 2036)")
| Country | CAGR |
|---|---|
| China | 18.37% |
| India | 17.01% |
| Germany | 15.65% |
| Brazil | 14.29% |
| United States | 12.93% |
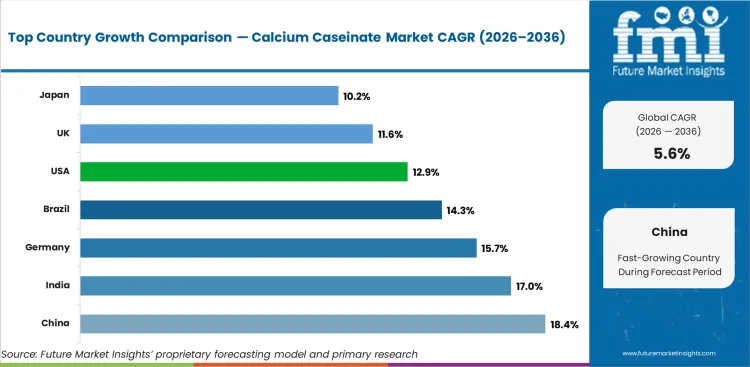
- Europe and Oceania dominate global converter capacity and premium-grade supply, while North America and Asia-Pacific lead sports nutrition, clinical nutrition, and functional beverage consumption demand.
- China leads at 18.37 percent CAGR, propelled by sports nutrition category expansion, functional beverage growth, and rising infant nutrition premium positioning.
- India follows at 17.01 percent with dairy protein converter capacity scaling, domestic sports nutrition category growth, and export-oriented supply development.
- Brazil and emerging Latin American markets sustain strong growth through sports nutrition category expansion and rising protein fortification in dairy beverage ranges.
The calcium caseinate market is projected to grow globally at a CAGR of 5.6% from 2026 to 2036. Among the top markets, China leads at 18.37%, followed by India at 17.01%, while Germany posts 15.65%, Brazil records 14.29%, and United States stands at 12.93%. The analysis spans over 30 countries, with the leading markets detailed below.
Demand Outlook for Calcium Caseinate Market in United States
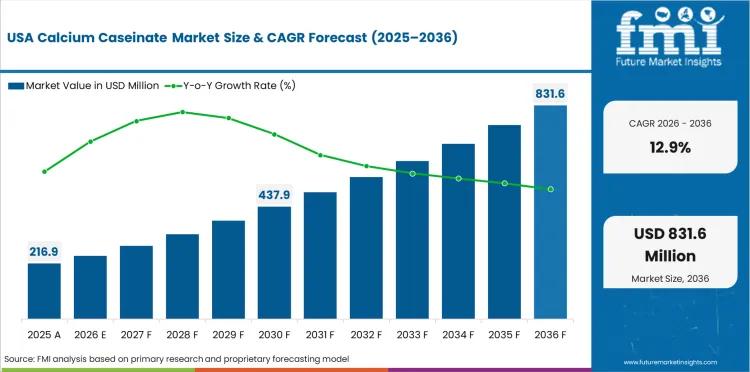
The United States is projected to grow at a 12.93 percent CAGR through 2036, shaped by sports nutrition category leadership, clinical nutrition product expansion, and premium protein powder category depth. Erie Foods International Inc. and AMCO Proteins anchor domestic dairy protein supply with scaled sports and clinical nutrition customer relationships.
- Sports nutrition category leadership drives premium slow-release protein procurement.
- Clinical nutrition product expansion supports documented-traceability converter relationships.
- Premium protein powder category depth sustains converter capacity positioning.
Future Outlook for Calcium Caseinate Market in United Kingdom
The United Kingdom is projected to grow at an 11.56 percent CAGR through 2036, with demand supported by premium sports nutrition retail, clinical enteral nutrition supply to NHS contracts, and rising functional beverage category activity. UK sports and clinical nutrition formulators favour European converter supply with documented origin and allergen profile.
- Premium sports nutrition retail sustains scaled ingredient procurement.
- Clinical enteral nutrition NHS contracts drive documented-origin converter relationships.
- Functional beverage category activity expands calcium caseinate positioning.
Opportunity Analysis for Calcium Caseinate Market in Germany
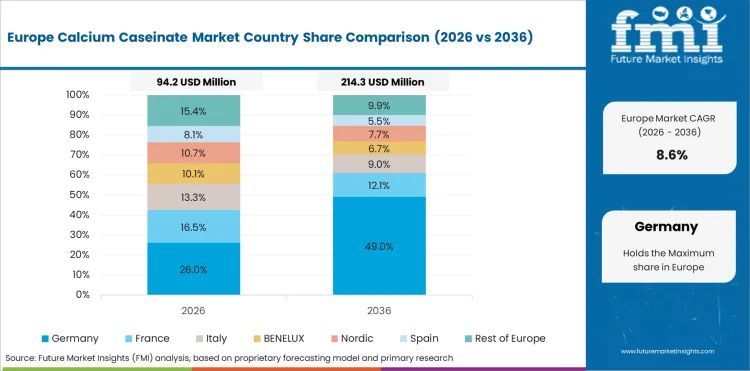
Germany demonstrates steady growth through 2036 as the country's scaled dairy processing industry, strong sports and clinical nutrition category infrastructure, and premium food manufacturing depth support consistent calcium caseinate demand. German dairy processors and nutrition ingredient distributors anchor European supply to scaled domestic and export customers.
- Scaled dairy processing industry anchors European converter capacity.
- Sports and clinical nutrition category infrastructure drives ingredient procurement.
- Premium food manufacturing depth sustains functional ingredient demand.
In-depth Analysis for Calcium Caseinate Market in Japan
Japan is projected to grow at a 10.20 percent CAGR through 2036, reflecting mature clinical nutrition category depth, rising sports nutrition consumer adoption, and premium functional beverage formulation activity. Nippon Shinyaku Co. Ltd. anchors domestic pharmaceutical and clinical nutrition supply with scaled converter capacity.
- Mature clinical nutrition category depth sustains premium-grade procurement.
- Rising sports nutrition consumer adoption expands retail category positioning.
- Premium functional beverage formulation drives ingredient specification demand.
Sales Analysis for Calcium Caseinate Market in China
China is expected to demonstrate strong growth through 2036, propelled by sports nutrition category expansion at Tmall and JD.com D2C platforms, functional beverage category growth, and rising infant nutrition premium positioning under strict regulatory frameworks. Chinese nutrition brands are consolidating procurement toward imported premium-grade converter supply.
- Sports nutrition D2C category expansion drives scaled ingredient procurement.
- Functional beverage category growth expands calcium caseinate positioning.
- Infant nutrition premium positioning sustains documented-origin supply demand.
In-depth Analysis for Calcium Caseinate Market in India
India demonstrates strong growth through 2036, supported by dairy protein converter capacity scaling at DryTech India, Krishna Enzytech, Avani Food Products, and Clarion Casein Ltd, domestic sports nutrition category growth, and export-oriented supply development. Indian converters serve both rising domestic demand and mid-tier pricing export opportunities.
- Domestic converter capacity scales to serve sports nutrition category growth.
- Export-oriented supply development expands mid-tier converter positioning.
- Rising domestic sports and clinical nutrition category drives procurement.
Competitive Landscape and Strategic Positioning
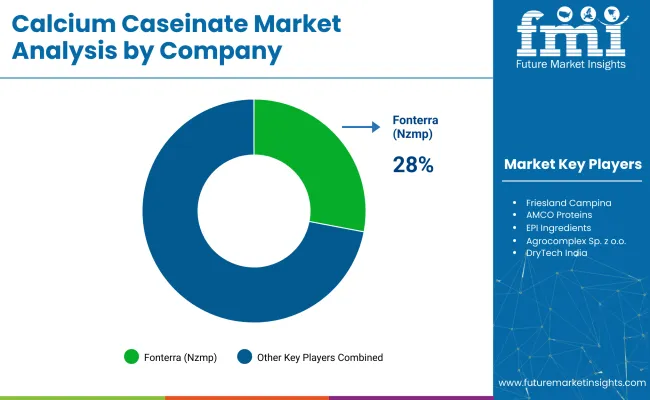
- The top converters collectively hold material share, with competitive differentiation shifting from unit cost to reformulation capability, certification depth, and customer-relationship tenure.
- Regional specialists are gaining share where local regulatory mandates and customer preference favour certified or specialised product and service offerings.
- Start-ups and SMEs are carving niche positions in climate, clean-label, and digital-channel categories targeting premium customer segments.
The calcium caseinate market is shaped by scaled dairy cooperative converters and specialist nutrition ingredient houses. Fonterra (NZMP) leads the global category with integrated New Zealand dairy sourcing, scaled converter capacity, and established sports, clinical, and infant nutrition customer relationships across multiple geographies.
FrieslandCampina and Armor Protéines anchor European converter capacity with integrated dairy processing, scaled calcium caseinate production, and deep relationships with premium sports nutrition, clinical nutrition, and food ingredient customers. AMCO Proteins and EPI Ingredients operate as specialist ingredient converters serving North American and European nutrition manufacturers.
Agrocomplex Sp. z o.o. anchors Polish and Central European converter capacity with cost-advantaged supply serving export customers. DryTech India, Krishna Enzytech, Avani Food Products, Milk Speciality Global, and Clarion Casein Ltd anchor Indian and emerging-market converter capacity. Erie Foods International Inc., Nippon Shinyaku Co. Ltd., Hoogwegt Group, and Cottee Group Pty Ltd. represent specialist and regional distributor segments.
Barriers to entry include integrated dairy supply access, acid casein processing capital requirements, food-grade and pharmaceutical-grade regulatory documentation across FDA, EFSA, and infant nutrition framework depth, and the multi-year customer qualification cycles typical of sports, clinical, and infant nutrition segments. Strategic priorities across leading converters include pharmaceutical-grade capacity investment, infant nutrition specification compliance, and emerging-market export channel expansion.
Key Companies in Calcium Caseinate Market
Key global companies leading the calcium caseinate market include:
- Fonterra NZMP (New Zealand), FrieslandCampina (Netherlands), Armor Protéines (France), and AMCO Proteins (USA) were identified as leading players in the calcium caseinate market, given their integrated dairy sourcing, scaled converter capacity, and established sports, clinical, and infant nutrition customer relationships across global markets.
- EPI Ingredients (France), Agrocomplex Sp. z o.o. (Poland), Erie Foods International Inc. (USA), Nippon Shinyaku Co. Ltd. (Japan), and Hoogwegt Group (Netherlands) operate as scaled specialist converters and distributors with strong regional customer bases across European, North American, and Asia-Pacific markets.
- DryTech India (India), Krishna Enzytech (India), Avani Food Products (India), Milk Speciality Global (UK), Cottee Group Pty Ltd. (Australia), and Clarion Casein Ltd (India) have established positions in emerging-market and regional converter supply serving domestic sports nutrition, food ingredient, and export customers.
Competitive Benchmarking: Calcium Caseinate Market
| Company | Product Breadth | Pharmaceutical-Grade Capability | Customer Access | Geographic Footprint |
|---|---|---|---|---|
| Fonterra (NZMP) | High | High | Strong | Global |
| FrieslandCampina | High | High | Strong | Global |
| Armor Protéines | High | High | Strong | Europe, Global |
| AMCO Proteins | Medium | Medium | Strong | North America |
| EPI Ingredients | Medium | Medium | Moderate | Europe |
| Erie Foods International Inc. | Medium | Medium | Moderate | North America |
| Nippon Shinyaku Co., Ltd. | Medium | High | Moderate | Asia-Pacific |
| Hoogwegt Group | Medium | Medium | Strong | Europe, Global |
| Agrocomplex Sp. z o.o. | Medium | Medium | Moderate | Europe |
| Clarion Casein Ltd | Low | Medium | Moderate | India, Asia-Pacific |
Source: Future Market Insights competitive analysis, 2026.
Key Developments in Calcium Caseinate Market
- In 2025, Fonterra expanded its calcium caseinate production capacity at New Zealand converter facilities to serve rising global sports nutrition and clinical nutrition customer demand for premium slow-release protein ingredients.
- In 2025, FrieslandCampina extended its calcium caseinate ingredient portfolio with new specification tiers targeted at infant nutrition customers under tightening EU regulatory requirements for milk protein traceability and allergen control.
Key Players in the Calcium Caseinate Market:
Major Global Players:
- Armor Protéines
- Fonterra (NZMP)
- FrieslandCampina
- AMCO Proteins
- EPI Ingredients
- Agrocomplex Sp. z o.o.
- DryTech India
Emerging Players/Startups
- Krishna Enzytech
- Avani Food Products
- Milk Speciality Global
- Erie Foods International Inc.
- Nippon Shinyaku Co., Ltd.
- Hoogwegt Group
- Cottee Group Pty Ltd.
- Clarion Casein Ltd
Report Scope and Coverage
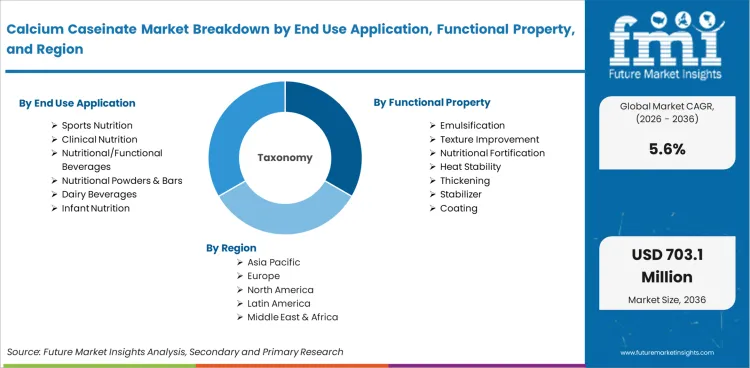
| Metric | Value |
|---|---|
| Quantitative Units | USD 407.7 million to USD 703.1 million, at a CAGR of 5.6% |
| Market Definition | The calcium caseinate market encompasses commercially produced calcium caseinate dairy proteins manufactured by treating acid casein with calcium hydroxide, supplied to sports nutrition, clinical nutrition, functional beverages, nutritional powders and bars, dairy beverage, and infant nutrition applications as a slow-release, highly bioavailable milk protein ingredient. |
| Regions Covered | North America, Latin America, Europe, East Asia, South Asia and Pacific, Middle East and Africa |
| Countries Covered | India, China, USA, UK, Germany, Japan, South Korea, Brazil, 30 plus countries |
| Key Companies Profiled | Armor Protéines, Fonterra (NZMP), FrieslandCampina, AMCO Proteins, EPI Ingredients, Agrocomplex Sp. z o.o., DryTech India, Krishna Enzytech, Avani Food Products, Milk Speciality Global, Erie Foods International Inc., Nippon Shinyaku Co., Ltd., Hoogwegt Group, Cottee Group Pty Ltd., Clarion Casein Ltd |
| Forecast Period | 2026 to 2036 |
| Approach | Hybrid bottom-up and top-down methodology starting with verified calcium caseinate market transaction data, projecting adoption velocity across segments and regions. |
Market Segmentation Analysis
Calcium Caseinate Market Market Segmented by End Use Application:
- Sports Nutrition
- Clinical Nutrition
- Nutritional/Functional Beverages
- Nutritional Powders & Bars
- Dairy Beverages
- Infant Nutrition
Calcium Caseinate Market Market Segmented by Functional Property:
- Emulsification
- Texture Improvement
- Nutritional Fortification
- Heat Stability
- Thickening
- Stabilizer
- Coating
Calcium Caseinate Market Market Segmented by Product Application Area:
- Bakery
- Meat Products
- Frozen Desserts
- Confectionery
- Cheese
- Coffee
Calcium Caseinate Market Market Segmented by Form:
- Powder Form
- Liquid Form
- Blended Formulations
- Instant Mixes
- Encapsulated Form
- Granules
Calcium Caseinate Market Market Segmented by Distribution Channel:
- B2B Direct Sales
- Ingredient Distributors
- Online B2B Platforms
- Specialty Nutrition Suppliers
- Export Channels
- Retail Nutrition Stores
Calcium Caseinate Market Market by Region:
- North America
- USA
- Canada
- Mexico
- Latin America
- Brazil
- Chile
- Rest of Latin America
- Western Europe
- Germany
- UK
- Italy
- Spain
- France
- Nordic
- BENELUX
- Rest of Western Europe
- Eastern Europe
- Russia
- Poland
- Hungary
- Balkan & Baltic
- Rest of Eastern Europe
- East Asia
- China
- Japan
- South Korea
- South Asia and Pacific
- India
- ASEAN
- Australia & New Zealand
- Rest of South Asia and Pacific
- Middle East & Africa
- Kingdom of Saudi Arabia
- Other GCC Countries
- Turkiye
- South Africa
- Other African Union
- Rest of Middle East & Africa
Research Sources and Bibliography
- 1. Food and Agriculture Organization of the United Nations. (2025). FAOSTAT Dairy Production Statistics. FAO.
- 2. International Dairy Federation. (2024). Bulletin of the IDF on Dairy Protein Ingredients. IDF.
- 3. European Food Safety Authority. (2024). Scientific Opinion on Infant Nutrition Protein Sources. EFSA.
- 4. U.S. Food and Drug Administration. (2024). Dairy Protein Ingredient Regulation Guidance. FDA.
- 5. Codex Alimentarius Commission. (2024). General Standard for Dairy Protein Products. FAO/WHO.
This bibliography is provided for reader reference.
This Report Answers
- Market sizing and revenue forecasting for calcium caseinate market from 2026 to 2036.
- Segmentation analysis across the primary axes and regional geographies.
- Regional and country-level insights covering over 30 markets with comparative growth analysis.
- Regulatory and compliance analysis covering key multilateral, national, and industry frameworks.
- Competitive landscape assessment covering market structure, vendor positioning, and recent developments.
- Investment opportunity mapping across growth verticals and geographic regions.
- Supply chain tracking from input sourcing to finished product distribution.
- Data delivery in PDF and Excel formats with quarterly refresh access.
Frequently Asked Questions
How large is the demand for Calcium Caseinate Market in the global market in 2026?
Demand for calcium caseinate market in the global market is estimated to be valued at USD 407.7 million in 2026.
What will be the market size of Calcium Caseinate Market by 2036?
Market size for calcium caseinate market is projected to reach USD 703.1 million by 2036.
What is the expected demand growth for Calcium Caseinate Market between 2026 and 2036?
Demand for calcium caseinate market is expected to grow at a CAGR of 5.6% between 2026 and 2036.
Which End Use Application is poised to lead global sales by 2026?
Sports Nutrition accounts for 31.7% in 2026, reflecting established manufacturing infrastructure and functional performance advantages.
How is the Powder Form segment driving Calcium Caseinate Market adoption?
Powder Form represents 58.6% of the form demand as leading operators drive procurement volumes.
What is driving demand in the United States?
The United States registers a 12.93% CAGR through 2036, propelled by sustained category consumption, regulatory shifts, and customer reformulation or outsourcing mandates.
What does Calcium Caseinate Market definition mean in this report?
The calcium caseinate market encompasses commercially produced calcium caseinate dairy proteins manufactured by treating acid casein with calcium hydroxide, supplied to sports nutrition, clinical nutrition, functional beverages, nutritional powders and bars, dairy beverage, and infant nutrition applications as a slow-release, highly bioavailable milk protein ingredient.
How does FMI build and validate the Calcium Caseinate Market forecast?
Forecasting models apply a hybrid bottom-up methodology starting with verified transaction data, cross-validated against industry sales statistics and manufacturer financial disclosures.
Preview the report firsthand - request a free sample
Get SampleGet the brochure for pricing and purchase details.
Get PDFTable of Content
- Executive Summary
- Global Market Outlook
- Demand-side Trends
- Supply-side Trends
- Technology Roadmap Analysis
- Analysis and Recommendations
- Market Overview
- Market Coverage / Taxonomy
- Market Definition / Scope / Limitations
- Research Methodology
- Chapter Orientation
- Analytical Lens and Working Hypotheses
- Market Structure, Signals, and Trend Drivers
- Benchmarking and Cross-market Comparability
- Market Sizing, Forecasting, and Opportunity Mapping
- Research Design and Evidence Framework
- Desk Research Programme (Secondary Evidence)
- Company Annual and Sustainability Reports
- Peer-reviewed Journals and Academic Literature
- Corporate Websites, Product Literature, and Technical Notes
- Earnings Decks and Investor Briefings
- Statutory Filings and Regulatory Disclosures
- Technical White Papers and Standards Notes
- Trade Journals, Industry Magazines, and Analyst Briefs
- Conference Proceedings, Webinars, and Seminar Materials
- Government Statistics Portals and Public Data Releases
- Press Releases and Reputable Media Coverage
- Specialist Newsletters and Curated Briefings
- Sector Databases and Reference Repositories
- FMI Internal Proprietary Databases and Historical Market Datasets
- Subscription Datasets and Paid Sources
- Social Channels, Communities, and Digital Listening Inputs
- Additional Desk Sources
- Expert Input and Fieldwork (Primary Evidence)
- Primary Modes
- Qualitative Interviews and Expert Elicitation
- Quantitative Surveys and Structured Data Capture
- Blended Approach
- Why Primary Evidence is Used
- Field Techniques
- Interviews
- Surveys
- Focus Groups
- Observational and In-context Research
- Social and Community Interactions
- Stakeholder Universe Engaged
- C-suite Leaders
- Board Members
- Presidents and Vice Presidents
- R&D and Innovation Heads
- Technical Specialists
- Domain Subject-matter Experts
- Scientists
- Physicians and Other Healthcare Professionals
- Governance, Ethics, and Data Stewardship
- Research Ethics
- Data Integrity and Handling
- Primary Modes
- Tooling, Models, and Reference Databases
- Desk Research Programme (Secondary Evidence)
- Data Engineering and Model Build
- Data Acquisition and Ingestion
- Cleaning, Normalisation, and Verification
- Synthesis, Triangulation, and Analysis
- Quality Assurance and Audit Trail
- Market Background
- Market Dynamics
- Drivers
- Restraints
- Opportunity
- Trends
- Scenario Forecast
- Demand in Optimistic Scenario
- Demand in Likely Scenario
- Demand in Conservative Scenario
- Opportunity Map Analysis
- Product Life Cycle Analysis
- Supply Chain Analysis
- Investment Feasibility Matrix
- Value Chain Analysis
- PESTLE and Porter’s Analysis
- Regulatory Landscape
- Regional Parent Market Outlook
- Production and Consumption Statistics
- Import and Export Statistics
- Market Dynamics
- Global Market Analysis 2021 to 2025 and Forecast, 2026 to 2036
- Historical Market Size Value (USD Million) Analysis, 2021 to 2025
- Current and Future Market Size Value (USD Million) Projections, 2026 to 2036
- Y-o-Y Growth Trend Analysis
- Absolute $ Opportunity Analysis
- Global Market Pricing Analysis 2021 to 2025 and Forecast 2026 to 2036
- Global Market Analysis 2021 to 2025 and Forecast 2026 to 2036, By End Use Application
- Introduction / Key Findings
- Historical Market Size Value (USD Million) Analysis By End Use Application , 2021 to 2025
- Current and Future Market Size Value (USD Million) Analysis and Forecast By End Use Application , 2026 to 2036
- Sports Nutrition
- Clinical Nutrition
- Nutritional/Functional Beverages
- Nutritional Powders & Bars
- Dairy Beverages
- Infant Nutrition
- Sports Nutrition
- Y-o-Y Growth Trend Analysis By End Use Application , 2021 to 2025
- Absolute $ Opportunity Analysis By End Use Application , 2026 to 2036
- Global Market Analysis 2021 to 2025 and Forecast 2026 to 2036, By Functional Property
- Introduction / Key Findings
- Historical Market Size Value (USD Million) Analysis By Functional Property, 2021 to 2025
- Current and Future Market Size Value (USD Million) Analysis and Forecast By Functional Property, 2026 to 2036
- Emulsification
- Texture Improvement
- Nutritional Fortification
- Heat Stability
- Thickening
- Stabilizer
- Coating
- Emulsification
- Y-o-Y Growth Trend Analysis By Functional Property, 2021 to 2025
- Absolute $ Opportunity Analysis By Functional Property, 2026 to 2036
- Global Market Analysis 2021 to 2025 and Forecast 2026 to 2036, By Product Application Area
- Introduction / Key Findings
- Historical Market Size Value (USD Million) Analysis By Product Application Area, 2021 to 2025
- Current and Future Market Size Value (USD Million) Analysis and Forecast By Product Application Area, 2026 to 2036
- Bakery
- Meat Products
- Frozen Desserts
- Confectionery
- Cheese
- Coffee
- Bakery
- Y-o-Y Growth Trend Analysis By Product Application Area, 2021 to 2025
- Absolute $ Opportunity Analysis By Product Application Area, 2026 to 2036
- Global Market Analysis 2021 to 2025 and Forecast 2026 to 2036, By Form
- Introduction / Key Findings
- Historical Market Size Value (USD Million) Analysis By Form, 2021 to 2025
- Current and Future Market Size Value (USD Million) Analysis and Forecast By Form, 2026 to 2036
- Powder Form
- Liquid Form
- Blended Formulations
- Instant Mixes
- Encapsulated Form
- Granules
- Powder Form
- Y-o-Y Growth Trend Analysis By Form, 2021 to 2025
- Absolute $ Opportunity Analysis By Form, 2026 to 2036
- Global Market Analysis 2021 to 2025 and Forecast 2026 to 2036, By Distribution Channel
- Introduction / Key Findings
- Historical Market Size Value (USD Million) Analysis By Distribution Channel, 2021 to 2025
- Current and Future Market Size Value (USD Million) Analysis and Forecast By Distribution Channel, 2026 to 2036
- B2B Direct Sales
- Ingredient Distributors
- Online B2B Platforms
- Specialty Nutrition Suppliers
- Export Channels
- Retail Nutrition Stores
- B2B Direct Sales
- Y-o-Y Growth Trend Analysis By Distribution Channel, 2021 to 2025
- Absolute $ Opportunity Analysis By Distribution Channel, 2026 to 2036
- Global Market Analysis 2021 to 2025 and Forecast 2026 to 2036, By Region
- Introduction
- Historical Market Size Value (USD Million) Analysis By Region, 2021 to 2025
- Current Market Size Value (USD Million) Analysis and Forecast By Region, 2026 to 2036
- North America
- Latin America
- Western Europe
- Eastern Europe
- East Asia
- South Asia and Pacific
- Middle East & Africa
- Market Attractiveness Analysis By Region
- North America Market Analysis 2021 to 2025 and Forecast 2026 to 2036, By Country
- Historical Market Size Value (USD Million) Trend Analysis By Market Taxonomy, 2021 to 2025
- Market Size Value (USD Million) Forecast By Market Taxonomy, 2026 to 2036
- By Country
- USA
- Canada
- Mexico
- By End Use Application
- By Functional Property
- By Product Application Area
- By Form
- By Distribution Channel
- By Country
- Market Attractiveness Analysis
- By Country
- By End Use Application
- By Functional Property
- By Product Application Area
- By Form
- By Distribution Channel
- Key Takeaways
- Latin America Market Analysis 2021 to 2025 and Forecast 2026 to 2036, By Country
- Historical Market Size Value (USD Million) Trend Analysis By Market Taxonomy, 2021 to 2025
- Market Size Value (USD Million) Forecast By Market Taxonomy, 2026 to 2036
- By Country
- Brazil
- Chile
- Rest of Latin America
- By End Use Application
- By Functional Property
- By Product Application Area
- By Form
- By Distribution Channel
- By Country
- Market Attractiveness Analysis
- By Country
- By End Use Application
- By Functional Property
- By Product Application Area
- By Form
- By Distribution Channel
- Key Takeaways
- Western Europe Market Analysis 2021 to 2025 and Forecast 2026 to 2036, By Country
- Historical Market Size Value (USD Million) Trend Analysis By Market Taxonomy, 2021 to 2025
- Market Size Value (USD Million) Forecast By Market Taxonomy, 2026 to 2036
- By Country
- Germany
- UK
- Italy
- Spain
- France
- Nordic
- BENELUX
- Rest of Western Europe
- By End Use Application
- By Functional Property
- By Product Application Area
- By Form
- By Distribution Channel
- By Country
- Market Attractiveness Analysis
- By Country
- By End Use Application
- By Functional Property
- By Product Application Area
- By Form
- By Distribution Channel
- Key Takeaways
- Eastern Europe Market Analysis 2021 to 2025 and Forecast 2026 to 2036, By Country
- Historical Market Size Value (USD Million) Trend Analysis By Market Taxonomy, 2021 to 2025
- Market Size Value (USD Million) Forecast By Market Taxonomy, 2026 to 2036
- By Country
- Russia
- Poland
- Hungary
- Balkan & Baltic
- Rest of Eastern Europe
- By End Use Application
- By Functional Property
- By Product Application Area
- By Form
- By Distribution Channel
- By Country
- Market Attractiveness Analysis
- By Country
- By End Use Application
- By Functional Property
- By Product Application Area
- By Form
- By Distribution Channel
- Key Takeaways
- East Asia Market Analysis 2021 to 2025 and Forecast 2026 to 2036, By Country
- Historical Market Size Value (USD Million) Trend Analysis By Market Taxonomy, 2021 to 2025
- Market Size Value (USD Million) Forecast By Market Taxonomy, 2026 to 2036
- By Country
- China
- Japan
- South Korea
- By End Use Application
- By Functional Property
- By Product Application Area
- By Form
- By Distribution Channel
- By Country
- Market Attractiveness Analysis
- By Country
- By End Use Application
- By Functional Property
- By Product Application Area
- By Form
- By Distribution Channel
- Key Takeaways
- South Asia and Pacific Market Analysis 2021 to 2025 and Forecast 2026 to 2036, By Country
- Historical Market Size Value (USD Million) Trend Analysis By Market Taxonomy, 2021 to 2025
- Market Size Value (USD Million) Forecast By Market Taxonomy, 2026 to 2036
- By Country
- India
- ASEAN
- Australia & New Zealand
- Rest of South Asia and Pacific
- By End Use Application
- By Functional Property
- By Product Application Area
- By Form
- By Distribution Channel
- By Country
- Market Attractiveness Analysis
- By Country
- By End Use Application
- By Functional Property
- By Product Application Area
- By Form
- By Distribution Channel
- Key Takeaways
- Middle East & Africa Market Analysis 2021 to 2025 and Forecast 2026 to 2036, By Country
- Historical Market Size Value (USD Million) Trend Analysis By Market Taxonomy, 2021 to 2025
- Market Size Value (USD Million) Forecast By Market Taxonomy, 2026 to 2036
- By Country
- Kingdom of Saudi Arabia
- Other GCC Countries
- Turkiye
- South Africa
- Other African Union
- Rest of Middle East & Africa
- By End Use Application
- By Functional Property
- By Product Application Area
- By Form
- By Distribution Channel
- By Country
- Market Attractiveness Analysis
- By Country
- By End Use Application
- By Functional Property
- By Product Application Area
- By Form
- By Distribution Channel
- Key Takeaways
- Key Countries Market Analysis
- USA
- Pricing Analysis
- Market Share Analysis, 2025
- By End Use Application
- By Functional Property
- By Product Application Area
- By Form
- By Distribution Channel
- Canada
- Pricing Analysis
- Market Share Analysis, 2025
- By End Use Application
- By Functional Property
- By Product Application Area
- By Form
- By Distribution Channel
- Mexico
- Pricing Analysis
- Market Share Analysis, 2025
- By End Use Application
- By Functional Property
- By Product Application Area
- By Form
- By Distribution Channel
- Brazil
- Pricing Analysis
- Market Share Analysis, 2025
- By End Use Application
- By Functional Property
- By Product Application Area
- By Form
- By Distribution Channel
- Chile
- Pricing Analysis
- Market Share Analysis, 2025
- By End Use Application
- By Functional Property
- By Product Application Area
- By Form
- By Distribution Channel
- Germany
- Pricing Analysis
- Market Share Analysis, 2025
- By End Use Application
- By Functional Property
- By Product Application Area
- By Form
- By Distribution Channel
- UK
- Pricing Analysis
- Market Share Analysis, 2025
- By End Use Application
- By Functional Property
- By Product Application Area
- By Form
- By Distribution Channel
- Italy
- Pricing Analysis
- Market Share Analysis, 2025
- By End Use Application
- By Functional Property
- By Product Application Area
- By Form
- By Distribution Channel
- Spain
- Pricing Analysis
- Market Share Analysis, 2025
- By End Use Application
- By Functional Property
- By Product Application Area
- By Form
- By Distribution Channel
- France
- Pricing Analysis
- Market Share Analysis, 2025
- By End Use Application
- By Functional Property
- By Product Application Area
- By Form
- By Distribution Channel
- India
- Pricing Analysis
- Market Share Analysis, 2025
- By End Use Application
- By Functional Property
- By Product Application Area
- By Form
- By Distribution Channel
- ASEAN
- Pricing Analysis
- Market Share Analysis, 2025
- By End Use Application
- By Functional Property
- By Product Application Area
- By Form
- By Distribution Channel
- Australia & New Zealand
- Pricing Analysis
- Market Share Analysis, 2025
- By End Use Application
- By Functional Property
- By Product Application Area
- By Form
- By Distribution Channel
- China
- Pricing Analysis
- Market Share Analysis, 2025
- By End Use Application
- By Functional Property
- By Product Application Area
- By Form
- By Distribution Channel
- Japan
- Pricing Analysis
- Market Share Analysis, 2025
- By End Use Application
- By Functional Property
- By Product Application Area
- By Form
- By Distribution Channel
- South Korea
- Pricing Analysis
- Market Share Analysis, 2025
- By End Use Application
- By Functional Property
- By Product Application Area
- By Form
- By Distribution Channel
- Russia
- Pricing Analysis
- Market Share Analysis, 2025
- By End Use Application
- By Functional Property
- By Product Application Area
- By Form
- By Distribution Channel
- Poland
- Pricing Analysis
- Market Share Analysis, 2025
- By End Use Application
- By Functional Property
- By Product Application Area
- By Form
- By Distribution Channel
- Hungary
- Pricing Analysis
- Market Share Analysis, 2025
- By End Use Application
- By Functional Property
- By Product Application Area
- By Form
- By Distribution Channel
- Kingdom of Saudi Arabia
- Pricing Analysis
- Market Share Analysis, 2025
- By End Use Application
- By Functional Property
- By Product Application Area
- By Form
- By Distribution Channel
- Turkiye
- Pricing Analysis
- Market Share Analysis, 2025
- By End Use Application
- By Functional Property
- By Product Application Area
- By Form
- By Distribution Channel
- South Africa
- Pricing Analysis
- Market Share Analysis, 2025
- By End Use Application
- By Functional Property
- By Product Application Area
- By Form
- By Distribution Channel
- USA
- Market Structure Analysis
- Competition Dashboard
- Competition Benchmarking
- Market Share Analysis of Top Players
- By Regional
- By End Use Application
- By Functional Property
- By Product Application Area
- By Form
- By Distribution Channel
- Competition Analysis
- Competition Deep Dive
- Armor Protéines
- Overview
- Product Portfolio
- Profitability by Market Segments (Product/Age /Sales Channel/Region)
- Sales Footprint
- Strategy Overview
- Marketing Strategy
- Product Strategy
- Channel Strategy
- Fonterra (NZMP)
- FrieslandCampina
- AMCO Proteins
- EPI Ingredients
- Agrocomplex Sp. z o.o.
- DryTech India
- Krishna Enzytech
- Avani Food Products
- Milk Speciality Global
- Erie Foods International Inc.
- Nippon Shinyaku Co., Ltd.
- Hoogwegt Group
- Cottee Group Pty Ltd.
- Clarion Casein Ltd
- Armor Protéines
- Competition Deep Dive
- Assumptions & Acronyms Used


