Calcium Carbonate Market Size and Share Forecast Outlook 2025 to 2035

The global calcium carbonate market is anticipated to grow from USD 28.5 billion in 2025 to USD 48.4 billion by 2035, achieving a CAGR of 5.4% during the forecast period. Growth is being supported by increased demand from the construction, paper, plastics, and healthcare sectors, where calcium carbonate is being used as a filler, pigment, functional additive, and excipient.
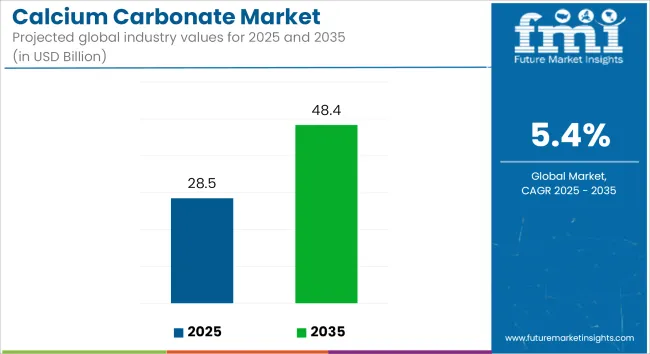
Quick Stats for Calcium Carbonate Market

  • Industry Value (2025): USD 28.5 billion
  • Forecast Value (2035): USD 48.4 billion
  • Forecast CAGR: 5.4%
  • Leading Segment in 2025: Fillers (46% share)
  • Key Growth Region: Asia-Pacific, Latin America
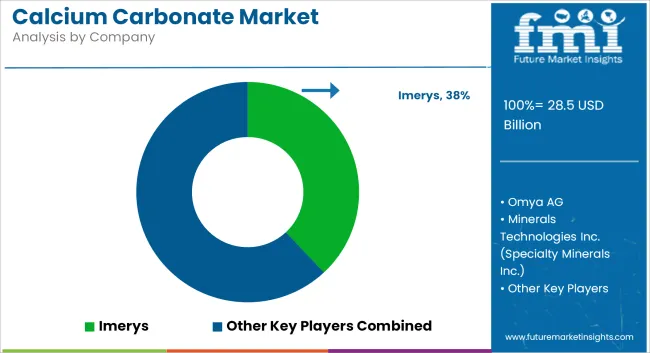
  • Top Key Players: Imerys, Omya AG, Minerals Technologies Inc., J.M. Huber Corporation, Mississippi Lime Company

Calcium Carbonate Market   Industry Value Analysis

Metric Value
Market Size (2025E) USD 28.5 billion
Market Value (2035F) USD 48.4 billion
CAGR (2025 to 2035) 5.4%

In construction, ground calcium carbonate (GCC) is being incorporated into cement, concrete, and asphalt mixes to enhance compressive strength, improve surface finish, and reduce material costs. Infrastructure development and building renovations are driving greater volumes of GCC usage in dry-mix mortars, concrete blocks, roofing tiles, and road base layers.

The paper industry is utilizing both GCC and precipitated calcium carbonate (PCC) to improve brightness, printability, and opacity in coated and uncoated paper. As environmental guidelines call for reductions in virgin pulp content and water consumption, calcium carbonate is being preferred as a sustainable and cost-effective filler.

In plastics, calcium carbonate is being adopted to reinforce polymers, enhance thermal stability, and reduce overall polymer consumption. Its use in masterbatches, PVC pipes, films, and packaging materials supports lightweighting strategies and product lifecycle improvements.

The healthcare and pharmaceutical sectors are relying on calcium carbonate as a widely accepted excipient and active ingredient in antacids and calcium supplements. Its high bioavailability, neutral pH behavior, and safe ingestion profile continue to support its inclusion in tablet and suspension formulations.

Efforts to meet performance and sustainability targets are accelerating the development of high-purity, engineered, and nano-scale calcium carbonate grades. These are being evaluated for enhanced dispersion, improved reactivity, and optimized rheological performance across a range of industrial and biomedical applications.

As industrial decarbonization and circular economy initiatives advance, calcium carbonate is being positioned as a renewable, low-impact material capable of supporting formulation efficiency and environmental compliance. The market is expected to maintain steady momentum through 2035 as manufacturers invest in product innovation, processing efficiency, and end-use diversification

Analyzing Calcium Carbonate Market by Top Investment Segments

Fillers are projected to dominate application demand due to their wide usage across plastics, rubber, paper, and coatings industries

Fillers are estimated to account for approximately 46% of the global calcium carbonate market share in 2025 and are projected to grow at a CAGR of 5.5% through 2035. Calcium carbonate is extensively used as a functional filler to enhance the strength, brightness, and dimensional stability of end products. Its cost-effectiveness and compatibility with polymers and resins make it a preferred additive in plastic films, rubber goods, adhesives, and industrial coatings.

Demand remains strong in Asia-Pacific and Latin America where cost-driven manufacturing across construction materials, packaging, and molded products continues to expand. Manufacturers are investing in coated and micronized grades to offer improved dispersion, surface finish, and processing efficiency for high-performance applications.
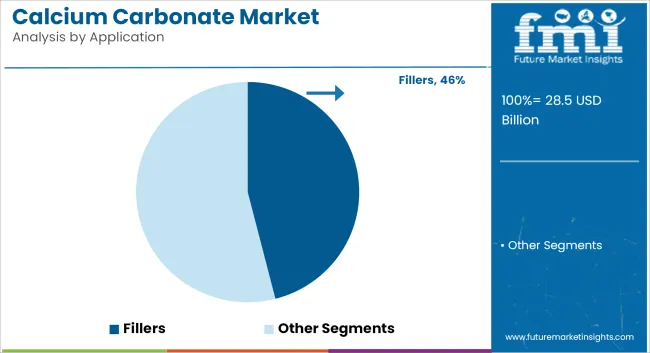
Calcium Carbonate Market   Analysis By Application

Paper industry is expected to lead end-use consumption with continued reliance on calcium carbonate for brightness, opacity, and bulk control

The paper segment is projected to hold approximately 34% of the global calcium carbonate market share in 2025 and is expected to grow at a CAGR of 5.3% through 2035. Calcium carbonate is used both as a coating pigment and as a filler in paper production to improve printability, gloss, and smoothness.

Ground and precipitated calcium carbonate are integral in the production of high-quality printing and writing paper, tissue, and packaging grades. With ongoing demand for lightweight and recyclable paper products, especially in food packaging and e-commerce, the role of calcium carbonate remains critical. Additionally, as mills adopt cost-efficient and environmentally friendly formulations, calcium carbonate continues to be a cornerstone raw material in the paper value chain.
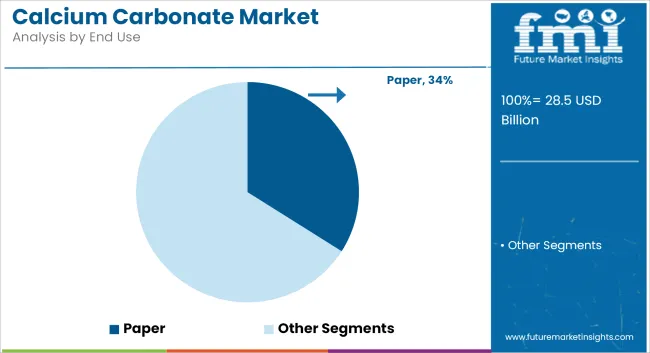
Calcium Carbonate Market   Analysis By End Use

Challenges and Opportunities

Challenges

Environmental Regulations and Resource Depletion

A major challenge facing the calcium carbonate market is the tightening of environmental regulations regarding mining and emissions. Sustainability issues arise because the raw limestone must be mined, and that calcinating process is very energy-intensive.

More stringent mining permits and environmental assessment requirements in places such as Europe and North America can also slow supply growth. In addition, depletion of high-purity limestone reserves in certain regions makes sourcing high-end applications (i.e., pharmaceutical and food-grade) more difficult over the longer term.

This also limits the potential for these regions to develop the advanced processing infrastructure needed to produce the premium quality defined by PCC or nano-calcium carbonate and capture the related market potential.

Opportunities

Green Manufacturing and Technological Advancements

A surge in interest in eco-friendly and recyclable materials serves as an important trend for market growth in calcium carbonate. And with a move toward circular economy models, manufacturers are also investigating the role of calcium carbonate in biodegradable plastics and fiber-based packaging.

Nanotechnology is a technological innovation that has led to the creation of new calcium carbonate with high performance, which improves mechanical and barrier film and polymer properties. In addition, the growing demand for functional food and nutraceuticals creates opportunities for ultra-pure calcium carbonate in supplements and fortified products. In addition, the use of energy-efficient mining and low-carbon processing methods will raise the economics and sustainability of production.

Country-Wise Outlook

United States

Calcium carbonate consumption is dominated by construction, paper and the pharmaceutical industry, with the United States being the leading producer. Robust consumption of GCC in cement and paints, while PCC is gradually being used in dietary supplements and as food fortification. The EPA’s environmental controls and emphasis on carbon reduction have also brought higher calcium carbonate use in desulfurization and neutralization processes.

Country CAGR (2025 to 2035)
United States 4.7%

United Kingdom

Emerging regulatory pressure for environmental performance along with growing consumption of calcium carbonate in green building materials are boosting market deployment in the UK. PCC is gaining notable momentum in food and pharmaceutical applications, where consumers are looking for clean-label,high-purity additives. Demand is also being boosted by the UK’s packaging and printing industries.

Country CAGR (2025 to 2035)
United Kingdom 4.6%

European Union

In the objectively available economic data, the EU is powered by industrial sectors in Germany, France and Italy where PCC and GCC are both prominent. Emissions regulation and circular economy initiative is raising use in flue gas desulfurization and waste Neutralization. The application of PCC around the area in cutting-edge coatings, polymers, and medical services are experiencing a tremendous growth.

Region CAGR (2025 to 2035)
European Union 4.8%

Japan

Tokuyama, a Japanese chemical company, has launched the world's most suitable ultrafine PCC suitable for food, pharmaceutical and electronic packaging, due to Japan's high manufacturing precision. With advanced R&D and use of nanomaterials in consumer and industrial products, Japanese market is through and through technology inclined regarding calcium carbonate applications.

Country CAGR (2025 to 2035)
Japan 4.9%

South Korea

Strong cosmetics and electronics sector in South Korea is PA calcium carbonate growth, especially PCCs for use in inks, polymer films and cosmetic powders. Continual investments in pollution control technologies have also generated demand related to desulfurization

Country CAGR (2025 to 2035)
South Korea 5.1%

Competitive Outlook

The calcium carbonate market is becoming more competitive, with companies focusing on performance differentiation and sustainability. Leading producers are investing in nano calcium carbonate, functionalized PCC, and hybrid filler systems to cater to demand from high-performance plastics and paper segments. Geographic expansion particularly in Asia-Pacific and Latin America is underway to meet growing regional demand.

Key players are developing proprietary technologies to reduce energy intensity and improve particle morphology, enabling broader adoption in food, pharmaceutical, and cosmetic applications. Some firms are also entering into long-term supply agreements with downstream manufacturers to ensure secure offtake.

M&A activity is expected to intensify as companies seek scale, raw material access, and R&D capabilities to compete in premium markets. As customers demand more sustainable, cost-effective, and high-performing filler solutions, innovation and integration are becoming central to market leadership.

Key Development
  • June 9, 2025, ICL Industrial Products unveiled its new CalciPure™ EX, developed using a patented precipitation process. This innovation significantly enhances calcium carbonate’s performance in chewable tablets and controlled-release medications. Designed to support treatments for osteoporosis and gastrointestinal disorders, CalciPure™ EX reflects ICL’s commitment to precision-engineered excipients tailored for pharmaceutical applications.
  • June 9, 2025, Omya AG announced a major expansion of its GMP-certified production facilities for pharmaceutical-grade calcium carbonate. The company’s PharmaPure™ line now meets global pharmacopeia standards (USP/EP/JP) and is supplied to over 120 countries. This move addresses rising demand for ultra-pure calcium carbonate in drug formulations, especially for bone health and antacid applications.

Calcium Carbonate Market   Analysis By Company

Companies

  • Imerys
  • Omya AG
  • Minerals Technologies Inc. (Specialty Minerals Inc.)
  • J.M. Huber Corporation (Huber Engineered Materials)
  • Mississippi Lime Company
  • Carmeuse
  • Sibelco
  • Midwest Calcium Carbonates (MCC)
  • Calcinor
  • Pentachemicals (PENTA s.r.o.)

Key Segmentation

By Product Type:

  • Ground Calcium Carbonate (GCC)
  • Precipitated Calcium Carbonate (PCC)

By Application:

  • Fillers
  • Neutralizing Agents
  • Construction Materials
  • Dietary Supplements
  • Desulfurization
  • Additive
  • Others

By End Use:

  • Paper
  • Plastic & Rubber
  • Paints & Coatings
  • Adhesives & Sealants
  • Cement & Ceramics
  • Agriculture
  • Pharmaceuticals
  • Others

By Region:

  • North America
  • Latin America
  • Europe
  • East Asia
  • South Asia & Pacific
  • Middle East & Africa

Table of Content

  1. Executive Summary
  2. Industry Introduction, including Taxonomy and Market Definition
  3. Market Trends and Success Factors, including Macro-economic Factors, Market Dynamics, and Recent Industry Developments
  4. Global Market Demand Analysis 2020 to 2024 and Forecast 2025 to 2035, including Historical Analysis and Future Projections
  5. Pricing Analysis
  6. Global Market Analysis 2020 to 2024 and Forecast 2025 to 2035
    • Product Type
    • Application
    • End Use
  7. Global Market Analysis 2020 to 2024 and Forecast 2025 to 2035, By Product Type
    • Ground (GCC)
    • Precipitated (PCC)
  8. Global Market Analysis 2020 to 2024 and Forecast 2025 to 2035, By Application
    • Fillers
    • Neutralizing Agents
    • Construction Materials
    • Dietary Supplements
    • Desulfurization
    • Additive
    • Others
  9. Global Market Analysis 2020 to 2024 and Forecast 2025 to 2035, By End Use
    • Paper
    • Plastic & Rubber
    • Paints & Coatings
    • Adhesives & Sealants
    • Cement & Ceramics
    • Agriculture
    • Pharmaceuticals
    • Others
  10. Global Market Analysis 2020 to 2024 and Forecast 2025 to 2035, By Region
    • North America
    • Latin America
    • Western Europe
    • Eastern Europe
    • East Asia
    • South Asia Pacific
    • Middle East and Africa
  11. North America Sales Analysis 2020 to 2024 and Forecast 2025 to 2035, by Key Segments and Countries
  12. Latin America Sales Analysis 2020 to 2024 and Forecast 2025 to 2035, by Key Segments and Countries
  13. Western Europe Sales Analysis 2020 to 2024 and Forecast 2025 to 2035, by Key Segments and Countries
  14. Eastern Europe Sales Analysis 2020 to 2024 and Forecast 2025 to 2035, by Key Segments and Countries
  15. East Asia Sales Analysis 2020 to 2024 and Forecast 2025 to 2035, by Key Segments and Countries
  16. South Asia Pacific Sales Analysis 2020 to 2024 and Forecast 2025 to 2035, by Key Segments and Countries
  17. Middle East and Africa Sales Analysis 2020 to 2024 and Forecast 2025 to 2035, by Key Segments and Countries
  18. Sales Forecast 2025 to 2035 by Product Type, Application, and End Use for 30 Countries
  19. Competition Outlook, including Market Structure Analysis, Company Share Analysis by Key Players, and Competition Dashboard
  20. Company Profile
    • Imerys
    • Omya AG
    • Minerals Technologies Inc.
    • Huber Engineered Materials
    • Mississippi Lime Company
    • Carmeuse
    • Sibelco
    • Midwest Calcium Carbonate
    • Calcinor SA
    • Excalibar Minerals LLC

List of Tables

  • Table 01: Global Market Value (USD Million) & Volume (KT) by Product Type, 2020 to 2035
  • Table 02: Global Market Value (USD Million) and Volume (KT) Forecast by Application, 2020 to 2035
  • Table 03: Global Market Value (USD Million) and Volume (KT) Forecast by End Use, 2020 to 2035
  • Table 04: Global Market Value (USD Million) and Volume (KT) Forecast by Region, 2020 to 2035
  • Table 05: North America Market Size (USD Million) and Volume (KT) Forecast by Country, 2020 to 2035
  • Table 06: North America Market Value (USD Million) and Volume (KT) Forecast by Product Type, 2020 to 2035
  • Table 07: North America Market Size (USD Million) and Volume (KT) Forecast by Application, 2020 to 2035
  • Table 08: North America Market Size (USD Million) and Volume (KT) Forecast by End Use, 2020 to 2035
  • Table 09: Latin America Market Size (USD Million) and Volume (KT) Forecast by Country, 2020 to 2035
  • Table 10: Latin America Market Value (USD Million) and Volume (KT) Forecast by Product Type, 2020 to 2035
  • Table 11: Latin America Market Size (USD Million) and Volume (KT) Forecast by Application, 2020 to 2035
  • Table 12: Latin America Market Size (USD Million) and Volume (KT) Forecast by End Use, 2020 to 2035
  • Table 13: Europe Market Size (USD Million) and Volume (KT) Forecast by Country, 2020 to 2035
  • Table 14: Europe Market Value (USD Million) and Volume (KT) Forecast by Product Type, 2020 to 2035
  • Table 15: Europe Market Size (USD Million) and Volume (KT) Forecast by Application, 2020 to 2035
  • Table 16: Europe Market Size (USD Million) and Volume (KT) Forecast by End Use, 2020 to 2035
  • Table 17: South Asia & Pacific Market Size (USD Million) and Volume (KT) Forecast by Country, 2020 to 2035
  • Table 18: South Asia & Pacific Market Value (USD Million) and Volume (KT) Forecast by Product Type, 2020 to 2035
  • Table 19: South Asia & Pacific Market Size (USD Million) and Volume (KT) Forecast by Application, 2020 to 2035
  • Table 20: South Asia & Pacific Market Size (USD Million) and Volume (KT) Forecast by End Use, 2020 to 2035
  • Table 21: East Asia Market Size (USD Million) and Volume (KT) Forecast by Country, 2020 to 2035
  • Table 22: East Asia Market Value (USD Million) and Volume (KT) Forecast by Product Type, 2020 to 2035
  • Table 23: East Asia Market Size (USD Million) and Volume (KT) Forecast by Application, 2020 to 2035
  • Table 24: East Asia Market Size (USD Million) and Volume (KT) Forecast by End Use, 2020 to 2035
  • Table 25: Middle East & Africa Market Size (USD Million) and Volume (KT) Forecast by Country, 2020 to 2035
  • Table 26: Middle East & Africa Market Value (USD Million) and Volume (KT) Forecast by Product Type, 2020 to 2035
  • Table 27: Middle East & Africa Market Size (USD Million) and Volume (KT) Forecast by Application, 2020 to 2035
  • Table 28: Middle East & Africa Market Size (USD Million) and Volume (KT) Forecast by End Use, 2020 to 2035

List of Figures

  • Figure 01: Global Historical Market Volume (KT) Analysis, 2020 to 2025
  • Figure 02: Global Current and Future Market Volume (KT) Analysis, 2025 to 2035
  • Figure 03: Global Market Value (USD Million), 2020 to 2025
  • Figure 04: Global Market Value (USD Million) Forecast, 2025 to 2035
  • Figure 05: Global Market Absolute $ Opportunity,2025 and 2035
  • Figure 06: Global Market Share and BPS Analysis by Product Type 2025 to 2035
  • Figure 07: Global Market Y-o-Y Growth Projections by Product Type, 2025 to 2035
  • Figure 08: Global Market Absolute $ Opportunity by GCC Segment
  • Figure 09: Global Market Absolute $ Opportunity by PCC Segment
  • Figure 10: Global Market Attractiveness Analysis by Product Type, 2025 to 2035
  • Figure 11: Global Market Share and BPS Analysis by Application 2025 to 2035
  • Figure 12: Global Market Y-o-Y Growth Projections by Application, 2025 to 2035
  • Figure 13: Global Market Absolute $ Opportunity by Fillers Segment
  • Figure 14: Global Market Absolute $ Opportunity by Neutralizing Agents Segment
  • Figure 15: Global Market Absolute $ Opportunity by Construction Materials Segment
  • Figure 16: Global Market Absolute $ Opportunity by Dietary Supplements Segment
  • Figure 17: Global Market Absolute $ Opportunity by Desulfurization Segment
  • Figure 18: Global Market Absolute $ Opportunity by Additive Segment
  • Figure 19: Global Market Absolute $ Opportunity by Others Segment
  • Figure 20: Global Market Attractiveness Analysis by Application, 2025 to 2035
  • Figure 21: Global Market Share and BPS Analysis by End Use 2025 to 2035
  • Figure 22: Global Market Y-o-Y Growth Projections by End Use, 2025 to 2035
  • Figure 23: Global Market Absolute $ Opportunity by Paper Segment
  • Figure 24: Global Market Absolute $ Opportunity by Plastic & Rubber Segment
  • Figure 25: Global Market Absolute $ Opportunity by Paints & Coatings Segment
  • Figure 26: Global Market Absolute $ Opportunity by Adhesives & Sealants Segment
  • Figure 27: Global Market Absolute $ Opportunity by Cement & Ceramics Segment
  • Figure 28: Global Market Absolute $ Opportunity by Agriculture Segment
  • Figure 29: Global Market Absolute $ Opportunity by Pharmaceuticals Segment
  • Figure 30: Global Market Absolute $ Opportunity by Others Segment
  • Figure 31: Global Market Attractiveness Analysis by End Use, 2025 to 2035
  • Figure 32: Global Market Share and BPS Analysis by Region 2025 to 2035
  • Figure 33: Global Market Y-o-Y Growth Projections by Region, 2025 to 2035
  • Figure 34: Global Market Absolute $ Opportunity by North America Segment
  • Figure 35: Global Market Absolute $ Opportunity by Latin America Segment
  • Figure 36: Global Market Absolute $ Opportunity by Europe Segment
  • Figure 37: Global Market Absolute $ Opportunity by East Asia Segment
  • Figure 38: Global Market Absolute $ Opportunity by South Asia Pacific Segment
  • Figure 39: Global Market Absolute $ Opportunity by MEA Segment
  • Figure 40: Global Market Attractiveness Analysis by Region, 2025 to 2035
  • Figure 41: North America Market Share and BPS Analysis by Country 2025 to 2035
  • Figure 42: North America Market Y-o-Y Growth Projections by Country, 2025 to 2035
  • Figure 43: North America Market Attractiveness Analysis by Country, 2025 to 2035
  • Figure 44: North America Market Share and BPS Analysis by Product Type 2025 to 2035
  • Figure 45: North America Market Y-o-Y Growth Projections by Product Type, 2025 to 2035
  • Figure 46: North America Market Attractiveness Analysis by Product Type, 2025 to 2035
  • Figure 47: North America Market Share and BPS Analysis by Application 2025 to 2035
  • Figure 48: North America Market Y-o-Y Growth Projections by Application, 2025 to 2035
  • Figure 49: North America Market Attractiveness Analysis by Application, 2025 to 2035
  • Figure 50: North America Market Share and BPS Analysis by End Use 2025 to 2035
  • Figure 51: North America Market Y-o-Y Growth Projections by End Use, 2025 to 2035
  • Figure 52: North America Market Attractiveness Analysis by End Use, 2025 to 2035
  • Figure 53: Latin America Market Share and BPS Analysis by Country 2025 to 2035
  • Figure 54: Latin America Market Y-o-Y Growth Projections by Country, 2025 to 2035
  • Figure 55: Latin America Market Attractiveness Analysis by Country, 2025 to 2035
  • Figure 56: Latin America Market Share and BPS Analysis by Product Type 2025 to 2035
  • Figure 57: Latin America Market Y-o-Y Growth Projections by Product Type, 2025 to 2035
  • Figure 58: Latin America Market Attractiveness Analysis by Product Type, 2025 to 2035
  • Figure 59: Latin America Market Share and BPS Analysis by Application 2025 to 2035
  • Figure 60: Latin America Market Y-o-Y Growth Projections by Application, 2025 to 2035
  • Figure 61: Latin America Market Attractiveness Analysis by Application, 2025 to 2035
  • Figure 62: Latin America Market Share and BPS Analysis by End Use 2025 to 2035
  • Figure 63: Latin America Market Y-o-Y Growth Projections by End Use, 2025 to 2035
  • Figure 64: Latin America Market Attractiveness Analysis by End Use, 2025 to 2035
  • Figure 65: Europe Market Share and BPS Analysis by Country 2025 to 2035
  • Figure 66: Europe Market Y-o-Y Growth Projections by Country, 2025 to 2035
  • Figure 67: Europe Market Attractiveness Analysis by Country, 2025 to 2035
  • Figure 68: Europe Market Share and BPS Analysis by Product Type 2025 to 2035
  • Figure 69: Europe Market Y-o-Y Growth Projections by Product Type, 2025 to 2035
  • Figure 70: Europe Market Attractiveness Analysis by Product Type, 2025 to 2035
  • Figure 71: Europe Market Share and BPS Analysis by Application 2025 to 2035
  • Figure 72: Europe Market Y-o-Y Growth Projections by Application, 2025 to 2035
  • Figure 73: Europe Market Attractiveness Analysis by Application, 2025 to 2035
  • Figure 74: Europe Market Share and BPS Analysis by End Use 2025 to 2035
  • Figure 75: Europe Market Y-o-Y Growth Projections by End Use, 2025 to 2035
  • Figure 76: Europe Market Attractiveness Analysis by End Use, 2025 to 2035
  • Figure 77: South Asia & Pacific Market Share and BPS Analysis by Country 2025 to 2035
  • Figure 78: South Asia & Pacific Market Y-o-Y Growth Projections by Country, 2025 to 2035
  • Figure 79: South Asia & Pacific Market Attractiveness Analysis by Country, 2025 to 2035
  • Figure 80: South Asia & Pacific Market Share and BPS Analysis by Product Type 2025 to 2035
  • Figure 81: South Asia & Pacific Market Y-o-Y Growth Projections by Product Type, 2025 to 2035
  • Figure 82: South Asia & Pacific Market Attractiveness Analysis by Product Type, 2025 to 2035
  • Figure 83: South Asia & Pacific Market Share and BPS Analysis by Application 2025 to 2035
  • Figure 84: South Asia & Pacific Market Y-o-Y Growth Projections by Application, 2025 to 2035
  • Figure 85: South Asia & Pacific Market Attractiveness Analysis by Application, 2025 to 2035
  • Figure 86: South Asia & Pacific Market Share and BPS Analysis by End Use 2025 to 2035
  • Figure 87: South Asia & Pacific Market Y-o-Y Growth Projections by End Use, 2025 to 2035
  • Figure 88: South Asia & Pacific Market Attractiveness Analysis by End Use, 2025 to 2035
  • Figure 89: East Asia Market Share and BPS Analysis by Country 2025 to 2035
  • Figure 90: East Asia Market Y-o-Y Growth Projections by Country, 2025 to 2035
  • Figure 91: East Asia Market Attractiveness Analysis by Country, 2025 to 2035
  • Figure 92: East Asia Market Share and BPS Analysis by Product Type 2025 to 2035
  • Figure 93: East Asia Market Y-o-Y Growth Projections by Product Type, 2025 to 2035
  • Figure 94: East Asia Market Attractiveness Analysis by Product Type, 2025 to 2035
  • Figure 95: East Asia Market Share and BPS Analysis by Application 2025 to 2035
  • Figure 96: East Asia Market Y-o-Y Growth Projections by Application, 2025 to 2035
  • Figure 97: East Asia Market Attractiveness Analysis by Application, 2025 to 2035
  • Figure 98: East Asia Market Share and BPS Analysis by End Use 2025 to 2035
  • Figure 99: East Asia Market Y-o-Y Growth Projections by End Use, 2025 to 2035
  • Figure 100: East Asia Market Attractiveness Analysis by End Use, 2025 to 2035
  • Figure 101: Middle East & Africa Market Share and BPS Analysis by Country 2025 to 2035
  • Figure 102: Middle East & Africa Market Y-o-Y Growth Projections by Country, 2025 to 2035
  • Figure 103: Middle East & Africa a Market Attractiveness Analysis by Country, 2025 to 2035
  • Figure 104: Middle East & Africa Market Share and BPS Analysis by Product Type 2025 to 2035
  • Figure 105: Middle East & Africa Market Y-o-Y Growth Projections by Product Type, 2025 to 2035
  • Figure 106: Middle East & Africa Market Attractiveness Analysis by Product Type, 2025 to 2035
  • Figure 107: Middle East & Africa Market Share and BPS Analysis by Application 2025 to 2035
  • Figure 108: Middle East & Africa Market Y-o-Y Growth Projections by Application, 2025 to 2035
  • Figure 109: Middle East & Africa Market Attractiveness Analysis by Application, 2025 to 2035
  • Figure 110: Middle East & Africa Market Share and BPS Analysis by End Use 2025 to 2035
  • Figure 111: Middle East & Africa Market Y-o-Y Growth Projections by End Use, 2025 to 2035
  • Figure 112: Middle East & Africa Market Attractiveness Analysis by End Use, 2025 to 2035

Frequently Asked Questions

What was the overall size of the calcium carbonate market in 2025?

The market size in 2025 was USD 28.5 billion.

How big is the calcium carbonate market expected to be in 2035?

It is projected to reach USD 48.4 billion by 2035.

What will drive the demand for the calcium carbonate market during the forecast period?

Key growth drivers include rising demand from the construction, paper, plastics, and healthcare industries, along with its widespread use as a filler and excipient.

List the top 5 countries contributing to the calcium carbonate market.

The top contributors are United States, China, India, Germany, and Japan.

Which segment is expected to dominate the calcium carbonate market?

The filler material segment is anticipated to dominate due to its extensive use in polymer processing, paper manufacturing, and other industrial applications.

Explore Similar Insights

Future Market Insights

Calcium Carbonate Market