The precipitated silica industry stands at the threshold of a decade-long expansion trajectory that promises to reshape tire manufacturing technology, oral care formulations, and industrial chemical applications. As per Future Market Insights, valued for verified global insights into chemical transformation and applications, the market's journey from USD 4.1 billion in 2025 to USD 6.7 billion by 2035 represents substantial growth, demonstrating the accelerating adoption of advanced silica formulations and green-tire technology across automotive, personal care, and industrial sectors.
The first half of the decade (2025-2030) will witness the market climbing from USD 4.1 billion to approximately USD 5.2 billion, adding USD 1.1 billion in value, which constitutes 42% of the total forecast growth period. This phase will be characterized by the rapid adoption of highly dispersible silica systems, driven by increasing green-tire production volumes and the growing need for fuel-efficient automotive applications worldwide. Advanced precipitation technologies and automated production systems will become standard expectations rather than premium options.
The latter half (2030-2035) will witness sustained growth from USD 5.2 billion to USD 6.7 billion, representing an addition of USD 1.5 billion or 58% of the decade's expansion. This period will be defined by mass market penetration of specialty silica grades, integration with comprehensive manufacturing platforms, and seamless compatibility with electric vehicle tire requirements and premium oral care applications. The market trajectory signals fundamental shifts in how manufacturers approach silica-based formulations and production quality management, with participants positioned to benefit from sustained demand across multiple grade categories and application segments.
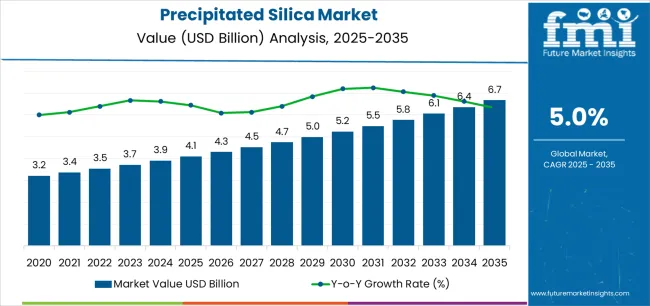
The Precipitated Silica market demonstrates distinct growth phases with varying market characteristics and competitive dynamics. Between 2025 and 2030, the market progresses through its technology adoption phase, expanding from USD 4.1 billion to USD 5.2 billion with steady annual increments averaging 5.0% growth. This period showcases the transition from conventional silica grades to highly dispersible systems with enhanced fuel efficiency capabilities and integrated quality control systems becoming mainstream features.
The 2025-2030 phase adds USD 1.1 billion to market value, representing 42% of total decade expansion. Market maturation factors include standardization of green-tire manufacturing protocols, declining production costs for specialty silica grades, and increasing automotive industry awareness of fuel efficiency benefits reaching 15-20% rolling resistance reduction in tire applications. Competitive landscape evolution during this period features established chemical companies like Evonik Industries AG and Solvay expanding their silica portfolios while specialty manufacturers focus on rice-husk-derived and sustainable silica development.
From 2030 to 2035, market dynamics shift toward advanced grade diversification and global automotive electrification, with growth continuing from USD 5.2 billion to USD 6.7 billion, adding USD 1.5 billion or 58% of total expansion. This phase transition centers on specialty dental and oral care silicas, integration with electric vehicle tire platforms, and deployment across diverse industrial applications, becoming standard rather than specialized formulations. The competitive environment matures with focus shifting from basic silica production to comprehensive application optimization systems and integration with sustainable manufacturing platforms.
| Metric | Value |
|---|---|
| Market Value (2025) | USD 4.1 billion |
| Market Forecast (2035) | USD 6.7 billion |
| Growth Rate | 5.0% CAGR |
| Leading Technology | Highly Dispersible Silica (HDS) Grade |
| Primary Application | Tires & Rubber Segment |
The market demonstrates strong fundamentals with highly dispersible silica systems capturing a dominant share through advanced fuel efficiency and green-tire optimization capabilities. Tires & rubber applications drive primary demand, supported by increasing automotive electrification and fuel efficiency requirements. Geographic expansion remains concentrated in Asia-Pacific markets with established tire manufacturing infrastructure, while developed economies in Europe and North America show steady adoption rates driven by environmental regulations and premium oral care formulations.
Market expansion rests on three fundamental shifts driving adoption across automotive, oral care, and industrial sectors. Automotive electrification and fuel efficiency regulations create compelling operational advantages through precipitated silica that enables 15-20% rolling resistance reduction in green tires without compromising safety performance, enabling tire manufacturers to meet environmental standards while maintaining vehicle efficiency and reducing carbon emissions. Oral care formulation advancement accelerates as personal care companies worldwide seek advanced abrasive systems that complement whitening technologies, enabling precise cleaning efficacy and enamel protection that align with consumer health standards and product differentiation requirements.
Industrial application diversification drives adoption from coatings, adhesives, and agricultural sectors requiring effective reinforcement solutions that enhance product performance while maintaining cost efficiency during formulation development and manufacturing operations. However, growth faces headwinds from raw material sourcing challenges that vary across suppliers regarding sodium silicate availability and energy-intensive production processes, which may limit adoption in cost-sensitive manufacturing environments. Geographic concentration also persists with production facilities clustered in regions with established chemical infrastructure, affecting supply chain flexibility in emerging markets.
The precipitated silica market represents a diversified yet critical industrial chemical opportunity driven by expanding global automotive electrification, oral care sophistication, and industrial application requirements for superior reinforcement effectiveness. The convergence of automotive environmental regulations, consumer health awareness, and industrial performance requirements creates sustained demand drivers across multiple end-use segments. The market's growth trajectory from USD 4.1 billion in 2025 to USD 6.7 billion by 2035 at a 5.0% CAGR reflects fundamental shifts in tire manufacturing technology and specialty chemical formulation optimization. Geographic expansion opportunities are particularly pronounced in Asia-Pacific markets, where India (7.0% CAGR) and China (6.2% CAGR) lead through aggressive automotive manufacturing programs and oral care market development. The dominance of highly dispersible silica systems (46.0% market share) and tires & rubber applications (57.0% share) provides clear strategic focus areas, while emerging oral care and industrial applications open new revenue streams across diverse manufacturing markets.
Strengthening the dominant highly dispersible silica segment (46.0% market share) through enhanced precipitation technologies and superior dispersion characteristics enables 15-20% rolling resistance reduction in green-tire manufacturing. Advanced chemical engineering and specialized formulations for electric vehicle applications support premium positioning while defending competitive advantages. This pathway consolidates market leadership through automated production systems and sustainable manufacturing practices. Expected revenue pool: USD 280-420 million
India (7.0% CAGR) and China (6.2% CAGR) lead geographic expansion opportunities through local production capabilities and rice-husk silica technology. Growing vehicle production and oral care market sophistication drive sustained demand, while localization strategies reduce logistics costs and enable faster technical support for regional procurement programs across automotive and personal care applications. Expected revenue pool: USD 250-380 million
The dominant tires & rubber segment (57.0% market share) offers expansion through specialized formulations addressing green-tire requirements and electric vehicle applications. Premium positioning reflects superior rolling resistance reduction and comprehensive automotive compliance, supporting modern tire manufacturing with advanced mixing technologies and compound optimization systems for passenger and commercial vehicles. Expected revenue pool: USD 220-340 million
Strategic expansion into oral care applications (15.0% market share) requires specialized abrasive characteristics and dental-grade purity standards for premium toothpaste formulations. This pathway addresses electric toothbrush compatibility, whitening technology integration, and sensitive teeth applications through advanced precipitation control, creating opportunities for long-term supply agreements and co-development partnerships. Expected revenue pool: USD 180-280 million
Specialty precipitated silica development for coatings & inks (10.0% share), adhesives & sealants (8.0%), and agricultural applications encompasses matting agents, rheology modifiers, and anti-caking agents. Technology differentiation through proprietary surface treatments and application-specific optimization enables diversified revenue streams while reducing tire application dependency. Expected revenue pool: USD 160-240 million
Integration of rice-husk-derived silica technology enables circular economy positioning through biomass utilization and carbon footprint reduction. Premium positioning through environmental leadership creates opportunities for sustainability-focused procurement programs and partnerships with environmentally-driven manufacturers across automotive and consumer goods sectors. Expected revenue pool: USD 140-220 million
Cost-optimized conventional precipitated silica (42.0% share) addresses price-sensitive applications and emerging market requirements through production efficiency optimization and value-engineered formulations. Market positioning emphasizes reliable performance and competitive pricing for standard tire, industrial rubber, and basic coating applications across cost-focused manufacturing segments. Expected revenue pool: USD 130-200 million
Primary Classification: The market segments by Grade into Highly Dispersible Silica (HDS), Conventional Precipitated, and Specialty Dental/Oral categories, representing the evolution from basic reinforcing fillers to advanced functional additives for comprehensive performance optimization.
Secondary Classification: Application segmentation divides the market into Tires & Rubber, Oral Care, Coatings & Inks, Adhesives & Sealants, and Food/Feed & Others sectors, reflecting distinct requirements for particle morphology, surface chemistry, and functional performance.
Tertiary Classification: End-use Industry segmentation covers Automotive, Personal Care & Oral, Industrial & Chemicals, Agriculture, and Others, demonstrating diverse demand drivers across manufacturing sectors.
Regional Classification: Geographic distribution spans Asia-Pacific, Europe, North America, Latin America, and Middle East & Africa, with Asia-Pacific markets leading adoption while developed economies show steady growth patterns driven by environmental regulations and premium applications.
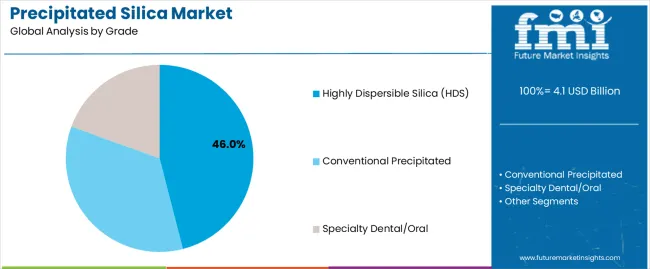
Market Position: Highly Dispersible Silica systems command the leading position in the Precipitated Silica market with approximately 46.0% market share through advanced dispersion features, including superior fuel efficiency contribution, optimized surface area characteristics, and green-tire performance optimization that enable tire manufacturers to achieve 15-20% rolling resistance reduction across passenger and commercial vehicle applications.
Value Drivers: The segment benefits from automotive manufacturer preference for fuel-efficient tire systems that provide environmental compliance, reduced carbon emissions, and vehicle efficiency optimization without requiring significant compound reformulation. Advanced precipitation features enable automated mixing systems, consistent dispersion quality, and integration with existing tire production equipment.
Competitive Advantages: Highly Dispersible Silica systems differentiate through proven fuel efficiency benefits, consistent batch-to-batch quality, and integration with silane coupling agent technology that enhance tire performance while maintaining safety standards suitable for electric vehicle and premium automotive applications.
Key market characteristics:
Conventional Precipitated silica systems maintain a significant 42.0% market share in the Precipitated Silica market due to their cost-effective production and broad application versatility. These systems appeal to manufacturers requiring reliable reinforcement characteristics with competitive pricing for high-volume industrial rubber, standard tire, and basic coating applications.
Specialty Dental/Oral silica systems hold approximately 12.0% market share, focusing on premium toothpaste formulations and advanced oral care applications. These grades demand stringent purity standards, controlled particle morphology, and specialized abrasive characteristics for whitening efficacy and enamel safety.
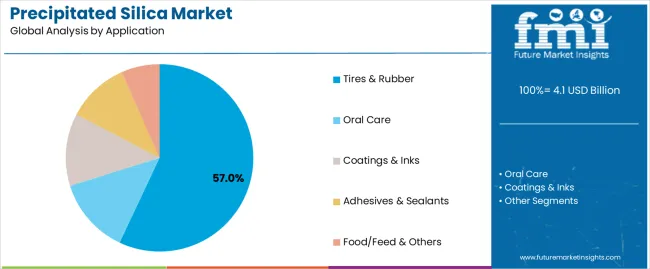
Market Context: Tires & rubber applications dominate the Precipitated Silica market with approximately 57.0% market share due to widespread adoption of green-tire technology and increasing focus on fuel efficiency optimization, rolling resistance reduction, and environmental compliance applications that minimize vehicle emissions while maintaining tire safety standards.
Appeal Factors: Tire manufacturers prioritize system performance, fuel efficiency contribution, and integration with existing compound formulations that enable coordinated silica-silane systems across multiple tire lines. The segment benefits from substantial automotive industry investment in electrification programs that emphasize the acquisition of advanced silica grades for fuel efficiency and sustainability applications.
Growth Drivers: Electric vehicle production expansion programs incorporate highly dispersible silica as standard material for green-tire manufacturing operations, while automotive environmental regulations increase demand for advanced reinforcement capabilities that comply with fuel efficiency standards and minimize carbon footprint.
Market Challenges: Varying tire compound formulations and manufacturing technology differences may limit system standardization across different production facilities or regional specifications.
Application dynamics include:
Oral care applications capture approximately 15.0% market share through specialized abrasive requirements in toothpaste formulations, whitening systems, and premium dental care products. These applications demand precise particle morphology capable of delivering effective cleaning and whitening while ensuring enamel safety and consumer health standards.
Coatings & inks applications account for approximately 10.0% market share, including matting agents, rheology modifiers, and anti-settling additives requiring silica functionality for industrial coatings, printing inks, and decorative finishes across diverse manufacturing applications.
Growth Accelerators: Automotive electrification and environmental regulations drive primary adoption as precipitated silica enables fuel-efficient tire technology that reduces rolling resistance by 15-20% without compromising safety performance, supporting vehicle manufacturers in meeting increasingly stringent emissions standards and consumer demand for sustainable transportation solutions. Green-tire manufacturing expansion accelerates market growth as tire producers worldwide seek advanced silica-silane coupling systems that optimize fuel efficiency while maintaining wet grip characteristics essential for passenger and commercial vehicle safety requirements. Oral care market premiumization creates sustained demand for specialty silica grades with precise abrasive properties that enable whitening efficacy and enamel protection, appealing to health-conscious consumers seeking advanced dental hygiene solutions through premium toothpaste formulations and electric toothbrush-compatible products.
Growth Inhibitors: Production cost pressures persist due to energy-intensive manufacturing processes required for sodium silicate production and precipitation control, particularly affecting profitability in regions with high electricity costs or limited access to cost-effective raw materials like sand and sodium carbonate. Raw material availability challenges vary across geographic markets regarding sodium silicate sourcing and quality consistency, which may limit production capacity expansion and operational flexibility in emerging manufacturing regions lacking established chemical infrastructure. Technical complexity in application development creates barriers for new entrants and specialty grade producers requiring extensive formulation expertise, particularly in sophisticated tire compound optimization and premium oral care applications where particle morphology control and surface chemistry modification demand significant research investment and technical support capabilities.
Market Evolution Patterns: Adoption accelerates in automotive and personal care sectors where environmental regulations and consumer health awareness justify premium silica costs, with geographic concentration in Asia-Pacific markets transitioning toward mainstream adoption in developed economies driven by sustainability initiatives and regulatory compliance requirements. Technology development focuses on sustainable production methods, including rice-husk-derived silica and biomass utilization that reduce environmental footprint and enable circular economy positioning for environmentally-conscious manufacturers. The market could face disruption if alternative tire reinforcement technologies or synthetic silica substitutes significantly challenge precipitated silica's cost-performance advantages in high-volume automotive applications, though current technical superiority in green-tire formulations provides substantial competitive protection.
The Precipitated Silica market demonstrates varied regional dynamics with Growth Leaders including India (7.0% CAGR) and China (6.2% CAGR) driving expansion through automotive manufacturing scaling and oral care market development. Steady Performers encompass Indonesia (6.0% CAGR), Brazil (4.1% CAGR), and the United States (3.1% CAGR), benefiting from established tire manufacturing industries and growing personal care sectors. Mature Markets feature Germany (2.8% CAGR) and Japan (3.0% CAGR), where premium automotive applications and specialty oral care formulations support consistent growth patterns.
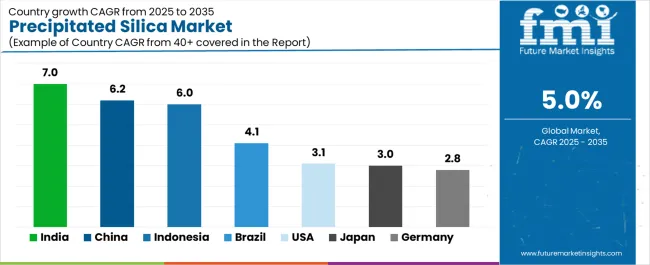
| Country | CAGR (2025-2035) |
|---|---|
| India | 7.0% |
| China | 6.25 |
| Indonesia | 6.0% |
| Brazil | 4.1% |
| United States | 3.1% |
| Germany | 2.8% |
| Japan | 3.0% |
Regional synthesis reveals Asia-Pacific markets leading adoption through automotive manufacturing expansion and tire production infrastructure development, while European countries maintain steady growth supported by environmental regulations and premium application requirements. North American markets show moderate expansion driven by replacement tire demand and specialty oral care silica adoption.
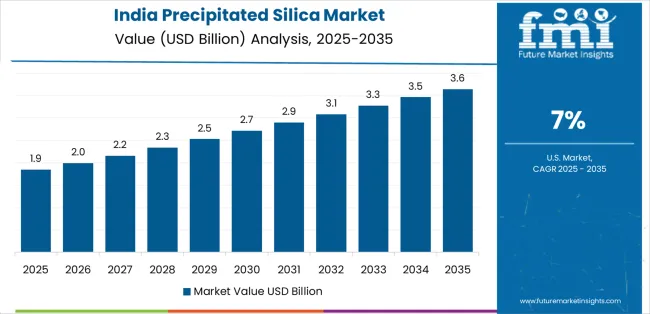
India establishes market leadership with 7.0% CAGR through aggressive green-tire capacity additions and oral-care manufacturing scale-up, integrating advanced precipitated silica as standard material in automotive tire production and personal care formulations. The country's growth reflects government initiatives promoting automotive manufacturing under "Make in India" programs and rising middle-class demand for premium oral hygiene products that mandate advanced silica grades. Expansion concentrates in major industrial centers, including Mumbai, Chennai, and Pune, where tire manufacturing facilities and oral care production plants showcase integrated silica consumption that appeals to domestic and export-oriented manufacturers seeking cost-effective production advantages and technical support capabilities.
Indian chemical manufacturers are developing localized silica production facilities that combine competitive labor costs with improving precipitation technology, including rice-husk-derived silica projects that leverage agricultural waste streams for sustainable manufacturing. Distribution channels through tire manufacturers and personal care companies expand market access, while government support for automotive electrification and oral health awareness programs supports adoption across diverse consumer and industrial segments.
Strategic Market Indicators:
In Shanghai, Guangzhou, and Changchun, automotive manufacturing facilities and tire production complexes are implementing advanced precipitated silica formulations as standard material for electric vehicle tires and fuel-efficient passenger car applications, driven by increasing government environmental regulations and tire OEM integration requirements that emphasize fuel efficiency and emissions reduction capabilities. The market achieves 6.2% CAGR, supported by substantial investments in rice-husk-derived silica projects that leverage China's agricultural waste streams for sustainable silica production while reducing manufacturing costs through innovative feedstock utilization. Chinese tire manufacturers are adopting highly dispersible silica grades that provide superior green-tire performance characteristics, particularly appealing in electric vehicle applications where rolling resistance reduction directly impacts battery range and vehicle efficiency.
Market expansion benefits from comprehensive automotive supply chain integration and government mandates promoting domestic chemical self-sufficiency that enable scaled production of advanced silica grades for tire manufacturing and industrial applications. Technology adoption follows patterns established in automotive component manufacturing, where quality consistency and cost competitiveness drive procurement decisions and operational deployment.
Market Intelligence Brief:
Indonesia's market expansion demonstrates 6.0% CAGR through new tire plant construction and agro/food packaging inks growth that increasingly incorporate precipitated silica formulations for manufacturing optimization applications. The country leverages strategic positioning within ASEAN automotive supply chains and growing consumer goods manufacturing to attract tire production investments and packaging material facilities requiring silica-based additives. Industrial centers, including Jakarta, Surabaya, and Bekasi, showcase expanding installations where silica systems integrate with tire manufacturing platforms and packaging production lines to optimize product performance and cost efficiency.
Indonesian manufacturers prioritize cost-effective silica solutions that balance technical performance with affordability considerations important to emerging market applications, while growing automotive and consumer goods industrialization creates sustained demand for conventional and specialty silica grades in manufacturing infrastructure development.
Strategic Market Considerations:
Brazil's market maintains 4.1% CAGR through pulp & paper industry applications and tire manufacturing recovery following economic stabilization periods, supported by local inks & coatings sector growth that incorporates precipitated silica for product enhancement. The country benefits from diverse industrial demand spanning automotive replacement tires, industrial coatings, and specialty paper applications that create multi-segment consumption patterns. São Paulo and Rio de Janeiro regions showcase established installations where silica systems provide functional performance across tire, coating, and paper manufacturing operations.
Market dynamics emphasize cost-effective conventional silica grades that deliver reliable performance while accommodating budget constraints typical of Latin American industrial applications, though premium segments in automotive and specialty coatings show increasing adoption of advanced silica grades for differentiated product positioning.
Performance Metrics:
The USA market demonstrates 3.1% CAGR through replacement tire demand and specialty oral-care silicas emphasizing precision particle morphology and integration with advanced toothpaste formulations that manage whitening efficacy, abrasive characteristics, and consumer health requirements through regulatory-compliant systems. American tire manufacturers prioritize operational consistency with silica grades delivering reliable green-tire performance through proven formulation stability and technical support capabilities. Technology deployment channels include major tire producers, oral care companies, and specialty chemical distributors that support professional applications for sophisticated formulation requirements.
Manufacturing platform integration capabilities with established tire compounds and toothpaste formulations expand market appeal across diverse applications seeking performance reliability and regulatory compliance benefits, while specialty dental-grade silica serves premium oral care segments demanding superior particle control and safety documentation.
Market Intelligence Brief:
Germany demonstrates steady 2.8% CAGR through EV/lightweighting applications in tires and sealants that incorporate advanced precipitated silica for enhanced performance characteristics in premium automotive applications. The country leverages engineering expertise in automotive materials and chemical formulation technology to maintain technical leadership in specialty silica applications. Industrial centers, including Stuttgart, Munich, and Frankfurt, showcase premium installations where silica systems integrate with electric vehicle tire compounds and automotive sealant formulations to optimize fuel efficiency and vehicle performance.
German chemical companies prioritize EU regulatory compliance and environmental sustainability in silica production, creating demand for advanced grades with reduced carbon footprint and comprehensive technical documentation supporting automotive and industrial applications.
Japan demonstrates steady 3.0% CAGR, distinguished by premium oral-care applications and electronics-grade silica uses that integrate with sophisticated consumer products and advanced industrial applications. The market prioritizes high-purity silica systems providing exceptional quality control, particle uniformity, and application-specific performance characteristics that reflect Japanese industry expectations for technological sophistication and operational excellence.
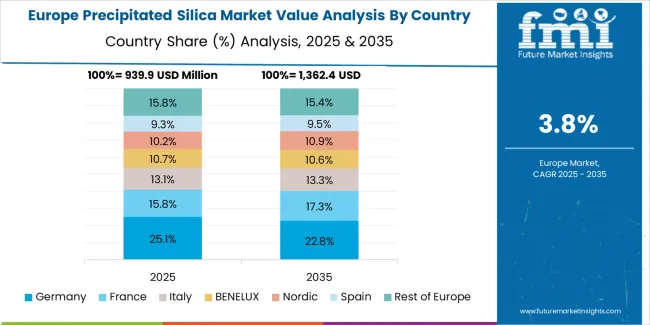
Western Europe accounts for the largest regional demand for precipitated silica in Europe, led by Germany (about 23% of European consumption) on the back of premium tire and automotive sealant compounds, followed by France (about 15%) with strong tires/coatings demand and an active circular-silica push; the United Kingdom (about 13%) reflects steady oral-care and replacement-tire consumption. Italy (about 12%) balances tires, sealants and inks applications, while Spain (about 10%) emphasizes coatings/inks and automotive component manufacturing. The Nordics (about 9% combined, led by Sweden and Finland) skew toward high-specification tires and forest-industry coatings; Benelux (about 8%) is supported by chemicals logistics infrastructure and converter networks. The remaining approximately 10% is spread across Central & Eastern Europe (notably Poland, Czechia, and Hungary) where green-tire investments and automotive component manufacturing continue to lift precipitated silica consumption through expanding production facilities.
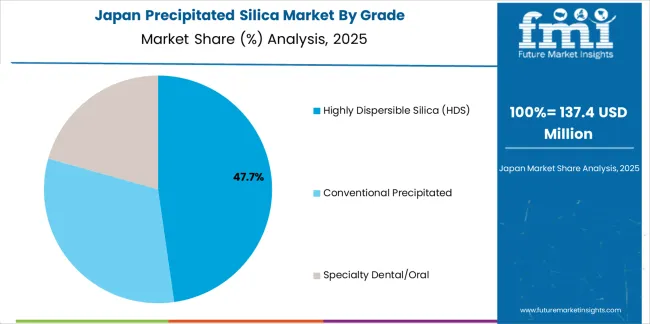
In Japan, the Precipitated Silica market prioritizes highly dispersible silica systems, which capture the dominant share of tire manufacturing and automotive applications due to their advanced features, including superior fuel efficiency optimization and seamless integration with premium tire compound formulations. Japanese tire manufacturers emphasize quality excellence, environmental performance, and long-term durability standards, creating demand for highly dispersible silica grades that provide consistent rolling resistance reduction and adaptive compound performance based on vehicle requirements and driving conditions. Specialty dental-grade silica maintains secondary position primarily in premium oral care applications where particle morphology control and purity standards meet stringent consumer health requirements.
Market Characteristics:
In South Korea, the market structure favors international chemical companies, including Evonik Industries AG, Solvay, and Tokuyama Corporation, which maintain dominant positions through comprehensive product portfolios and established automotive industry networks supporting tire manufacturing and industrial applications. These providers offer integrated solutions combining advanced silica grades with technical application support and quality assurance services that appeal to Korean tire manufacturers and industrial customers seeking reliable chemical supply partnerships. Local chemical distributors and specialty suppliers capture moderate market share by providing localized service capabilities and competitive pricing for conventional silica grades, while domestic manufacturers focus on cost-effective solutions tailored to regional industrial characteristics and application requirements.
Channel Insights:
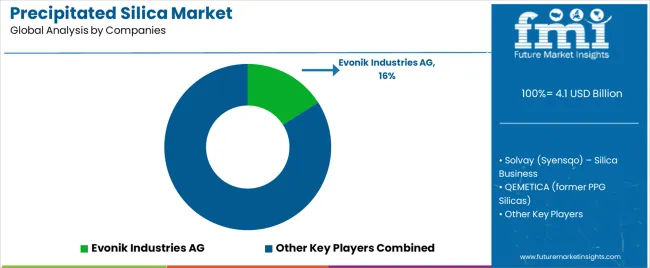
The Precipitated Silica market operates with moderate concentration, featuring approximately 15-20 meaningful participants, where leading companies control roughly 45-50% of the global market share through established automotive industry relationships and comprehensive chemical portfolios. Competition emphasizes advanced precipitation technology capabilities, application technical support, and sustainable production practices rather than price-based rivalry.
Market Leaders encompass Evonik Industries AG (16.0% market share), Solvay (Syensqo), and QEMETICA (former PPG Silicas), which maintain competitive advantages through extensive automotive and oral care industry expertise, global production networks, and comprehensive technical support capabilities that create customer loyalty and support premium positioning. These companies leverage decades of silica technology experience and ongoing research investments to develop advanced grades with optimized particle characteristics and sustainability credentials. Evonik announced significant capacity expansion at Charleston, South Carolina, with mid-double-digit million-euro investment to lift production by approximately 50% for green-tire demand, while PPG completed the sale of its silicas business to QEMETICA for approximately USD 310 million in November 2024.
Technology Innovators include Quechen Silicon Chemical, which announced a 100,000 metric tons per annum rice-silica project in Jiangsu, China, with completion targeted in approximately 24 months, demonstrating competitive differentiation through sustainable feedstock innovation and cost-competitive production technology that appeals to environmentally-conscious manufacturers seeking circular economy solutions.
Regional Specialists feature companies like Madhu Silica Pvt. Ltd., Tokuyama Corporation, Tosoh Silica Corporation, and Oriental Silica Corporation, which focus on specific geographic markets and specialized applications, including dental-grade silica and conventional precipitated grades. Market dynamics favor participants that combine reliable production quality with advanced application development capabilities, including green-tire compound optimization and premium oral care formulation support. Competitive pressure intensifies as traditional chemical companies expand precipitated silica portfolios while specialty Asian producers challenge established players through cost-competitive manufacturing and localized technical service targeting automotive and industrial segments in high-growth emerging markets.
| Item | Value |
|---|---|
| Quantitative Units | USD 4.1 billion |
| Grade | Highly Dispersible Silica (HDS), Conventional Precipitated, Specialty Dental/Oral |
| Application | Tires & Rubber, Oral Care, Coatings & Inks, Adhesives & Sealants, Food/Feed & Others |
| End-use Industry | Automotive, Personal Care & Oral, Industrial & Chemicals, Agriculture, Others |
| Regions Covered | Asia-Pacific, Europe, North America, Latin America, Middle East & Africa |
| Countries Covered | India, China, Indonesia, Brazil, United States, Germany, Japan, and 25+ additional countries |
| Key Companies Profiled | Evonik Industries AG, Solvay (Syensqo), QEMETICA, Quechen Silicon Chemical, Madhu Silica Pvt. Ltd., Huber Engineered Materials, W. R. Grace & Co., Tokuyama Corporation |
| Additional Attributes | Dollar sales by grade, application, and end-use industry categories, regional adoption trends across Asia-Pacific, Europe, and North America, competitive landscape with chemical manufacturers and specialty producers, automotive and oral care industry preferences for fuel efficiency optimization and abrasive characteristics, integration with green-tire technology and premium toothpaste formulations, innovations in sustainable rice-husk-derived silica and biomass utilization, and development of specialty grades with enhanced dispersion properties and application-specific performance optimization capabilities. |
The global precipitated silica market is estimated to be valued at USD 4.1 billion in 2025.
The market size for the precipitated silica market is projected to reach USD 6.7 billion by 2035.
The precipitated silica market is expected to grow at a 5.0% CAGR between 2025 and 2035.
The key product types in precipitated silica market are highly dispersible silica (hds), conventional precipitated and specialty dental/oral.
In terms of application, tires & rubber segment to command 57.0% share in the precipitated silica market in 2025.


Full Research Suite comprises of:
Market outlook & trends analysis
Interviews & case studies
Strategic recommendations
Vendor profiles & capabilities analysis
5-year forecasts
8 regions and 60+ country-level data splits
Market segment data splits
12 months of continuous data updates
DELIVERED AS:
PDF EXCEL ONLINE
Precipitated Barium Sulphate Market Growth – Trends & Forecast 2025 to 2035
Nano Precipitated Calcium Carbonate Market Size and Share Forecast Outlook 2025 to 2035
Ground and Precipitated Calcium Carbonate Market Size and Share Forecast Outlook 2025 to 2035
USA Ground and Precipitated Calcium Carbonate Market Growth by Product Type, Application, End-Use, and Region in 2025 to 2035
Silica Sand for Glass Making Market Size and Share Forecast Outlook 2025 to 2035
Silica Flour Market Size and Share Forecast Outlook 2025 to 2035
Silica Coated Film Market Analysis Size, Share, and Forecast Outlook 2025 to 2035
Silica for S-SBR Market Size & Trends 2025 to 2035
Silica Analyzers Market
Borosilicate Glass Market Trends & Outlook 2025 to 2035
High-Silica Zeolite Market Size and Share Forecast Outlook 2025 to 2035
High-Silica Fiber Market Analysis by Application, Use Case, and Region: Forecast for 2025 to 2035
Fumed Silica Market
Europe Silica Sand for Glass Making Market Analysis for 2025 to 2035
Sodium Silicate Market Growth – Trends & Forecast 2022 to 2032
Calcium Silicate Insulation Market Size and Share Forecast Outlook 2025 to 2035
Calcium Silicate Market
Specialty Silica Market Size and Share Forecast Outlook 2025 to 2035
Pyrogenic Silica Market Report - Demand, Growth & Industry Outlook 2025 to 2035
Colloidal Silica Market Demand & Trends 2025 to 2035

Thank you!
You will receive an email from our Business Development Manager. Please be sure to check your SPAM/JUNK folder too.
Chat With
MaRIA