Network Sandboxing Market Outlook (2022 to 2032)

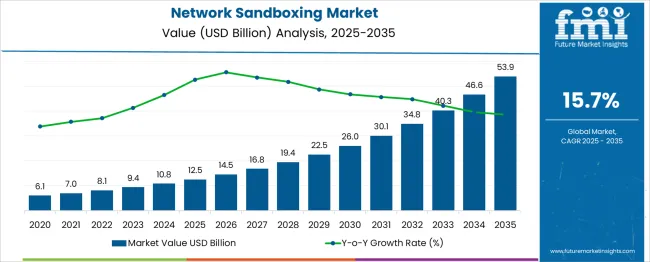
The network sandboxing market revenue totaled USD 7.1 Billion in 2021. The total network sandboxing market size is expected to reach USD 34.9 Billion by 2032, growing at a CAGR of 15.7% over the forecast period.

Attribute Details
Network Sandboxing Market Estimated Value (2022) USD 8.1 Billion
Projected Market Size (2032) USD 34.9 Billion
Value-based CAGR% (2022 to 2032) 15.7%
Top 5 Vendor Market Share Around 30%

Network sandboxing market accounted for around 7% of global network security market. Network-based sandboxing or sandboxing is a technique that enables security teams to detect and block suspicious malware and targeted attacks.

The adoption of network sandboxing software, sandbox gateway appliances, and sandbox-based appliances is rising owing to growing incidence of cyber-attacks across large enterprises. Network sandboxing solutions provide an additional defense layer against unknown attacks on enterprise networks.

2017 to 2021 Network Sandboxing Demand Outlook Compared to 2022 to 2032 Forecast

The network sandboxing market is estimated to rise at a 15.7% CAGR between 2022 and 2032 in comparison with 13.4% CAGR registered during 2017 to 2021. This attributes to growing adoption of advanced threat protection and sandbox security among large as well as small and mid-sized enterprises (SMEs) across the globe.

North America is expected to dominate the global network sandboxing market, reaching USD 9.1 Million by 2032. As per Forgerock, in 2018, approximately 2.8 Billion customers’ data was exposed by hackers, valuing around USD 654 Million.

Network security sandbox is a technique used for detecting targeted and malware attacks. It analyzes malware severity ratings and probability scores by monitoring network traffic for suspicious elements.

Growing Adoption of Connective Technology Will Fuel Sales of Network Sandboxing Solutions

Rising adoption of advanced technologies such as Internet of Things (IoT) and Artificial Intelligence (AI) among various enterprises leads to generating large amounts of traffic/data. In recent years, the growth of the Internet of things (IoT) has contributed to advancements in smart cities, fog computing, and industry 4.0.

Adoption of IoT and AI enables the execution of complex data processing which has critical and confidential information and must be protected from cyber-attacks.

Sandboxing provides an additional layer of defense against unknown attack vectors. It improves security by integrating with existing products such as the next generation firewall, a secure subway, and unified threat management platforms. Hence, rising adoption of IoT and AI across various industries will propel the demand for network sandboxing solutions.

Will Increasing Sophistication in Cyber-Attacks Spur Demand?

Most enterprises need advanced security procedures and techniques to protect applications, IT infrastructure, critical data base, and business-sensitive information. However, hackers and cybercriminals across the globe are developing advanced practices to breach the critical data of enterprises. They use multistage and multi-vector attack strategies to hack the organization’s network.

Hackers have developed cyber-attacks such as DoS and DDoS attacks, man-in-the-middle (MITM) attacks, phishing attacks, ransomware, and SQL injection attacks. Therefore, a growing need for advanced security solutions to protect from high level sophisticated cyber-attacks is expected to fuel the demand for network sandboxing solutions.
Country-wise Insights

How is the Japan Network Sandboxing Market Faring?

Rising Adoption of Network Sandboxing Services in Japan Will Boost Growth

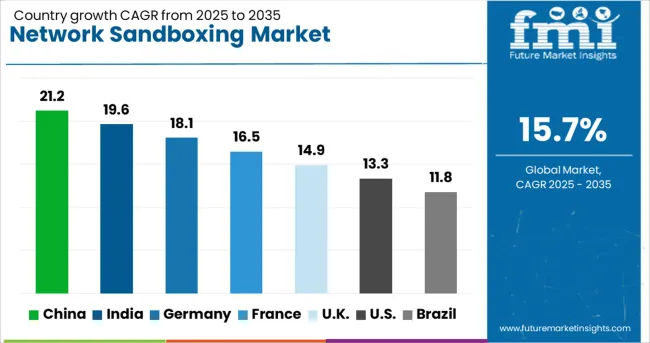
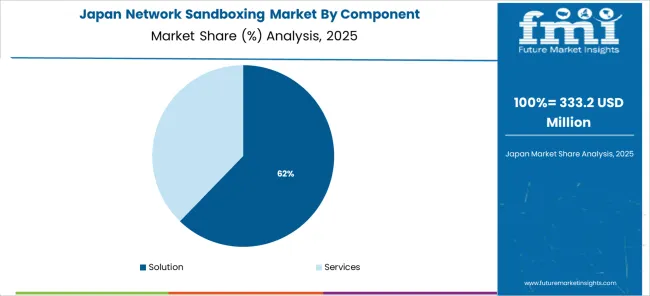
Japan is anticipated to dominate the East Asia networking sandboxing market, with sales growing at a 20.9% CAGR over the forecast period. The Japan market is anticipated to create an absolute dollar opportunity of USD 2.3 Billion during 2022 to 2032.

According to Japan’s Ministry of Economy, Trade and Industry (METI), Japan faces shortages of 220,000 IT professionals in 2018 and expected to increase to 360,000 by 2025. As a result, the adoption of network sandboxing solutions has increased across various SMEs and large enterprises in the country. Therefore, rising cyber-threat is expected to drive the demand for sandbox-based gateway appliances.

Why is the India Network Sandboxing Market Witnessing High Demand?

Growing Awareness Regarding Network Sandboxing in India Will Fuel Demand

Sales in India are projected to increase at a 19.4% CAGR, accounting for a dominant share in the South Asia network sandboxing market over the forecast period. India is anticipated to create an absolute dollar opportunity of USD 1.7 Billion over the assessment period.

In India, the demand for network sandboxing solutions has been increasing due to the growing adoption of cybersecurity solutions by various enterprises as well as government agencies in the country. Due to regulations and stringent security compliance, government initiatives and support towards the adoption of new technology, sales of virtual sandboxing solutions will continue gaining traction over the forecast period.
What is Driving the USA Network Sandboxing Market?

High Incidence of Cyber Attacks in the USA Will Propel Networking Sandboxing Sales

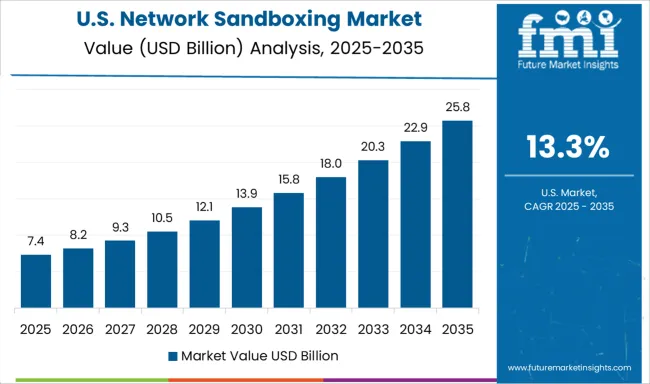
Demand in the USA is projected to increase at a 11.5% CAGR over the assessment period, with total valuation reaching USD 2.2 Billion in 2022.

The USA is a developed economy that focuses on innovations obtained from security technologies and research and development (R&D). The presence of key network sandboxing solutions and service providers including Check Point Software Technologies, Cisco Systems, FireEye, Fortinet, Juniper Networks, and Palo Alto Networks is expected to bode well for the market in the forthcoming years.

Category-wise Insights

Which Network Sandboxing Component is Most Preferred?

Demand for Network Sandboxing Solutions Will Gain Momentum

Based on components, the solutions segment will grow by 4x during the forecast period. Network sandboxing solutions help to prevent operating systems and host devices from being exposed to potential threats.

Sandboxing is a cybersecurity technique that is used to detect suspicious cyber threats to the host machine or network, possibly from untrusted or unverified third parties, users or websites, suppliers, without causing harm to the operating system or host machine. Thus, adoption of network sandboxing solutions will increase in the forthcoming years.

Which is the Leading Enterprise Size Network Sandboxing Market?

Adoption of Network Sandboxing in Large Enterprises is Rising

Based on enterprise size, the large enterprise segment will expand by 3.8X during 2022 to 2032. In recent years, sandbox-based gateway security appliances have been adopted in large enterprises as well as SMEs.

Such appliances utilize a variety of tools to block unknown, new malware with targeted attacks found in downloaded files and email attachments. Sandbox-based gateway security appliances are easy to implement. Therefore, the demand for network sandboxing solutions in large enterprises is increasing during the forecast period.

Why are Sales of Network Sandboxing Rising in the Government and Defense Segment?

Sales of Network Sandboxing Across Government Organizations Will Remain High

Based on vertical, the government and defense segment will expand by 3.2x over the forecast period. The government and defense sector is one of the main targets for cyber-attackers. Government and defense agencies need to handle sensitive and critical information. The sophistication in cyber-attacks has increased security breaches in various defense and government agencies across the globe.

Competitive Landscape

Key players in the network sandboxing market are investing heavily in innovation, research, and development practices to offer different solution for various industry applications. For improving global presence, players are also investing in mergers, acquisitions, and collaborations. For instance:

  • In April 2020, Zyxel announced a partnership with MacAfee. This partnership provides a robust one-box security solution for SMEs. ZyWALL ATP firewalls helps to provide businesses with powerful network defense against malware. It delivers secure, cloud and AI-powered business and home solutions.
  • In April 2022, Fortinet introduced FortiOS 7.2. FortiOS 7.2 upgrades it’s foundation of the Fortinet Security Fabric and flagship operating system. It delivers new advanced AI-powered FortiGuard security services.

Scope of Report

Attribute Details
Forecast Period 2022 to 2032
Historical Data Available for 2017 to 2021
Market Analysis USD Billion for Value
Key Regions Covered North America; Latin America; Europe; East Asia; South Asia & Pacific; and the Middle East & Africa
Key Countries Covered The USA, Canada, Germany, the UK, France, Italy, Spain, BENELUX, Russia, China, Japan, South Korea, India, Malaysia, Indonesia, Singapore, Australia & New Zealand, GCC Countries, Turkey, and South Africa
Key Segments Covered Component, Enterprise Size, Vertical, and Region
Key Companies Profiled Check Point Software Technologies; Cisco Systems; Fortinet; FireEye; Microsoft; Juniper Networks; Palo Alto Networks; Sophos; Symantec Corporation (Broadcom); Forcepoint; McAfee; SonicWall; Zscaler; Crowdstrike; Lastline; ContentKeeper Web Filter Pro
Report Coverage Market Forecast, Company Share Analysis, Competition Intelligence, DROT Analysis, Market Dynamics and Challenges, and Strategic Growth Initiatives

Network Sandboxing Outlook by Category

By Component:

  • Solution
    • Standalone Network Sandbox
      • Hardware
      • Cloud-based
    • Integrated Network Sandbox
      • Hardware
      • Cloud-based
  • Service
    • Professional Services
      • Consulting
      • Training and education
      • Support & Maintenance
    • Managed Services

By Enterprise Size:

  • Small and Mid-Sized Enterprises (SMEs)
  • Large Enterprises

By Vertical:

  • BFSI
  • Government and defense
  • Retail
  • Healthcare
  • IT and telecom
  • Education
  • Others

By Region:

  • North America
  • Latin America
  • Europe
  • East Asia
  • South Asia & Pacific
  • Middle East and Africa (MEA)

Table of Content

  • 1. Executive Summary
  • 2. Market Overview
  • 3. Key Market Trends
  • 4. Pricing Analysis
  • 5. Market Structure Analysis
  • 6. Global Market Demand (in Value in USD Billion) Analysis 2017 to 2021 and Forecast, 2022 to 2032
  • 7. Market Background
  • 8. Market Analysis 2017 to 2021 and Forecast 2022 to 2032, by Component
    • 8.1. Solution
      • 8.1.1. Standalone Network Sandbox
        • 8.1.1.1. Hardware
        • 8.1.1.2. Cloud-Based
      • 8.1.2. Integrated Network Sandbox
        • 8.1.2.1. Hardware
        • 8.1.2.2. Cloud-Based
    • 8.2. Services
      • 8.2.1. Professional Services
        • 8.2.1.1. Consulting
        • 8.2.1.2. Training and Education
        • 8.2.1.3. Support & Maintenance
      • 8.2.2. Managed Services
  • 9. Market Analysis 2017 to 2021 and Forecast 2022 to 2032, by Enterprise Size
    • 9.1. Small & Mid-Sized Enterprises (SMEs)
    • 9.2. Large Enterprises
  • 10. Market Analysis 2017 to 2021 and Forecast 2022 to 2032, by Vertical
    • 10.1. BFSI
    • 10.2. Government and Defense
    • 10.3. Retail
    • 10.4. Healthcare
    • 10.5. IT and Telecom
    • 10.6. Education
    • 10.7. Others
  • 11. Market Analysis 2017 to 2021 and Forecast 2022 to 2032, by Region
    • 11.1. North America
    • 11.2. Latin America
    • 11.3. Europe
    • 11.4. East Asia
    • 11.5. South Asia & Pacific
    • 11.6. Middle East and Africa (MEA)
  • 12. North America Market Analysis 2017 to 2021 and Forecast 2022 to 2032
  • 13. Latin America Market Analysis 2017 to 2021 and Forecast 2022 to 2032
  • 14. Europe Market Analysis 2017 to 2021 and Forecast 2022 to 2032
  • 15. East Asia Market Analysis 2017 to 2021 and Forecast 2022 to 2032
  • 16. South Asia & Pacific Market Analysis 2017 to 2021 and Forecast 2022 to 2032
  • 17. Middle East & Africa Market Analysis 2017 to 2021 and Forecast 2022 to 2032
  • 18. Key Countries Analysis - Market
  • 19. Competition Analysis
    • 19.1. Check Point Software Technologies Ltd.
    • 19.2. Cisco Systems
    • 19.3. Fortinet
    • 19.4. FireEye
    • 19.5. Microsoft
    • 19.6. Juniper Networks
    • 19.7. Palo Alto Networks
    • 19.8. Sophos
    • 19.9. Broadcom
    • 19.10. Forcepoint
    • 19.11. McAfee
    • 19.12. SonicWall
    • 19.13. Zscaler
    • 19.14. Crowdstrike
    • 19.15. Lastline
    • 19.16. ContentKeeper Web Filter Pro
  • 20. Assumptions and Acronyms Used
  • 21. Research Methodology

List of Tables

Table 01: Global Network Sandboxing Market Value (US$ Bn ) Analysis (2017 – 2021) by Component    

Table 02: Global Network Sandboxing Market Value (US$ Bn ) Forecast (2022 – 2032) by Component    

Table 03: Global Network Sandboxing Market Value (US$ Bn ) Analysis (2017 – 2021) by Enterprise Size

Table 04: Global Network Sandboxing Market Value (US$ Bn ) Forecast (2022 – 2032) by Enterprise Size

Table 05: Global Network Sandboxing Market Value (US$ Bn ) Analysis (2017 – 2021) by Vertical    

Table 06: Global Network Sandboxing Market Value (US$ Bn ) Forecast (2022 – 2032) by Vertical    

Table 07: Global Network Sandboxing Market Value (US$ Bn ) Analysis (2017 – 2021) by Region    

Table 08: Global Network Sandboxing Market Value (US$ Bn ) Forecast (2022 – 2032) by Region    

Table 09: North America Network Sandboxing Market Value (US$ Bn ) Analysis (2017 – 2021) by Component

Table 10: North America Network Sandboxing Market Value (US$ Bn ) Forecast (2022 – 2032) by Component

Table 11: North America Network Sandboxing Market Value (US$ Bn ) Analysis (2017 – 2021) by Enterprise Size

Table 12: North America Network Sandboxing Market Value (US$ Bn ) Forecast (2022 – 2032) by Enterprise Size

Table 13: North America Network Sandboxing Market Value (US$ Bn ) Analysis (2017 – 2021) by Vertical

Table 14: North America Network Sandboxing Market Value (US$ Bn ) Forecast (2022 – 2032) by Vertical

Table 15: North America Network Sandboxing Market Value (US$ Bn ) Analysis (2017 – 2021) by Country

Table 16: North America Network Sandboxing Market Value (US$ Bn ) Forecast (2022 – 2032) by Country

Table 17: Latin America Network Sandboxing Market Value (US$ Bn ) Analysis (2017 – 2021) by Component

Table 18: Latin America Network Sandboxing Market Value (US$ Bn ) Forecast (2022 – 2032) by Component

Table 19: Latin America Network Sandboxing Market Value (US$ Bn ) Analysis (2017 – 2021) by Enterprise Size

Table 20: Latin America Network Sandboxing Market Value (US$ Bn ) Forecast (2022 – 2032) by Enterprise Size

Table 21: Latin America Network Sandboxing Market Value (US$ Bn ) Analysis (2017 – 2021) by Vertical

Table 22: Latin America Network Sandboxing Market Value (US$ Bn ) Forecast (2022 – 2032) by Vertical

Table 23: Latin America Network Sandboxing Market Value (US$ Bn ) Analysis (2017 – 2021) by Country

Table 24: Latin America Network Sandboxing Market Value (US$ Bn ) Forecast (2022 – 2032) by Country

Table 25: Europe Network Sandboxing Market Value (US$ Bn ) Analysis (2017 – 2021) by Component    

Table 26: Europe Network Sandboxing Market Value (US$ Bn ) Forecast (2022 – 2032) by Component

Table 27: Europe Network Sandboxing Market Value (US$ Bn ) Analysis (2017 – 2021) by Enterprise Size

Table 28: Europe Network Sandboxing Market Value (US$ Bn ) Forecast (2022 – 2032) by Enterprise Size

Table 29: Europe Network Sandboxing Market Value (US$ Bn ) Analysis (2017 – 2021) by Vertical    

Table 30: Europe Network Sandboxing Market Value (US$ Bn ) Forecast (2022 – 2032) by Vertical    

Table 31: Europe Network Sandboxing Market Value (US$ Bn ) Analysis (2017 – 2021) by Country    

Table 32: Italy Network Sandboxing Market Value (US$ Bn ) Analysis (2017 – 2021) by Enterprise Size

Table 33: Europe Network Sandboxing Market Value (US$ Bn ) Forecast (2022 – 2032) by Country    

Table 34: East Asia Network Sandboxing Market Value (US$ Bn ) Analysis (2017 – 2021) by Component

Table 35: East Asia Network Sandboxing Market Value (US$ Bn ) Forecast (2022 – 2032) by Component

Table 36: East Asia Network Sandboxing Market Value (US$ Bn ) Analysis (2017 – 2021) by Enterprise Size

Table 37: East Asia Network Sandboxing Market Value (US$ Bn ) Forecast (2022 – 2032) by Enterprise Size

Table 38: East Asia Network Sandboxing Market Value (US$ Bn ) Analysis (2017 – 2021) by Vertical    

Table 39: East Asia Network Sandboxing Market Value (US$ Bn ) Forecast (2022 – 2032) by Vertical    

Table 40: East Asia Network Sandboxing Market Value (US$ Bn ) Analysis (2017 – 2021) by Country    

Table 41: East Asia Network Sandboxing Market Value (US$ Bn ) Forecast (2022 – 2032) by Country    

Table 42: South Asia & Pacific Network Sandboxing Market Value (US$ Bn ) Analysis (2017 – 2021) by Component

Table 43: South Asia & Pacific Network Sandboxing Market Value (US$ Bn ) Forecast (2022 – 2032) by Component

Table 44: South Asia & Pacific Network Sandboxing Market Value (US$ Bn ) Analysis (2017 – 2021) by Enterprise Size

Table 45: South Asia & Pacific Network Sandboxing Market Value (US$ Bn ) Forecast (2022 – 2032) by Enterprise Size

Table 46: South Asia & Pacific Network Sandboxing Market Value (US$ Bn ) Analysis (2017 – 2021) by Vertical

Table 47: South Asia & Pacific Network Sandboxing Market Value (US$ Bn ) Forecast (2022 – 2032) by Vertical

Table 48: South Asia & Pacific Network Sandboxing Market Value (US$ Bn ) Analysis (2017 – 2021) by Country

Table 49: South Asia & Pacific Network Sandboxing Market Value (US$ Bn ) Forecast (2022 – 2032) by Country

Table 50: Middle East & Africa Network Sandboxing Market Value (US$ Bn ) Analysis (2017 – 2021) by Component

Table 51: Middle East & Africa Network Sandboxing Market Value (US$ Bn ) Forecast (2022 – 2032) by Component

Table 52: Middle East & Africa Network Sandboxing Market Value (US$ Bn ) Analysis (2017 – 2021) by Enterprise Size

Table 53: Middle East & Africa Network Sandboxing Market Value (US$ Bn ) Forecast (2022 – 2032) by Enterprise Size

Table 54: Mexico Network Sandboxing Market Value (US$ Bn ) Forecast (2022 – 2032) by Component

Table 55: Middle East & Africa Network Sandboxing Market Value (US$ Bn ) Analysis (2017 – 2021) by Vertical

Table 56: Middle East & Africa Network Sandboxing Market Value (US$ Bn ) Forecast (2022 – 2032) by Vertical

Table 57: Middle East & Africa Network Sandboxing Market Value (US$ Bn ) Analysis (2017 – 2021) by Country

Table 58: Middle East & Africa Network Sandboxing Market Value (US$ Bn ) Forecast (2022 – 2032) by Country

Table 59: U.S. Network Sandboxing Market Value (US$ Bn ) Analysis (2017 – 2021) by Component    

Table 60: U.S. Network Sandboxing Market Value (US$ Bn ) Forecast (2022 – 2032) by Component    

Table 61: U.S. Network Sandboxing Market Value (US$ Bn ) Analysis (2017 – 2021) by Enterprise Size    

Table 62: U.S. Network Sandboxing Market Value (US$ Bn ) Forecast (2022 – 2032) by Enterprise Size    

Table 63: U.S. Network Sandboxing Market Value (US$ Bn ) Analysis (2017 – 2021) by Vertical    

Table 64: U.S. Network Sandboxing Market Value (US$ Bn ) Forecast (2022 – 2032) by Vertical    

Table 65: Canada Network Sandboxing Market Value (US$ Bn ) Analysis (2017 – 2021) by Component

Table 66: Canada Network Sandboxing Market Value (US$ Bn ) Forecast (2022 – 2032) by Component

Table 67: Canada Network Sandboxing Market Value (US$ Bn ) Analysis (2017 – 2021) by Enterprise Size

Table 68: Canada Network Sandboxing Market Value (US$ Bn ) Forecast (2022 – 2032) by Enterprise Size

Table 69: Canada Network Sandboxing Market Value (US$ Bn ) Analysis (2017 – 2021) by Vertical     

Table 70: Canada Network Sandboxing Market Value (US$ Bn ) Forecast (2022 – 2032) by Vertical    

Table 71: Brazil Network Sandboxing Market Value (US$ Bn ) Analysis (2017 – 2021) by Component    

Table 72: Brazil Network Sandboxing Market Value (US$ Bn ) Forecast (2022 – 2032) by Component    

Table 73: Brazil Network Sandboxing Market Value (US$ Bn ) Analysis (2017 – 2021) by Enterprise Size

Table 74: Brazil Network Sandboxing Market Value (US$ Bn ) Forecast (2022 – 2032) by Enterprise Size

Table 75: Brazil Network Sandboxing Market Value (US$ Bn ) Analysis (2017 – 2021) by Vertical     

Table 76: Brazil Network Sandboxing Market Value (US$ Bn ) Forecast (2022 – 2032) by Vertical    

Table 77: Mexico Network Sandboxing Market Value (US$ Bn ) Analysis (2017 – 2021) by Component

Table 78: Mexico Network Sandboxing Market Value (US$ Bn ) Analysis (2017 – 2021) by Enterprise Size

Table 79: Mexico Network Sandboxing Market Value (US$ Bn ) Forecast (2022 – 2032) by Enterprise Size

Table 80: Mexico Network Sandboxing Market Value (US$ Bn ) Analysis (2017 – 2021) by Vertical     

Table 81: Mexico Network Sandboxing Market Value (US$ Bn ) Forecast (2022 – 2032) by Vertical    

Table 82: Rest of Latin America Network Sandboxing Market Value (US$ Bn ) Analysis (2017 – 2021) by Component

Table 83: Rest of Latin America Network Sandboxing Market Value (US$ Bn ) Forecast (2022 – 2032) by Component

Table 84: Rest of Latin America Network Sandboxing Market Value (US$ Bn ) Analysis (2017 – 2021) by Enterprise Size

Table 85: Rest of Latin America Network Sandboxing Market Value (US$ Bn ) Forecast (2022 – 2032) by Enterprise Size

Table 86: Rest of Latin America Network Sandboxing Market Value (US$ Bn ) Analysis (2017 – 2021) by Vertical 

Table 87: Rest of Latin America Network Sandboxing Market Value (US$ Bn ) Forecast (2022 – 2032) by Vertical

Table 88: UK Network Sandboxing Market Value (US$ Bn ) Analysis (2017 – 2021) by Component    

Table 89: UK Network Sandboxing Market Value (US$ Bn ) Forecast (2022 – 2032) by Component    

Table 90: UK Network Sandboxing Market Value (US$ Bn ) Analysis (2017 – 2021) by Enterprise Size    

Table 91: UK Network Sandboxing Market Value (US$ Bn ) Forecast (2022 – 2032) by Enterprise Size    

Table 92: UK Network Sandboxing Market Value (US$ Bn ) Analysis (2017 – 2021) by Vertical    

Table 93: UK Network Sandboxing Market Value (US$ Bn ) Forecast (2022 – 2032) by Vertical    

Table 94: Germany Network Sandboxing Market Value (US$ Bn ) Analysis (2017 – 2021) by Component

Table 95: Germany Network Sandboxing Market Value (US$ Bn ) Forecast (2022 – 2032) by Component

Table 96: Germany Network Sandboxing Market Value (US$ Bn ) Analysis (2017 – 2021) by Enterprise Size

Table 97: Germany Network Sandboxing Market Value (US$ Bn ) Forecast (2022 – 2032) by Enterprise Size

Table 98: Germany Network Sandboxing Market Value (US$ Bn ) Analysis (2017 – 2021) by Vertical    

Table 99: Germany Network Sandboxing Market Value (US$ Bn ) Forecast (2022 – 2032) by Vertical    

Table 100: France Network Sandboxing Market Value (US$ Bn ) Analysis (2017 – 2021) by Component

Table 101: France Network Sandboxing Market Value (US$ Bn ) Forecast (2022 – 2032) by Component

Table 102: France Network Sandboxing Market Value (US$ Bn ) Analysis (2017 – 2021) by Enterprise Size

Table 103: France Network Sandboxing Market Value (US$ Bn ) Forecast (2022 – 2032) by Enterprise Size

Table 104: France Network Sandboxing Market Value (US$ Bn ) Analysis (2017 – 2021) by Vertical    

Table 105: France Network Sandboxing Market Value (US$ Bn ) Forecast (2022 – 2032) by Vertical    

Table 106: Italy Network Sandboxing Market Value (US$ Bn ) Analysis (2017 – 2021) by Component    

Table 107: Italy Network Sandboxing Market Value (US$ Bn ) Forecast (2022 – 2032) by Component    

Table 108: Italy Network Sandboxing Market Value (US$ Bn ) Forecast (2022 – 2032) by Enterprise Size

Table 109: Italy Network Sandboxing Market Value (US$ Bn ) Analysis (2017 – 2021) by Vertical    

Table 110: Italy Network Sandboxing Market Value (US$ Bn ) Forecast (2022 – 2032) by Vertical    

Table 111: Spain Network Sandboxing Market Value (US$ Bn ) Analysis (2017 – 2021) by Component    

Table 112: Spain Network Sandboxing Market Value (US$ Bn ) Forecast (2022 – 2032) by Component    

Table 113: Spain Network Sandboxing Market Value (US$ Bn ) Analysis (2017 – 2021) by Enterprise Size

Table 114: Spain Network Sandboxing Market Value (US$ Bn ) Forecast (2022 – 2032) by Enterprise Size

Table 115: Spain Network Sandboxing Market Value (US$ Bn ) Analysis (2017 – 2021) by Vertical    

Table 116: Spain Network Sandboxing Market Value (US$ Bn ) Forecast (2022 – 2032) by Vertical    

Table 117: Benelux Network Sandboxing Market Value (US$ Bn ) Analysis (2017 – 2021) by Component

Table 118: Benelux Network Sandboxing Market Value (US$ Bn ) Forecast (2022 – 2032) by Component

Table 119: Benelux Network Sandboxing Market Value (US$ Bn ) Analysis (2017 – 2021) by Enterprise Size

Table 120: Benelux Network Sandboxing Market Value (US$ Bn ) Forecast (2022 – 2032) by Enterprise Size

Table 121: Benelux U.S. Network Sandboxing Market Value (US$ Bn ) Analysis (2017 – 2021) by Vertical

Table 122: Benelux Network Sandboxing Market Value (US$ Bn ) Forecast (2022 – 2032) by Vertical    

Table 123: Russia Network Sandboxing Market Value (US$ Bn ) Analysis (2017 – 2021) by Component

Table 124: Russia Network Sandboxing Market Value (US$ Bn ) Forecast (2022 – 2032) by Component

Table 125: Russia Network Sandboxing Market Value (US$ Bn ) Analysis (2017 – 2021) by Enterprise Size

Table 126: Russia Network Sandboxing Market Value (US$ Bn ) Forecast (2022 – 2032) by Enterprise Size

Table 127: Russia Network Sandboxing Market Value (US$ Bn ) Analysis (2017 – 2021) by Vertical    

Table 128: Russia Network Sandboxing Market Value (US$ Bn ) Forecast (2022 – 2032) by Vertical    

Table 129: Rest of Europe Network Sandboxing Market Value (US$ Bn ) Analysis (2017 – 2021) by Component

Table 130: Rest of Europe Network Sandboxing Market Value (US$ Bn ) Forecast (2022 – 2032) by Component

Table 131: Rest of Europe Network Sandboxing Market Value (US$ Bn ) Analysis (2017 – 2021) by Enterprise Size

Table 132: Rest of Europe Network Sandboxing Market Value (US$ Bn ) Forecast (2022 – 2032) by Enterprise Size

Table 133: Rest of Europe Network Sandboxing Market Value (US$ Bn ) Analysis (2017 – 2021) by Vertical

Table 134: Rest of Europe Network Sandboxing Market Value (US$ Bn ) Forecast (2022 – 2032) by Vertical

Table 135: China Network Sandboxing Market Value (US$ Bn ) Analysis (2017 – 2021) by Component    

Table 136: China Network Sandboxing Market Value (US$ Bn ) Forecast (2022 – 2032) by Component    

Table 137: China Network Sandboxing Market Value (US$ Bn ) Analysis (2017 – 2021) by Enterprise Size

Table 138: China Network Sandboxing Market Value (US$ Bn ) Forecast (2022 – 2032) by Enterprise Size

Table 139: China Network Sandboxing Market Value (US$ Bn ) Analysis (2017 – 2021) by Vertical    

Table 140: China Network Sandboxing Market Value (US$ Bn ) Forecast (2022 – 2032) by Vertical    

Table 141: Japan Network Sandboxing Market Value (US$ Bn ) Analysis (2017 – 2021) by Component    

Table 142: Japan Network Sandboxing Market Value (US$ Bn ) Forecast (2022 – 2032) by Component    

Table 143: Japan Network Sandboxing Market Value (US$ Bn ) Analysis (2017 – 2021) by Enterprise Size

Table 144: Japan Network Sandboxing Market Value (US$ Bn ) Forecast (2022 – 2032) by Enterprise Size

Table 145: Japan Network Sandboxing Market Value (US$ Bn ) Analysis (2017 – 2021) by Vertical    

Table 146: Japan Network Sandboxing Market Value (US$ Bn ) Forecast (2022 – 2032) by Vertical    

Table 147: South Korea Network Sandboxing Market Value (US$ Bn ) Analysis (2017 – 2021) by Component

Table 148: South Korea Network Sandboxing Market Value (US$ Bn ) Forecast (2022 – 2032) by Component

Table 149: South Korea Network Sandboxing Market Value (US$ Bn ) Analysis (2017 – 2021) by Enterprise Size

Table 150: South Korea Network Sandboxing Market Value (US$ Bn ) Forecast (2022 – 2032) by Enterprise Size

Table 151: South Korea Network Sandboxing Market Value (US$ Bn ) Analysis (2017 – 2021) by Vertical

Table 152: South Korea Network Sandboxing Market Value (US$ Bn ) Forecast (2022 – 2032) by Vertical

Table 153: India Network Sandboxing Market Value (US$ Bn ) Analysis (2017 – 2021) by Component    

Table 154: India Network Sandboxing Market Value (US$ Bn ) Forecast (2022 – 2032) by Component    

Table 155: India Network Sandboxing Market Value (US$ Bn ) Analysis (2017 – 2021) by Enterprise Size

Table 156: India Network Sandboxing Market Value (US$ Bn ) Forecast (2022 – 2032) by Enterprise Size

Table 157: India Network Sandboxing Market Value (US$ Bn ) Analysis (2017 – 2021) by Vertical    

Table 158: India Network Sandboxing Market Value (US$ Bn ) Forecast (2022 – 2032) by Vertical    

Table 159: Thailand Network Sandboxing Market Value (US$ Bn ) Analysis (2017 – 2021) by Component

Table 160: Thailand Network Sandboxing Market Value (US$ Bn ) Forecast (2022 – 2032) by Component

Table 161: Thailand Network Sandboxing Market Value (US$ Bn ) Analysis (2017 – 2021) by Enterprise Size

Table 162: Thailand Network Sandboxing Market Value (US$ Bn ) Forecast (2022 – 2032) by Enterprise Size

Table 163: Thailand Network Sandboxing Market Value (US$ Bn ) Analysis (2017 – 2021) by Vertical    

Table 164: Thailand Network Sandboxing Market Value (US$ Bn ) Forecast (2022 – 2032) by Vertical    

Table 165: Indonesia Network Sandboxing Market Value (US$ Bn ) Analysis (2017 – 2021) by Component

Table 166: Indonesia Network Sandboxing Market Value (US$ Bn ) Forecast (2022 – 2032) by Component

Table 167: Indonesia Network Sandboxing Market Value (US$ Bn ) Analysis (2017 – 2021) by Enterprise Size

Table 168: Indonesia Network Sandboxing Market Value (US$ Bn ) Forecast (2022 – 2032) by Enterprise Size

Table 169: Indonesia Network Sandboxing Market Value (US$ Bn ) Analysis (2017 – 2021) by Vertical

Table 170: Indonesia Network Sandboxing Market Value (US$ Bn ) Forecast (2022 – 2032) by Vertical

Table 171: Malaysia Network Sandboxing Market Value (US$ Bn ) Analysis (2017 – 2021) by Component

Table 172: Malaysia Network Sandboxing Market Value (US$ Bn ) Forecast (2022 – 2032) by Component

Table 173: Malaysia Network Sandboxing Market Value (US$ Bn ) Analysis (2017 – 2021) by Enterprise Size

Table 174: Malaysia Network Sandboxing Market Value (US$ Bn ) Forecast (2022 – 2032) by Enterprise Size

Table 175: Malaysia Network Sandboxing Market Value (US$ Bn ) Analysis (2017 – 2021) by Vertical    

Table 176: Malaysia Network Sandboxing Market Value (US$ Bn ) Forecast (2022 – 2032) by Vertical    

Table 177: Australia & New Zealand Network Sandboxing Market Value (US$ Bn ) Analysis (2017 – 2021) by Component

Table 178: Australia & New Zealand Network Sandboxing Market Value (US$ Bn ) Forecast (2022 – 2032) by Component

Table 179: Australia & New Zealand Network Sandboxing Market Value (US$ Bn ) Analysis (2017 – 2021) by Enterprise Size

Table 180: Australia & New Zealand Network Sandboxing Market Value (US$ Bn ) Forecast (2022 – 2032) by Enterprise Size

Table 181: Australia & New Zealand Network Sandboxing Market Value (US$ Bn ) Analysis (2017 – 2021) by Vertical

Table 182: Australia & New Zealand Network Sandboxing Market Value (US$ Bn ) Forecast (2022 – 2032) by Vertical

Table 183: Rest of SAP Network Sandboxing Market Value (US$ Bn ) Analysis (2017 – 2021) by Component

Table 184: Rest of SAP Network Sandboxing Market Value (US$ Bn ) Forecast (2022 – 2032) by Component

Table 185: Rest of SAP Network Sandboxing Market Value (US$ Bn ) Analysis (2017 – 2021) by Enterprise Size

Table 186: Rest of SAP Network Sandboxing Market Value (US$ Bn ) Forecast (2022 – 2032) by Enterprise Size

Table 187: Rest of SAP Network Sandboxing Market Value (US$ Bn ) Analysis (2017 – 2021) by Vertical

Table 188: Rest of SAP Network Sandboxing Market Value (US$ Bn ) Forecast (2022 – 2032) by Vertical

Table 189: GCC Countries Network Sandboxing Market Value (US$ Bn ) Analysis (2017 – 2021) by Component

Table 190: GCC Countries Network Sandboxing Market Value (US$ Bn ) Forecast (2022 – 2032) by Component

Table 191: GCC Countries Network Sandboxing Market Value (US$ Bn ) Analysis (2017 – 2021) by Enterprise Size

Table 192: GCC Countries Network Sandboxing Market Value (US$ Bn ) Forecast (2022 – 2032) by Enterprise Size

Table 193: GCC Countries Network Sandboxing Market Value (US$ Bn ) Analysis (2017 – 2021) by Vertical

Table 194: GCC Countries Network Sandboxing Market Value (US$ Bn ) Forecast (2022 – 2032) by Vertical

Table 195: Turkey Network Sandboxing Market Value (US$ Bn ) Analysis (2017 – 2021) by Component

Table 196: Turkey Network Sandboxing Market Value (US$ Bn ) Forecast (2022 – 2032) by Component

Table 197: Turkey Network Sandboxing Market Value (US$ Bn ) Analysis (2017 – 2021) by Enterprise Size

Table 198: Turkey Network Sandboxing Market Value (US$ Bn ) Forecast (2022 – 2032) by Enterprise Size

Table 199: Turkey Network Sandboxing Market Value (US$ Bn ) Analysis (2017 – 2021) by Vertical    

Table 200: Turkey Network Sandboxing Market Value (US$ Bn ) Forecast (2022 – 2032) by Vertical    

Table 201: South Africa Network Sandboxing Market Value (US$ Bn ) Analysis (2017 – 2021) by Component

Table 202: South Africa Network Sandboxing Market Value (US$ Bn ) Forecast (2022 – 2032) by Component

Table 203: South Africa Network Sandboxing Market Value (US$ Bn ) Analysis (2017 – 2021) by Enterprise Size

Table 204: South Africa Network Sandboxing Market Value (US$ Bn ) Forecast (2022 – 2032) by Enterprise Size

Table 205: South Africa Network Sandboxing Market Value (US$ Bn ) Analysis (2017 – 2021) by Vertical

Table 206: South Africa Network Sandboxing Market Value (US$ Bn ) Forecast (2022 – 2032) by Vertical

Table 207: Rest of Middle East & Africa Network Sandboxing Market Value (US$ Bn ) Analysis (2017 – 2021) by Component

Table 208: Rest of Middle East & Africa Network Sandboxing Market Value (US$ Bn ) Forecast (2022 – 2032) by Component

Table 209: Rest of Middle East & Africa Network Sandboxing Market Value (US$ Bn ) Analysis (2017 – 2021) by Enterprise Size

Table 210: Rest of Middle East & Africa Network Sandboxing Market Value (US$ Bn ) Forecast (2022 – 2032) by Enterprise Size

Table 211: Rest of Middle East & Africa Network Sandboxing Market Value (US$ Bn ) Analysis (2017 – 2021) by Vertical

Table 212: Rest of Middle East & Africa Network Sandboxing Market Value (US$ Bn ) Forecast (2022 – 2032) by Vertical

List of Figures

Figure 01: Global Network Sandboxing Market Size (US$ Bn ) and Y-o-Y Growth Rate from 2022 – 2032

Figure 02: Global Network Sandboxing Market Absolute $ Opportunity from 2022 – 2032

Figure 03: Global Network Sandboxing Market Value (US$ Bn ), 2017-2021

Figure 04: Global Network Sandboxing Market Value (US$ Bn ), 2022-2032

Figure 05: Global Network Sandboxing Market Value Share Analysis (2022 – 2032) by Component

Figure 06: Global Network Sandboxing Market Value Y-o-Y Growth Trend Analysis (2019 – 2032) by Component

Figure 07: Global Network Sandboxing Market Attractiveness by Component

Figure 08: Global Network Sandboxing Market Value Share Analysis (2022 – 2032) by Enterprise Size

Figure 09: Global Network Sandboxing Market Value Y-o-Y Growth Trend Analysis (2019 – 2032) by Enterprise Size

Figure 10: Global Network Sandboxing Market Attractiveness by Enterprise Size

Figure 11: Global Network Sandboxing Market Value Share Analysis (2022 – 2032) by Vertical

Figure 12: Global Network Sandboxing Market Value Y-o-Y Growth Trend Analysis (2019 – 2032) by Vertical

Figure 13: Global Network Sandboxing Market Attractiveness by Vertical

Figure 14: Global Network Sandboxing Market Value Share Analysis (2022 – 2032) by Region

Figure 15: Global Network Sandboxing Market Value Y-o-Y Growth Trend Analysis (2019 – 2032) by Region

Figure 16: North America Network Sandboxing Market Absolute $ Opportunity (US$ Bn ), 2017 – 2032

Figure 17: Rest of Middle East & Africa Network Sandboxing Market Absolute $ Opportunity (US$ Bn ), 2017 – 2032

Figure 18: Latin America Network Sandboxing Market Absolute $ Opportunity (US$ Bn ), 2017 – 2032

Figure 19: Europe Network Sandboxing Market Absolute $ Opportunity (US$ Bn ), 2017 – 2032

Figure 20: East Asia Network Sandboxing Market Absolute $ Opportunity (US$ Bn ), 2017 – 2032

Figure 21: South Asia and Pacific Network Sandboxing Market Absolute $ Opportunity (US$ Bn ), 2017 – 2032

Figure 22: Middle East and Africa Network Sandboxing Market Absolute $ Opportunity (US$ Bn ), 2017 – 2032

Figure 23: Global Network Sandboxing Market Attractiveness by Region

Figure 24: North America Network Sandboxing Market Value (US$ Bn ), 2017-2021

Figure 25: North America Network Sandboxing Market Value (US$ Bn ), 2022-2032

Figure 26: North America Network Sandboxing Market Value Share Analysis (2022 – 2032) by Component

Figure 27: North America Network Sandboxing Market Value Y-o-Y Growth Trend Analysis (2019 – 2032) by Component

Figure 28: North America Network Sandboxing Market Attractiveness by Component

Figure 29: North America Network Sandboxing Market Value Share Analysis (2022 – 2032) by Enterprise Size

Figure 30: North America Network Sandboxing Market Value Y-o-Y Growth Trend Analysis (2019 – 2032) by Enterprise Size

Figure 31: North America Network Sandboxing Market Attractiveness by Enterprise Size

Figure 32: North America Network Sandboxing Market Value Share Analysis (2022 – 2032) by Vertical

Figure 33: North America Network Sandboxing Market Value Y-o-Y Growth Trend Analysis (2019 – 2032) by Vertical

Figure 34: North America Network Sandboxing Market Attractiveness by Vertical

Figure 35: North America Network Sandboxing Market Value Share Analysis (2022 – 2032) by Country

Figure 36: North America Network Sandboxing Market Value Y-o-Y Growth Trend Analysis (2019 – 2032) by Country

Figure 37:U.S. Network Sandboxing Market Absolute $ Opportunity (US$ Bn ), 2017 – 2032

Figure 38: Canada Network Sandboxing Market Absolute $ Opportunity (US$ Bn ), 2017 – 2032

Figure 39: North America Network Sandboxing Market Attractiveness by Country

Figure 40: Latin America Network Sandboxing Market Value (US$ Bn ), 2017-2021

Figure 41: Latin America Network Sandboxing Market Value (US$ Bn ), 2022-2032

Figure 42: Latin America Network Sandboxing Market Value Share Analysis (2022 – 2032) by Component

Figure 43: Latin America Network Sandboxing Market Value Y-o-Y Growth Trend Analysis (2019 – 2032) by Component

Figure 44: Latin America Network Sandboxing Market Attractiveness by Component

Figure 45: Latin America Network Sandboxing Market Value Share Analysis (2022 – 2032) by Enterprise Size

Figure 46: Latin America Network Sandboxing Market Value Y-o-Y Growth Trend Analysis (2019 – 2032) by Enterprise Size

Figure 47: Latin America Network Sandboxing Market Attractiveness by Enterprise Size

Figure 48: Latin America Network Sandboxing Market Value Share Analysis (2022 – 2032) by Vertical

Figure 49: Latin America Network Sandboxing Market Value Y-o-Y Growth Trend Analysis (2019 – 2032) by Vertical

Figure 50: Latin America Network Sandboxing Market Attractiveness by Vertical

Figure 51: Latin America Network Sandboxing Market Value Share Analysis (2022 – 2032) by Country

Figure 52: Latin America Network Sandboxing Market Value Y-o-Y Growth Trend Analysis (2019 – 2032) by Country

Figure 53: Brazil Network Sandboxing Market Absolute $ Opportunity (US$ Bn ), 2017 – 2032

Figure 54: Mexico Network Sandboxing Market Absolute $ Opportunity (US$ Bn ), 2017 – 2032

Figure 55: Rest of Latin America Network Sandboxing Market Absolute $ Opportunity (US$ Bn ), 2017 – 2032

Figure 56: Latin America Network Sandboxing Market Attractiveness by Country

Figure 57: Europe Network Sandboxing Market Value (US$ Bn ), 2017-2021

Figure 58: Europe Network Sandboxing Market Value (US$ Bn ), 2022-2032

Figure 59: Europe Network Sandboxing Market Value Share Analysis (2022 – 2032) by Component

Figure 60: Europe Network Sandboxing Market Value Y-o-Y Growth Trend Analysis (2019 – 2032) by Component

Figure 61: Europe Network Sandboxing Market Attractiveness by Component

Figure 62: Europe Network Sandboxing Market Value Share Analysis (2022 – 2032) by Enterprise Size

Figure 63: Europe Network Sandboxing Market Value Y-o-Y Growth Trend Analysis (2019 – 2032) by Enterprise Size

Figure 64: Europe Network Sandboxing Market Attractiveness by Enterprise Size

Figure 65: Europe Network Sandboxing Market Value Share Analysis (2022 – 2032) by Vertical

Figure 66: Europe Network Sandboxing Market Value Y-o-Y Growth Trend Analysis (2019 – 2032) by Vertical

Figure 67: Europe Network Sandboxing Market Attractiveness by Vertical

Figure 68: Europe Network Sandboxing Market Value Share Analysis (2022 – 2032) by Country

Figure 69: Europe Network Sandboxing Market Value Y-o-Y Growth Trend Analysis (2019 – 2032) by Country

Figure 70: U.K. Network Sandboxing Market Absolute $ Opportunity (US$ Bn ), 2017 – 2032

Figure 71: Germany Network Sandboxing Market Absolute $ Opportunity (US$ Bn ), 2017 – 2032

Figure 72: France Network Sandboxing Market Absolute $ Opportunity (US$ Bn ), 2017 – 2032

Figure 73: Italy Network Sandboxing Market Absolute $ Opportunity (US$ Bn ), 2017 – 2032

Figure 74: Spain Network Sandboxing Market Absolute $ Opportunity (US$ Bn ), 2017 – 2032

Figure 75: BENELUX Network Sandboxing Market Absolute $ Opportunity (US$ Bn ), 2017 – 2032

Figure 76: Russia Network Sandboxing Market Absolute $ Opportunity (US$ Bn ), 2017 – 2032

Figure 77: Rest of Europe Network Sandboxing Market Absolute $ Opportunity (US$ Bn ), 2017 – 2032

Figure 78: Europe Network Sandboxing Market Attractiveness by Country

Figure 79: East Asia Network Sandboxing Market Value (US$ Bn ), 2017-2021

Figure 80: East Asia Network Sandboxing Market Value (US$ Bn ), 2022-2032

Figure 81: East Asia Network Sandboxing Market Value Share Analysis (2022 – 2032) by Component

Figure 82: East Asia Network Sandboxing Market Value Y-o-Y Growth Trend Analysis (2019 – 2032) by Component

Figure 83: East Asia Network Sandboxing Market Attractiveness by Component

Figure 84: East Asia Network Sandboxing Market Value Share Analysis (2022 – 2032) by Enterprise Size

Figure 85: East Asia Network Sandboxing Market Value Y-o-Y Growth Trend Analysis (2019 – 2032) by Enterprise Size

Figure 86: East Asia Network Sandboxing Market Attractiveness by Enterprise Size

Figure 87: East Asia Network Sandboxing Market Value Share Analysis (2022 – 2032) by Vertical

Figure 88: East Asia Network Sandboxing Market Value Y-o-Y Growth Trend Analysis (2019 – 2032) by Vertical

Figure 89: East Asia Network Sandboxing Market Attractiveness by Vertical

Figure 90: East Asia Network Sandboxing Market Value Share Analysis (2022 – 2032) by Country

Figure 91: East Asia Network Sandboxing Market Value Y-o-Y Growth Trend Analysis (2019 – 2032) by Country

Figure 92: China Network Sandboxing Market Absolute $ Opportunity (US$ Bn ), 2017 – 2032

Figure 93: Japan Network Sandboxing Market Absolute $ Opportunity (US$ Bn ), 2017 – 2032

Figure 94: Spain Network Sandboxing Market Absolute $ Opportunity (US$ Bn ), 2017 – 2032

Figure 95: East Asia Network Sandboxing Market Attractiveness by Country

Figure 96: South Asia & Pacific Network Sandboxing Market Value (US$ Bn ), 2017-2021

Figure 97: South Asia & Pacific Network Sandboxing Market Value (US$ Bn ), 2022-2032

Figure 98: South Asia & Pacific Network Sandboxing Market Value Share Analysis (2022 – 2032) by Component

Figure 99: South Asia & Pacific Network Sandboxing Market Value Y-o-Y Growth Trend Analysis (2019 – 2032) by Component

Figure 100: South Asia & Pacific Network Sandboxing Market Attractiveness by Component

Figure 101: South Asia & Pacific Network Sandboxing Market Value Share Analysis (2022 – 2032) by Enterprise Size

Figure 102: South Asia & Pacific Network Sandboxing Market Value Y-o-Y Growth Trend Analysis (2019 – 2032) by Enterprise Size

Figure 103: South Asia & Pacific Network Sandboxing Market Attractiveness by Enterprise Size

Figure 104: South Asia & Pacific Network Sandboxing Market Value Share Analysis (2022 – 2032) by Vertical

Figure 105: South Asia & Pacific Network Sandboxing Market Value Y-o-Y Growth Trend Analysis (2019 – 2032) by Vertical

Figure 106: South Asia & Pacific Network Sandboxing Market Attractiveness by Vertical

Figure 107: South Asia & Pacific Network Sandboxing Market Value Share Analysis (2022 – 2032) by Country

Figure 108: South Asia & Pacific Network Sandboxing Market Value Y-o-Y Growth Trend Analysis (2019 – 2032) by Country

Figure 109: India Network Sandboxing Market Absolute $ Opportunity (US$ Bn ), 2017 – 2032

Figure 110: Thailand Network Sandboxing Market Absolute $ Opportunity (US$ Bn ), 2017 – 2032

Figure 111: Indonesia Network Sandboxing Market Absolute $ Opportunity (US$ Bn ), 2017 – 2032

Figure 112: Malaysia Network Sandboxing Market Absolute $ Opportunity (US$ Bn ), 2017 – 2032

Figure 113: Australia & New Zealand Network Sandboxing Market Absolute $ Opportunity (US$ Bn ), 2017 – 2032

Figure 114: Rest of South Asia & Pacific Network Sandboxing Market Absolute $ Opportunity (US$ Bn ), 2017 – 2032

Figure 115: South Asia & Pacific Network Sandboxing Market Attractiveness by Country

Figure 116: Middle East & Africa Network Sandboxing Market Value (US$ Bn ), 2017-2021

Figure 117: Middle East & Africa Network Sandboxing Market Value (US$ Bn ), 2022-2032

Figure 118: Middle East & Africa Network Sandboxing Market Value Share Analysis (2022 – 2032) by Component

Figure 119: Middle East & Africa Network Sandboxing Market Value Y-o-Y Growth Trend Analysis (2019 – 2032) by Component

Figure 120: Middle East & Africa Network Sandboxing Market Attractiveness by Component

Figure 121: Middle East & Africa Network Sandboxing Market Value Share Analysis (2022 – 2032) by Enterprise Size

Figure 122: Middle East & Africa Network Sandboxing Market Value Y-o-Y Growth Trend Analysis (2019 – 2032) by Enterprise Size

Figure 123: Middle East & Africa Network Sandboxing Market Attractiveness by Enterprise Size

Figure 124: Middle East & Africa Network Sandboxing Market Value Share Analysis (2022 – 2032) by Vertical

Figure 125: Middle East & Africa Network Sandboxing Market Value Y-o-Y Growth Trend Analysis (2019 – 2032) by Vertical

Figure 126: Middle East & Africa Network Sandboxing Market Attractiveness by Vertical

Figure 127: Middle East & Africa Network Sandboxing Market Value Share Analysis (2022 – 2032) by Country

Figure 128: Middle East & Africa Network Sandboxing Market Value Y-o-Y Growth Trend Analysis (2019 – 2032) by Country

Figure 129: GCC Countries Network Sandboxing Market Absolute $ Opportunity (US$ Bn ), 2017 – 2032

Figure 130: Turkey Network Sandboxing Market Absolute $ Opportunity (US$ Bn ), 2017 – 2032

Figure 131: South Africa Network Sandboxing Market Absolute $ Opportunity (US$ Bn ), 2017 – 2032

Figure 132: Middle East & Africa Network Sandboxing Market Attractiveness by Country

Frequently Asked Questions

Which region is expected to showcase high growth in network sandboxing demand?

South Asia & Pacific is projected to register strong growth in the market, exhibiting a CAGR of nearly 19.8% during the forecast period. However, North America currently leads the global market, with market share of around 33.6% in 2022.

Who are the leading companies offering network sandboxing?

Some of the leading companies in this landscape are Check Point Software Technologies, Cisco Systems, Fortinet, FireEye, Microsoft, and Juniper Networks. among others.

Which is the leading industry in network sandboxing market during the forecast period?

Government and defense sector is expected to dominate the market over the forecast period, generating the highest revenue by the end of 2032.

What will be the demand outlook for network sandboxing market through 2032?

The network sandboxing industry was valued at ~USD 7,113.0 Million in 2021, and is estimated to show lucrative growth with a CAGR of 15.7% to reach ~USD 34,941.7 Million in 2032.

What was the last 5-year network sandboxing market CAGR?

The market in last 5 years (2017 to 2021) grew by a CAGR of 13.4%.

What are the key trends of network sandboxing industry?

Key trends in the market includes: • Adoption of BYOD policies among SMEs to increase network-based attacks • Demand for cloud-based security services for high scalability

What is the driving demand for network sandboxing?

• Increasing sophistication in cyber-attacks by hackers • Stringent cybersecurity policies and compliances

What will be the demand outlook/ sales forecast for network sandboxing market?

The sales of network sandboxing solutions are expected to total ~USD 8,152.8 Million by the end of 2022, and is likely to reach ~USD 34,941.7 Million by 2032.

Which countries are key providers of network sandboxing?

Countries involved in providing network sandboxing include the USA, UK, Germany, China, and Japan.

At what rate did the demand for network sandboxing grow during 2021 to 2022?

The global market growth between 2021 and 2022 is around 14.6%.

What are the top 5 countries driving demand?

Top 5 countries driving demand for network sandboxing include USA, Japan, UK, India and China.

What is Europe market outlook?

Europe is predicted to remain one of the most attractive markets during the forecast period, according to Future Market Insights. According to the study, UK is expected to account for 15.8% of the Europe market through 2032.

What is the Japan and South Korea network sandboxing market outlook?

The network sandboxing demand in Japan and South Korea was valued at ~USD 354.0 Million and ~USD 268.4 Million in 2021 respectively, and is projected to register CAGR of around 20.9% and 14.8% respectively between 2022 and 2032.

Explore Similar Insights

Future Market Insights

Network Sandboxing Market