Reports
- Global Locations -
Headquarters
Future Market Insights, Inc.
Christiana Corporate, 200
Continental Drive, Suite 401,
Newark, Delaware - 19713,
United States
Americas
Future Market Insights, Inc.
616 Corporate Way, Suite 2-9018,
Valley Cottage, NY 10989, United States
MEA
Future Market Insights
1602-6 Jumeirah Bay X2 Tower, Plot No: JLT-PH2-X2A,
Jumeirah Lakes Towers, Dubai,
United Arab Emirates
Europe
Future Market Insights
3rd Floor, 207 Regent Street,
W1B 3HH London
United Kingdom
Asia Pacific
Future Market Insights
Office No. 401-A, 4th Floor,
VANTAGE 9, S.No. 36/1/1,
Baner, Pune 411045, India
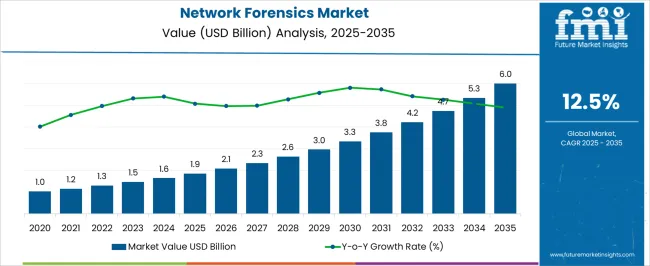
[333 Pages Report] According to estimates, the network forensics market is expected to grow to US$ 8.9 Billion by 2032. The network forensics market is expected to grow at a significant 12.5% CAGR between 2022 and 2032.
Data leaks and thefts can expose suspicious behavior on networks by using network forensics. Cybercrime investigation and analysis is a subset of information security that focuses on the analysis and investigation of security breaches in a network. A growing number of connected devices, wireless technology, and increased internet penetration are creating new opportunities for network forensics solution vendors, leading to the expansion of their operations into new markets.
In addition to securing networks against subtle attacks, network forensics tools can also detect and identify malicious attacks. In addition to offering deep insights into an organization's network environment, they are helpful in preventing data breaches that could result in significant losses in profits and competitive advantages, as well as the loss of financial gains, to the organization. When dealing with technical, operational, or organizational issues, keeping a detailed record of network activity may provide valuable insight into the market.
Small and medium businesses are turning to cloud-based solutions as mobile devices and the Internet of Things grow. Furthermore, due to the trend of enterprise application buyers moving from traditional systems to a preference for cloud-based services, the network forensics market will continue to grow in the coming years. Cloud-based network forensics solutions are gaining popularity globally due to their ease of maintenance and low costs in the market.
Attributes | Details |
---|---|
Network Forensics Market CAGR (2022 to 2032) | 12.5% |
Network Forensics Market Size (2025) | US$ 4.23 Billion |
Network Forensics Market Size (2032) | US$ 8.9 Billion |
Don't pay for what you don't need
Customize your report by selecting specific countries or regions and save 30%!
Due to the increase in network complexity in the Asia Pacific, organizations are forced to deploy network forensic solutions in order to protect from the rising threat landscape. It is expected that the Asia Pacific region will hold the largest market share during the forecast period due to its advanced and rapid adoption of emerging technologies in the market.
During the forecast period, the Asia Pacific region is predicted to grow at the fastest rate, as it has experienced rapid and advanced adoption of new technologies over the past few years. According to the forecast, India and China will enjoy the highest growth rates with a CAGR of 16.3%. This will be closely followed by Japan which is expected to grow by 10.5% CAGR during the period of forecasting.
Due to the increasing number of cybersecurity threats and cybercrimes in India, it is expected that market demand for network forensics will rise in the future. This region is home to a large number of SMEs, which provide significant opportunities for employment in the area. These factors will fuel the growth of the network forensics market in the region.
A rapid increase in the use of digital applications in the banking sector, as well as the increasing use of digital payment methods, may provide certain opportunities in the near future. The amount of potential the market has to offer is demonstrated by the use of network management solutions to improve business operations.
Researchers are focusing on developing new techniques to determine the network activity of users. The network introduces new digital devices with diverse functionalities and different protocols, such as smart televisions and play stations. This latest generation of devices requires the development of network forensics models and frameworks corresponding to them. In order to meet the current technological challenges, it is necessary to develop and improve the existing forensic technology to make it more efficient and sophisticated.
By continent/region, Asia has the highest percentage of internet users, accounting for 51.8 % of all users in 2021. Due to various technological improvements, network traffic is expected to increase even more in the next few years.
The investigation process becomes laborious when there is a lot of data traffic and complicated systems to analyze in order to have a better understanding of the systems. In the future years, the network forensics market will be driven by the rising requirement to protect networks from advanced assaults and reduce network crimes.
Network forensics aids businesses in capturing, recording, and analyzing network data in order to conduct investigations and respond to incidents. Organizations all around the world have begun to adopt network forensics systems in order to detect network activity and identify potential threats.
When it comes to network forensics investigations, investigators must have the necessary technical skills and understanding to capture, process, store, and analyze evidence. There is a demand for educated network forensics professionals for this meaningful examination of digital evidence, which is currently behind in the market and is projected to be the primary factor limiting network forensics market growth.
Get the data you need at a Fraction of the cost
Personalize your report by choosing insights you need
and save 40%!
In order to address significant vulnerabilities with faster mitigation, threat detection, and response capabilities, network forensics investigators are adding AI, machine learning, and analytics principles into their solutions. Advances in technology, such as AI and machine learning, are helping to turn the tide against vulnerabilities.
Network security systems based on AI and machine learning assist enterprises in providing complete security features to their network infrastructure. As AI approaches are used for learning and reasoning, they are exceptionally capable of learning and solving complicated computational problems.
AI systems have achieved great advances in performing increasingly complicated computational tasks, using ML as the basic technology, and network forensics investigators can advance ANN in pattern recognition.
While investigating the most complicated network attacks, network forensics investigators face a variety of problems. To prepare for digital evidence, the detectives must collect data from throughout the company's networks relevant to network offenses.
Due to the challenges of obtaining large amounts of data for inquiry, network forensics investigators face a range of technical hurdles. Traditional forensics solutions have significant limitations that make collecting digital evidence challenging.
Network Forensics Market:
Attributes | Network Forensics Market |
---|---|
CAGR (2022 to 2032) | 12.5% |
Market Value (2026) | US$ 4.32 Billion |
Growth Factor | Demand is high due to increasing incidents of cyber threats, fraud, and phishing scams. |
Opportunity | Higher growth potential due to advances in technology, such as AI and machine |
Key Trends | AI assists enterprises in providing complete security features to their network infrastructure. |
Digital Forensics Market:
Attributes | Digital Forensics Market |
---|---|
CAGR (2022 to 2032) | 11.2% |
Market Value (2026) | US$ 15.4 Billion |
Growth Factor | An Increasing Adoption of Artificial Intelligence is Propelling Market Growth, resulting in higher income. |
Opportunity | The market is expanding as a result of an increase in digital applications ranging from email to Internet banking. |
Key Trends | The digital forensics sector is likely to advance if all firms quickly implement data compliance rules. |
Network Monitoring Market:
Attributes | Network Monitoring Market |
---|---|
CAGR (2022 to 2032) | 9.9% |
Market Value (2026) | US$ 3.85 Billion |
Growth Factor | As a result of an increase in the number of businesses with stringent reliability needs, the market is expanding. |
Opportunity | Using network management solutions to improve business operations, shows that the market has more potential. |
Key Trends | The market benefits from the growing software-defined networking sector. |
Rapid advancements in mobile, IoT, and online applications, as well as integrated next-generation network forensics solutions, are opportunistic factors for the network forensics market, which would provide significant potential for participants throughout the projection period. Network forensics output is digital evidence that has been proven to be robust and accurate, and as a result, it is legally acceptable.
Ongoing digitization is reshaping the current business environment, where the deployment of new networking technologies may cause compatibility and security difficulties, necessitating the collection of digital evidence by network forensics investigators in order to deliver better solutions. Businesses have been forced to implement network forensics due to the increasing sophistication of cyber criminals who use multi-layered hacking mechanisms to monitor networks across corporations.
In the coming years, the demand for in-depth network data analysis, as well as the necessity to extract or obtain actionable digital evidence on cyber-attacks, is expected to drive rapid growth in network forensics products and services across industries.
The network forensics market research report keeps a close eye on top competitors with strategic analysis, micro and macro market trends and scenarios, price analysis, and a holistic picture of the network forensics market situations in the projected period. It examines basic and secondary drivers, market share, prominent segments, and geographical analyses in great detail.
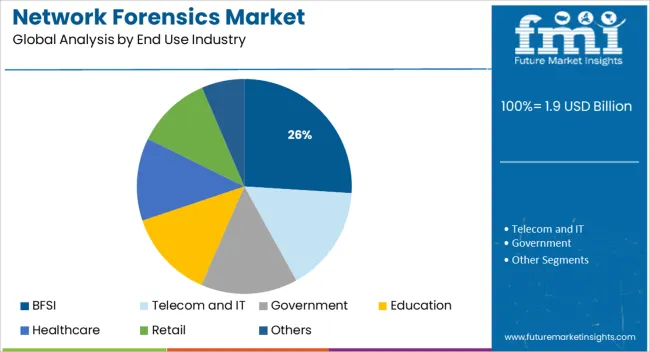
The network forensics market is segmented into components, deployment types, end-use industries, and regions.
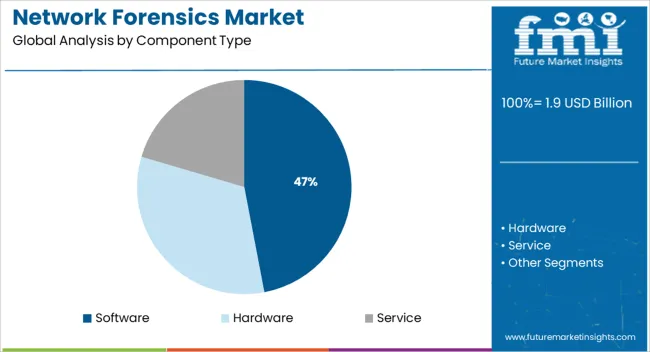
According to FMI, by components, software holds the largest share in the network forensic market, with an anticipated CAGR of 12.3%. The growing relevance of identifying unauthorized access and discovering the source of security assaults, as well as the continuous focus on reducing IT network downtime across various enterprises, are likely to fuel the expansion of the worldwide network forensics market.
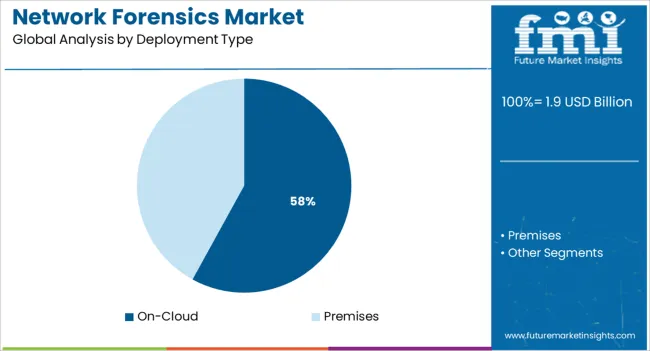
On-Premises have the highest potential in the network forensics market, with an expected CAGR of 9.2% during the forecast period. The widespread use of personal devices by businesses in this sector is to blame for the rise in network intrusions and crimes. IT service providers are now adopting network forensics solutions for investigations to maintain the safety of network infrastructure and technological innovation.
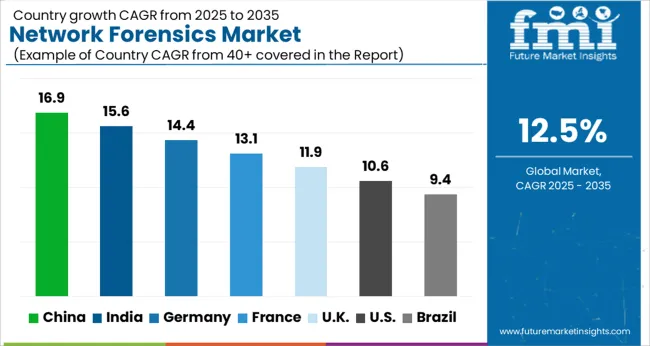
Regions | CAGR (2022 to 2032) |
---|---|
United States | 10.2% |
United Kingdom | 12.2% |
China | 16.3% |
Japan | 10.5% |
India | 16.3% |
Due to the presence of prominent network forensics players in the region and increasing investment in network forensics infrastructure by organizations across various industries, North America is expected to dominate the global network forensics market with a projected market value of US$ 2 billion.
With the rise in network complexities, the threat landscape in the Asia Pacific region is changing at an alarming rate, pushing enterprises to employ network forensics solutions. China, Singapore, India, and the rest of the Asia Pacific countries are part of the region.
Many SMEs exist in this region, providing significant employment prospects. Asia Pacific has seen rapid and advanced adoption of new technologies, and it is predicted to grow at the fastest rate during the forecast period.
The region is pushing hard to make the most of its IT infrastructure, allowing businesses to adopt cutting-edge technologies. However, reasons such as the growing mobile workforce, increasing company complexity, and the uncontrolled nature of the internet are projected to encourage such SMEs to become more mobile.
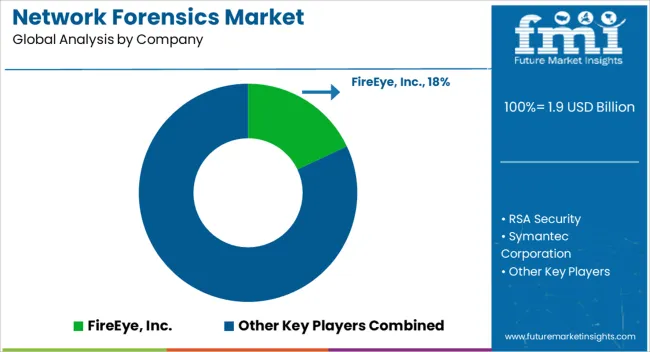
Network forensics market players are taking advantage of the opportunities prevailing in the market by training and up-skilling their staff. Non-traditional job prospects who can make an immediate impact on the industry are predicted to be opportunistic for the network forensics market, according to key participants.
Players in the network forensics market are primarily focused on the creation of creative and efficient goods. The findings illustrate how rivals are capitalizing on the potential in the network forensics market.
The following are some of the most recent advancements in the network forensics market:
1. Preface | Network Forensics Market 1.1. Report Scope and Segmentation 1.2. Key Research Objectives and Highlights 2. Assumptions and Research Methodology 3. Executive Summary: Market 4. Overview 4.1. Introduction 4.1.1. Definition 4.1.2. Functional Model 4.2. Market Dynamics 4.2.1. Drivers 4.2.2. Restraints 4.2.3. Opportunity 4.3. Key Trends 4.4. Global Market Analysis and Forecasts, 2015 to 2032 4.4.1. Market Revenue Projections (US$ Million) 4.5. Porter’s Five Force Analysis 4.6. Value Chain Analysis 4.7. Market Outlook 5. Global Market Analysis and Forecast by Deployment Type 5.1. Introduction & Definition 5.2. Key Findings / Developments 5.3. Market Size (US$ Million) and Forecast by Deployment Type, 2015 to 2032 5.3.1. On-premise 5.3.2. Cloud-based 5.4. Deployment Type Comparison Matrix 5.5. Market Attractiveness by Deployment Type 6. Global Market Analysis and Forecast by Component 6.1. Introduction & Definition 6.2. Key Findings / Developments 6.3. Market Size (US$ Million) and Forecast by Component, 2015 to 2032 6.3.1. Hardware 6.3.2. Software 6.3.3. Services 6.4. Component Comparison Matrix 6.5. Market Attractiveness by Component 7. Global Market Analysis and Forecast by End-Use Industry 7.1. Introduction 7.2. Key Findings / Developments 7.3. Market Size (US$ Million) and Forecast by End-Use Industry, 2015 to 2032 7.3.1. BFSI 7.3.2. Telecom and IT 7.3.3. Government 7.3.4. Education 7.3.5. Healthcare 7.3.6. Retail 7.3.7. Others 7.4. End-Use Industry Comparison Matrix 7.5. Market Attractiveness by End-Use Industry 8. Global Market Analysis and Forecasts, by Region 8.1. Key Findings 8.2. Market Size (US$ Million) Forecast by Region, 2015 to 2032 8.2.1. North America 8.2.2. Europe 8.2.3. Asia Pacific 8.2.4. Middle East and Africa 8.2.5. South America 8.3. Market Attractiveness by Region 9. North America Market Size and Forecast 9.1. Key Findings 9.2. Market Size (US$ Million) and Forecast by Deployment Type, 2015 to 2032 9.2.1. On-premise 9.2.2. Cloud-based 9.3. Market Size (US$ Million) and Forecast by Component, 2015 to 2032 9.3.1. Hardware 9.3.2. Software 9.3.3. Services 9.4. Market Size (US$ Million) and Forecast by End-Use Industry, 2015 to 2032 9.4.1. BFSI 9.4.2. Telecom and IT 9.4.3. Government 9.4.4. Education 9.4.5. Healthcare 9.4.6. Retail 9.4.7. Others 9.5. Market Size (US$ Million) and Forecast by Country, 2015 to 2032 9.5.1. The USA 9.5.1.1. Market Size (US$ Million) and Forecast by Deployment Type, 2015 to 2032 9.5.1.1.1. On-premise 9.5.1.1.2. Cloud-based 9.5.1.2. Market Size (US$ Million) and Forecast by Component, 2015 to 2032 9.5.1.2.1. Hardware 9.5.1.2.2. Software 9.5.1.2.3. Services 9.5.1.3. Market Size (US$ Million) and Forecast by End-Use Industry, 2015 to 2032 9.5.1.3.1. BFSI 9.5.1.3.2. Healthcare 9.5.1.3.3. Government 9.5.1.3.4. IT and Telecom 9.5.1.3.5. Defense 9.5.1.3.6. Retail 9.5.1.3.7. Others 9.5.2. Canada 9.5.2.1. Market Size (US$ Million) and Forecast by Deployment Type, 2015 to 2032 9.5.2.1.1. On-premise 9.5.2.1.2. Cloud-based 9.5.2.2. Market Size (US$ Million) and Forecast by Component, 2015 to 2032 9.5.2.2.1. Hardware 9.5.2.2.2. Software 9.5.2.2.3. Services 9.5.2.3. Market Size (US$ Million) and Forecast by End-Use Industry, 2015 to 2032 9.5.2.3.1. BFSI 9.5.2.3.2. Healthcare 9.5.2.3.3. Government 9.5.2.3.4. IT and Telecom 9.5.2.3.5. Defense 9.5.2.3.6. Retail 9.5.2.3.7. Others 9.5.3. Rest of North America 9.6. Market Attractiveness Analysis 9.6.1. By Deployment Type 9.6.2. By Component 9.6.3. By End-Use Industry 9.6.4. By Country 10. Europe Market Size and Forecast 10.1. Key Findings 10.2. Market Size (US$ Million) and Forecast by Deployment Type, 2015 to 2032 10.2.1. On-premise 10.2.2. Cloud-based 10.3. Market Size (US$ Million) and Forecast by Component, 2015 to 2032 10.3.1. Hardware 10.3.2. Software 10.3.3. Services 10.4. Market Size (US$ Million) and Forecast by End-Use Industry, 2015 to 2032 10.4.1. BFSI 10.4.2. Telecom and IT 10.4.3. Government 10.4.4. Education 10.4.5. Healthcare 10.4.6. Retail 10.4.7. Others 10.5. Market Size (US$ Million ) and Forecast by Country, 2015 to 2032 10.5.1. The UK 10.5.1.1. Market Size (US$ Million) and Forecast by Deployment Type, 2015 to 2032 10.5.1.1.1. On-premise 10.5.1.1.2. Cloud-based 10.5.1.2. Market Size (US$ Million) and Forecast by Component, 2015 to 2032 10.5.1.2.1. Hardware 10.5.1.2.2. Software 10.5.1.2.3. Services 10.5.1.3. Market Size (US$ Million) and Forecast by End-Use Industry, 2015 to 2032 10.5.1.3.1. BFSI 10.5.1.3.2. Healthcare 10.5.1.3.3. Government 10.5.1.3.4. IT and Telecom 10.5.1.3.5. Defense 10.5.1.3.6. Retail 10.5.1.3.7. Others 10.5.2. Germany 10.5.2.1. Market Size (US$ Million) and Forecast by Deployment Type, 2015 to 2032 10.5.2.1.1. On-premise 10.5.2.1.2. Cloud-based 10.5.2.2. Market Size (US$ Million) and Forecast by Component, 2015 to 2032 10.5.2.2.1. Hardware 10.5.2.2.2. Software 10.5.2.2.3. Services 10.5.2.3. Market Size (US$ Million) and Forecast by End-Use Industry, 2015 to 2032 10.5.2.3.1. BFSI 10.5.2.3.2. Healthcare 10.5.2.3.3. Government 10.5.2.3.4. IT and Telecom 10.5.2.3.5. Defense 10.5.2.3.6. Retail 10.5.2.3.7. Others 10.5.3. France 10.5.3.1. Market Size (US$ Million) and Forecast by Deployment Type, 2015 to 2032 10.5.3.1.1. On-premise 10.5.3.1.2. Cloud-based 10.5.3.2. Market Size (US$ Million) and Forecast by Component, 2015 to 2032 10.5.3.2.1. Hardware 10.5.3.2.2. Software 10.5.3.2.3. Services 10.5.3.3. Market Size (US$ Million) and Forecast by End-Use Industry, 2015 to 2032 10.5.3.3.1. BFSI 10.5.3.3.2. Healthcare 10.5.3.3.3. Government 10.5.3.3.4. IT and Telecom 10.5.3.3.5. Defense 10.5.3.3.6. Retail 10.5.3.3.7. Others 10.5.4. Rest of Europe` 10.6. Market Attractiveness Analysis 10.6.1. By Deployment Type 10.6.2. By Component 10.6.3. By End-Use Industry 10.6.4. By Country 11. Asia Pacific Market Size and Forecast 11.1. Key Findings 11.2. Key Findings 11.3. Market Size (US$ Million) and Forecast by Deployment Type, 2015 to 2032 11.3.1. On-premise 11.3.2. Cloud-based 11.4. Market Size (US$ Million) and Forecast by Component, 2015 to 2032 11.4.1. Hardware 11.4.2. Software 11.4.3. Services 11.5. Market Size (US$ Million) and Forecast by End-Use Industry, 2015 to 2032 11.5.1. BFSI 11.5.2. Telecom and IT 11.5.3. Government 11.5.4. Education 11.5.5. Healthcare 11.5.6. Retail 11.5.7. Others 11.6. Market Size (US$ Million ) and Forecast by Country, 2015 to 2032 11.6.1. India 11.6.1.1. Market Size (US$ Million) and Forecast by Deployment Type, 2015 to 2032 11.6.1.1.1. On-premise 11.6.1.1.2. Cloud-based 11.6.1.2. Market Size (US$ Million) and Forecast by Component, 2015 to 2032 11.6.1.2.1. Hardware 11.6.1.2.2. Software 11.6.1.2.3. Services 11.6.1.3. Market Size (US$ Million) and Forecast by End-Use Industry, 2015 to 2032 11.6.1.3.1. BFSI 11.6.1.3.2. Healthcare 11.6.1.3.3. Government 11.6.1.3.4. IT and Telecom 11.6.1.3.5. Defense 11.6.1.3.6. Retail 11.6.1.3.7. Others 11.6.2. China 11.6.2.1. Market Size (US$ Million) and Forecast by Deployment Type, 2015 to 2032 11.6.2.1.1. On-premise 11.6.2.1.2. Cloud-based 11.6.2.2. Market Size (US$ Million) and Forecast by Component, 2015 to 2032 11.6.2.2.1. Hardware 11.6.2.2.2. Software 11.6.2.2.3. Services 11.6.2.3. Market Size (US$ Million) and Forecast by End-Use Industry, 2015 to 2032 11.6.2.3.1. BFSI 11.6.2.3.2. Healthcare 11.6.2.3.3. Government 11.6.2.3.4. IT and Telecom 11.6.2.3.5. Defense 11.6.2.3.6. Retail 11.6.2.3.7. Others 11.6.3. Japan 11.6.3.1. Market Size (US$ Million) and Forecast by Deployment Type, 2015 to 2032 11.6.3.1.1. On-premise 11.6.3.1.2. Cloud-based 11.6.3.2. Market Size (US$ Million) and Forecast by Component, 2015 to 2032 11.6.3.2.1. Hardware 11.6.3.2.2. Software 11.6.3.2.3. Services 11.6.3.3. Market Size (US$ Million) and Forecast by End-Use Industry, 2015 to 2032 11.6.3.3.1. BFSI 11.6.3.3.2. Healthcare 11.6.3.3.3. Government 11.6.3.3.4. IT and Telecom 11.6.3.3.5. Defense 11.6.3.3.6. Retail 11.6.3.3.7. Others 11.6.4. Rest of Asia Pacific 11.7. Market Attractiveness Analysis 11.7.1. By Deployment Type 11.7.2. By Component 11.7.3. By End-Use Industry 11.7.4. By Country 12. Middle East and Africa (MEA) Market Size and Forecast 12.1. Key Findings 12.2. Key Findings 12.3. Market Size (US$ Million) and Forecast by Deployment Type, 2015 to 2032 12.3.1. On-premise 12.3.2. Cloud-based 12.4. Market Size (US$ Million) and Forecast by Component, 2015 to 2032 12.4.1. Hardware 12.4.2. Software 12.4.3. Services 12.5. Market Size (US$ Million) and Forecast by End-Use Industry, 2015 to 2032 12.5.1. BFSI 12.5.2. Telecom and IT 12.5.3. Government 12.5.4. Education 12.5.5. Healthcare 12.5.6. Retail 12.5.7. Others 12.6. Market Size (US$ Million ) and Forecast by Country, 2015 to 2032 12.6.1. GCC Countries 12.6.1.1. Market Size (US$ Million) and Forecast by Deployment Type, 2015 to 2032 12.6.1.1.1. On-premise 12.6.1.1.2. Cloud-based 12.6.1.2. Market Size (US$ Million) and Forecast by Component, 2015 to 2032 12.6.1.2.1. Hardware 12.6.1.2.2. Software 12.6.1.2.3. Services 12.6.1.3. Market Size (US$ Million) and Forecast by End-Use Industry, 2015 to 2032 12.6.1.3.1. BFSI 12.6.1.3.2. Healthcare 12.6.1.3.3. Government 12.6.1.3.4. IT and Telecom 12.6.1.3.5. Defense 12.6.1.3.6. Retail 12.6.1.3.7. Others 12.6.2. South Africa 12.6.2.1. Market Size (US$ Million) and Forecast by Deployment Type, 2015 to 2032 12.6.2.1.1. On-premise 12.6.2.1.2. Cloud-based 12.6.2.2. Market Size (US$ Million) and Forecast by Component, 2015 to 2032 12.6.2.2.1. Hardware 12.6.2.2.2. Software 12.6.2.2.3. Services 12.6.2.3. Market Size (US$ Million) and Forecast by End-Use Industry, 2015 to 2032 12.6.2.3.1. BFSI 12.6.2.3.2. Healthcare 12.6.2.3.3. Government 12.6.2.3.4. IT and Telecom 12.6.2.3.5. Defense 12.6.2.3.6. Retail 12.6.2.3.7. Others 12.6.3. Rest of Middle East & Africa 12.7. Market Attractiveness Analysis 12.7.1. By Deployment Type 12.7.2. By Component 12.7.3. By End-Use Industry 12.7.4. By Country 13. South America Market Size and Forecast 13.1. Key Findings 13.2. Key Findings 13.3. Market Size (US$ Million) and Forecast by Deployment Type, 2015 to 2032 13.3.1. On-premise 13.3.2. Cloud-based 13.4. Market Size (US$ Million) and Forecast by Component, 2015 to 2032 13.4.1. Hardware 13.4.2. Software 13.4.3. Services 13.5. Market Size (US$ Million) and Forecast by End-Use Industry, 2015 to 2032 13.5.1. BFSI 13.5.2. Telecom and IT 13.5.3. Government 13.5.4. Education 13.5.5. Healthcare 13.5.6. Retail 13.5.7. Others 13.6. Market Size (US$ Million ) and Forecast by Country, 2015 to 2032 13.6.1. Brazil 13.6.1.1. Market Size (US$ Million) and Forecast by Deployment Type, 2015 to 2032 13.6.1.1.1. On-premise 13.6.1.1.2. Cloud-based 13.6.1.2. Market Size (US$ Million) and Forecast by Component, 2015 to 2032 13.6.1.2.1. Hardware 13.6.1.2.2. Software 13.6.1.2.3. Services 13.6.1.3. Market Size (US$ Million) and Forecast by End-Use Industry, 2015 to 2032 13.6.1.3.1. BFSI 13.6.1.3.2. Healthcare 13.6.1.3.3. Government 13.6.1.3.4. IT and Telecom 13.6.1.3.5. Defense 13.6.1.3.6. Retail 13.6.1.3.7. Others 13.6.2. Rest of South America 13.7. Market Attractiveness Analysis 13.7.1. By Deployment Type 13.7.2. By Component 13.7.3. By End-Use Industry 13.7.4. By Country 14. Competition Landscape 14.1. Market Player - Competition Matrix 14.2. Company Profiles (Details - Overview, Financials, Strategy, SWOT analysis) 14.2.1. Symantec Corporation 14.2.1.1. Company details 14.2.1.2. Company description 14.2.1.3. Business Overview 14.2.1.4. SWOT analysis 14.2.1.5. Financials 14.2.1.6. Strategic Overview 14.2.2. RSA Security 14.2.2.1. Company details 14.2.2.2. Company description 14.2.2.3. Business Overview 14.2.2.4. SWOT analysis 14.2.2.5. Strategic Overview 14.2.3. FireEye, Inc. 14.2.3.1. Company details 14.2.3.2. Company description 14.2.3.3. Business Overview 14.2.3.4. SWOT analysis 14.2.3.5. Financials 14.2.3.6. Strategic Overview 14.2.4. NIKSUN Incorporated 14.2.4.1. Company details 14.2.4.2. Company description 14.2.4.3. Business Overview 14.2.4.4. SWOT analysis 14.2.4.5. Strategic Overview 14.2.5. NETSCOUT Systems Inc. 14.2.5.1. Company details 14.2.5.2. Company description 14.2.5.3. Business Overview 14.2.5.4. SWOT analysis 14.2.5.5. Financials 14.2.5.6. Strategic overview 14.2.6. LogRhythm, Inc. 14.2.6.1. Company details 14.2.6.2. Company description 14.2.6.3. Business Overview 14.2.6.4. SWOT analysis 14.2.6.5. Strategic Overview 14.2.7. IBM Corporation 14.2.7.1. Company details 14.2.7.2. Company description 14.2.7.3. Business Overview 14.2.7.4. SWOT analysis 14.2.7.5. Financials 14.2.7.6. Strategic overview 14.2.8. VIAVI Solutions Inc. 14.2.8.1. Company details 14.2.8.2. Company description 14.2.8.3. Business Overview 14.2.8.4. Financials 14.2.8.5. SWOT analysis 14.2.8.6. Strategic overview 14.2.9. Savvius, Inc. 14.2.9.1. Company details 14.2.9.2. Company description 14.2.9.3. Business Overview 14.2.9.4. SWOT analysis 14.2.9.5. Strategic overview 14.2.10. Cisco System, Inc. 14.2.10.1. Company details 14.2.10.2. Company description 14.2.10.3. Business Overview 14.2.10.4. Financials 14.2.10.5. SWOT analysis 14.2.10.6. Strategic overview
Don't pay for what you don't need
Customize your report by selecting specific countries or regions and save 30%!
Table 01: Global Market Size (US$ Million) Forecast, By Deployment Type, 2015 to 2032 Table 02: Global Market Size (US$ Million) Forecast, By Component, 2015 to 2032 Table 03: Global Market Size (US$ Million) Forecast, By End Use Industry, 2015 to 2032 Table 04: Global Market Size (US$ Million) Forecast, By Region, 2015 to 2032 Table 05: North America Market Size (US$ Million) Forecast, By Deployment Type, 2015 to 2032 Table 06: North America Market Size (US$ Million) Forecast, By Component, 2015 to 2032 Table 07: North America Market Size (US$ Million) Forecast, By End Use Industry, 2015 to 2032 Table 08: North America Market Size (US$ Million) Forecast, By Country, 2015 to 2032 Table 09: USA Market Size (US$ Million) Forecast, By Deployment Type, 2015 to 2032 Table 10: USA Market Size (US$ Million) Forecast, By Component, 2015 to 2032 Table 11: USA Market Size (US$ Million) Forecast, By End Use Industry, 2015 to 2032 Table 12: Canada Market Size (US$ Million) Forecast, By Deployment Type, 2015 to 2032 Table 13: Canada Market Size (US$ Million) Forecast, By Component, 2015 to 2032 Table 14: USA Market Size (US$ Million) Forecast, By End Use Industry, 2015 to 2032 Table 15: Rest of North America Market Size (US$ Million) Forecast, By Deployment Type, 2015 to 2032 Table 16: Rest of North America Market Size (US$ Million) Forecast, By Component, 2015 to 2032 Table 17: USA Market Size (US$ Million) Forecast, By End Use Industry, 2015 to 2032 Table 18: Europe Market Size (US$ Million) Forecast, By Deployment Type, 2015 to 2032 Table 19: Europe Market Size (US$ Million) Forecast, By Component, 2015 to 2032 Table 20: USA Market Size (US$ Million) Forecast, By End Use Industry, 2015 to 2032 Table 21: Europe Market Size (US$ Million) Forecast, By Country, 2015 to 2032 Table 22: UK Market Size (US$ Million) Forecast, By Deployment Type, 2015 to 2032 Table 23: UK Market Size (US$ Million) Forecast, By Component, 2015 to 2032 Table 24: UK Market Size (US$ Million) Forecast, By End Use Industry, 2015 to 2032 Table 25: Germany Market Size (US$ Million) Forecast, By Deployment Type, 2015 to 2032 Table 26: Germany Market Size (US$ Million) Forecast, By Component, 2015 to 2032 Table 27: Germany Market Size (US$ Million) Forecast, By End Use Industry, 2015 to 2032 Table 28: France Market Size (US$ Million) Forecast, By Deployment Type, 2015 to 2032 Table 29: France Market Size (US$ Million) Forecast, By Component, 2015 to 2032 Table 30: France Market Size (US$ Million) Forecast, By End Use Industry, 2015 to 2032 Table 31: Rest of Europe Market Size (US$ Million) Forecast, By Deployment Type, 2015 to 2032 Table 32: Rest of Europe Market Size (US$ Million) Forecast, By Component, 2015 to 2032 Table 33: USA Market Size (US$ Million) Forecast, By End Use Industry, 2015 to 2032 Table 34: Asia Pacific Market Size (US$ Million) Forecast, By Deployment Type, 2015 to 2032 Table 35: Asia Pacific Market Size (US$ Million) Forecast, By Component, 2015 to 2032 Table 36: Asia Pacific Market Size (US$ Million) Forecast, By End Use Industry, 2015 to 2032 Table 37: Asia Pacific Market Size (US$ Million) Forecast, By Country, 2015 to 2032 Table 38: India Market Size (US$ Million) Forecast, By Deployment Type, 2015 to 2032 Table 39: India Market Size (US$ Million) Forecast, By Component, 2015 to 2032 Table 40: India Market Size (US$ Million) Forecast, By End Use Industry, 2015 to 2032 Table 41: China Market Size (US$ Million) Forecast, By Deployment Type, 2015 to 2032 Table 42: China Market Size (US$ Million) Forecast, By Component, 2015 to 2032 Table 43: China Market Size (US$ Million) Forecast, By End Use Industry, 2015 to 2032 Table 44: Japan Market Size (US$ Million) Forecast, By Deployment Type, 2015 to 2032 Table 45: Japan Market Size (US$ Million) Forecast, By Component, 2015 to 2032 Table 46: Japan Market Size (US$ Million) Forecast, By End Use Industry, 2015 to 2032 Table 47: Rest of Asia Pacific Market Size (US$ Million) Forecast, By Deployment Type, 2015 to 2032 Table 48: Rest of Asia Pacific Market Size (US$ Million) Forecast, By Component, 2015 to 2032 Table 49: Rest of Asia Pacific Market Size (US$ Million) Forecast, By End Use Industry, 2015 to 2032 Table 50: Middle East & Africa (MEA) Market Size (US$ Million) Forecast, By Deployment Type, 2015 to 2032 Table 51: Middle East & Africa (MEA) Market Size (US$ Million) Forecast, By Component, 2015 to 2032 Table 52: Middle East & Africa (MEA) Market Size (US$ Million) Forecast, By End Use Industry, 2015 to 2032 Table 53: Middle East & Africa (MEA) Market Size (US$ Million) Forecast, By Country, 2015 to 2032 Table 54: GCC Countries Market Size (US$ Million) Forecast, By Deployment Type, 2015 to 2032 Table 55: GCC Countries Market Size (US$ Million) Forecast, By Component, 2015 to 2032 Table 56: GCC Countries Market Size (US$ Million) Forecast, By End Use Industry, 2015 to 2032 Table 57: South Africa Market Size (US$ Million) Forecast, By Deployment Type, 2015 to 2032 Table 58: South Africa Market Size (US$ Million) Forecast, By Component, 2015 to 2032 Table 59: South Africa Market Size (US$ Million) Forecast, By End Use Industry, 2015 to 2032 Table 60: Rest of MEA Market Size (US$ Million) Forecast, By Deployment Type, 2015 to 2032 Table 61: Rest of MEA Market Size (US$ Million) Forecast, By Component, 2015 to 2032 Table 62: Rest of MEA Market Size (US$ Million) Forecast, By End Use Industry, 2015 to 2032 Table 63: South America Market Size (US$ Million) Forecast, By Deployment Type, 2015 to 2032 Table 64: South America Market Size (US$ Million) Forecast, By Component, 2015 to 2032 Table 65: South America Market Size (US$ Million) Forecast, By End Use Industry, 2015 to 2032 Table 66: South America Market Size (US$ Million) Forecast, By Country, 2015 to 2032 Table 67: Brazil Market Size (US$ Million) Forecast, By Deployment Type, 2015 to 2032 Table 68: Brazil Market Size (US$ Million) Forecast, By Component, 2015 to 2032 Table 69: Brazil Market Size (US$ Million) Forecast, By End Use Industry, 2015 to 2032 Table 70: Rest of South America Market Size (US$ Million) Forecast, By Deployment Type, 2015 to 2032 Table 71: Rest of South America Market Size (US$ Million) Forecast, By Component, 2015 to 2032 Table 72: Rest of South America Market Size (US$ Million) Forecast, By End Use Industry, 2015 to 2032
Figure 01: Network Forensics, Share Analysis Figure 02: Global Market, Revenue 2015 to 2032 (US$) Figure 03: Market Value Share By Deployment Type (2022) Figure 04: Market Value Share By Component (2022) Figure 05: Market Revenue Share By End Use Industry (2022) Figure 06: Market Revenue Share By Region (2022) Figure 07: Global Market Value Share Analysis, By Deployment Type, 2017 to 2032 Figure 08: Deployment Type Comparison Matrix Figure 09: Global Market, Attractiveness Analysis, By Deployment Type (2022) Figure 10: Global Market Value Share Analysis, By Component, 2017 to 2032 Figure 11: Comparison Matrix, By Component Figure 12: Global Market, Attractiveness Analysis, By End - Use Industry Figure 13: Global Market Value Share Analysis, By End Use Industry, 2017 to 2032 Figure 14: Comparison Matrix, By End Use Industry Figure 15: Global Market, Attractiveness Analysis, By End Use Industry Figure 16: Global Market Value Share Analysis, By Region, 2017 to 2032 Figure 17: Global Market, Attractiveness Analysis, By Region Figure 18: North America Market Revenue Share Analysis, by Deployment Type, 2017 to 2032 Figure 19: North America Market Revenue Share Analysis, by Component, 2017 to 2032 Figure 20: North America Market Value Share Analysis, By End Use Industry, 2017 to 2032 Figure 21: North America Revenue Share Analysis, By Country, 2017 to 2032 Figure 22: USA Market Revenue Share Analysis, By Deployment Type, 2017 to 2032 Figure 23: USA Market Revenue Share Analysis, By Component, 2017 to 2032 Figure 24: USA Market Value Share Analysis, By End Use Industry, 2017 to 2032 Figure 25: Canada Market Revenue Share Analysis, By Deployment Type, 2017 to 2032 Figure 26: Canada Market Revenue Share Analysis, By Component, 2017 to 2032 Figure 27: Canada Market Value Share Analysis, By End Use Industry, 2017 to 2032 Figure 28: Market, Attractiveness Analysis, By Deployment Figure 29: Market, Attractiveness Analysis, By End Component Figure 30: Market, Attractiveness Analysis, By End Use Industry Figure 31: Market, Attractiveness Analysis, By Country Figure 32: Europe Market Revenue Share Analysis, by Deployment Type, 2017 to 2032 Figure 33: Europe Market Revenue Share Analysis, by Component, 2017 to 2032 Figure 34: Europe Market Value Share Analysis, By End Use Industry, 2017 to 2032 Figure 35: Europe Revenue Share Analysis, By Country, 2017 to 2032 Figure 36: UK Market Revenue Share Analysis, By Deployment Type, 2017 to 2032 Figure 37: UK Market Revenue Share Analysis, By Component, 2017 to 2032 Figure 38: UK Market Value Share Analysis, By End Use Industry, 2017 to 2032 Figure 39: Germany Market Revenue Share Analysis, By Deployment Type, 2017 to 2032 Figure 40: Germany Market Revenue Share Analysis, By Component, 2017 to 2032 Figure 41: Germany Market Value Share Analysis, By End Use Industry, 2017 to 2032 Figure 42: France Market Revenue Share Analysis, By Deployment Type, 2017 to 2032 Figure 43: France Market Revenue Share Analysis, By Component, 2017 to 2032 Figure 44: France Market Value Share Analysis, By End Use Industry, 2017 to 2032 Figure 45: Market, Attractiveness Analysis, By Deployment Figure 46: Market, Attractiveness Analysis, By End Component Figure 47: Market, Attractiveness Analysis, By End Use Industry Figure 48: Market, Attractiveness Analysis, By Country Figure 49: Asia Pacific Market Revenue Share Analysis, by Deployment Type, 2017 to 2032 Figure 50: Asia Pacific Market Revenue Share Analysis, by Component, 2017 to 2032 Figure 51: Asia Pacific Market Value Share Analysis, By End Use Industry, 2017 to 2032 Figure 52: Asia Pacific Revenue Share Analysis, By Country, 2017 to 2032 Figure 53: India Market Revenue Share Analysis, By Deployment Type, 2017 to 2032 Figure 54: India Market Revenue Share Analysis, By Component, 2017 to 2032 Figure 55: India Market Value Share Analysis, By End Use Industry, 2017 to 2032 Figure 56: China Market Revenue Share Analysis, By Deployment Type, 2017 to 2032 Figure 57: China Market Revenue Share Analysis, By Component, 2017 to 2032 Figure 58: China Market Value Share Analysis, By End Use Industry, 2017 to 2032 Figure 59: Japan Market Revenue Share Analysis, By Deployment Type, 2017 to 2032 Figure 60: Japan Market Revenue Share Analysis, By Component, 2017 to 2032 Figure 61: Japan Market Value Share Analysis, By End Use Industry, 2017 to 2032 Figure 62: Market, Attractiveness Analysis, By Deployment Figure 63: Market, Attractiveness Analysis, By End Component Figure 64: Market, Attractiveness Analysis, By End Use Industry Figure 65: Market, Attractiveness Analysis, By Country Figure 66: Middle East & Africa (MEA) Market Revenue Share Analysis, by Deployment Type, 2017 to 2032 Figure 67: Middle East & Africa (MEA) Market Revenue Share Analysis, by Component, 2017 to 2032 Figure 68: Middle East & Africa (MEA) Market Value Share Analysis, By End Use Industry, 2017 to 2032 Figure 69: Middle East & Africa (MEA) Market Revenue Share Analysis, By Country, 2017 to 2032 Figure 70: GCC Countries Market Revenue Share Analysis, By Deployment Type, 2017 to 2032 Figure 71: GCC Countries Market Revenue Share Analysis, By Component, 2017 to 2032 Figure 72: GCC Countries Market Value Share Analysis, By End Use Industry, 2017 to 2032 Figure 73: South Africa Market Revenue Share Analysis, By Deployment Type, 2017 to 2032 Figure 74: South Africa Market Revenue Share Analysis, By Component, 2017 to 2032 Figure 75: South Africa Market Value Share Analysis, By End Use Industry, 2017 to 2032 Figure 76: Market, Attractiveness Analysis, By Deployment Figure 77: Market, Attractiveness Analysis, By End Component Figure 78: Market, Attractiveness Analysis, By End Use Industry Figure 79: Market, Attractiveness Analysis, By Country Figure 80: South America Market Revenue Share Analysis, by Deployment Type, 2017 to 2032 Figure 81: South America Market Revenue Share Analysis, by Component, 2017 to 2032 Figure 82: South America Market Value Share Analysis, By End Use Industry, 2017 to 2032 Figure 83: South America Revenue Share Analysis, By Country, 2017 to 2032 Figure 84: Brazil Market Revenue Share Analysis, By Deployment Type, 2017 to 2032 Figure 85: Brazil Market Revenue Share Analysis, By Component, 2017 to 2032 Figure 86: Brazil Market Value Share Analysis, By End Use Industry, 2017 to 2032 Figure 87: Market, Attractiveness Analysis, By Deployment Figure 88: Market, Attractiveness Analysis, By End Component Figure 89: Market, Attractiveness Analysis, By End Use Industry Figure 90: Market, Attractiveness Analysis, By Country Figure 91: Global Market Positioning of Key Players (2022)
Recommendations
Explore Technology Insights
View Reports