Reports

- Global Locations -

Headquarters

Future Market Insights, Inc.

Christiana Corporate, 200
Continental Drive, Suite 401,
Newark, Delaware - 19713,
United States

T: +1-845-579-5705

Americas

Future Market Insights, Inc.

616 Corporate Way, Suite 2-9018,
Valley Cottage, NY 10989, United States

T: +1-347-918-3531

MEA

Future Market Insights

1602-6 Jumeirah Bay X2 Tower, Plot No: JLT-PH2-X2A,
Jumeirah Lakes Towers, Dubai,
United Arab Emirates

Europe

Future Market Insights

3rd Floor, 207 Regent Street,
W1B 3HH London
United Kingdom

T: + 44 (0) 20 8123 9659
D: +44 (0) 20 3287 4268

Asia Pacific

Future Market Insights

IndiaLand Global Tech Park, Unit UG-1, Behind Grand HighStreet, Phase 1, Hinjawadi, MH, Pune – 411057, India

Network File System Market Outlook (2022-2032)

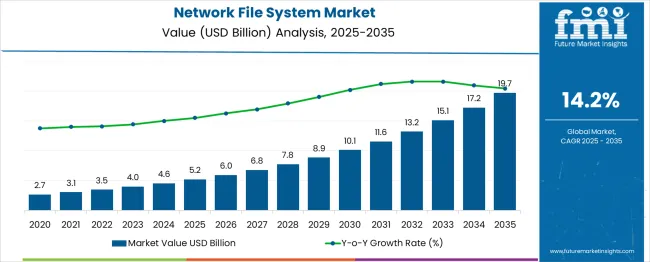
[342 Pages Report] The network file system market is anticipated to rise to a valuation of US$ 3.5 Billion in 2022 and is likely to reach US$ 13.5 Billion by 2032. It is likely to grow with a CAGR of 14.2% during the forecast period from 2022 to 2032.

Report Attribute Details
Network File System Market Value (2022) US$ 3.5 Billion
Network File System Market Anticipated Forecast Value (2032) US$ 13.5 Billion
Network File System Market Projected Growth Rate (2022-2032) 14.2%

Network file system market share is likely to rise as the network file system is widely used for business processes in enterprises to allow users to access a file from the desktop of their clients. The IT needs of an organization that includes storing, process and serving a large amount of data on a server are anticipated to generate the demand for network file system during the forecast period.

As business processes are becoming complex, there is a notable surge in demand for data centres, resulting in the evolvement of multi-tenant data centres, which is likely to increase the adoption of network file system. The network file system caters to multiple clients with a single instance of a software application, with clients having a shared affinity at some level, which is further likely to propel the demand for network file system.

The network file system enables sharing of information with client in a prompt and seamless manner, thereby leading to the rise in the network file system market growth.

The demand for network file system increases as it is further used in various operating systems, allowing remote procedures calls and is a low-cost system. It also allows the storage of all files locally on the hard disk & reduce the storage problem. Due to such benefits the network file system market size is likely to rise during the forecast period.

The network file system transfers large data files with high performance and less latency, which is likely to increase the sales of network file system during the forecast period. Different sectors such as IT, Telecommunications, BSFI, Logistics, Transportation, Healthcare, Manufacturing and others are likely to boost the network file system market growth due to widespread use of the network file system to secure their data.

Don't pay for what you don't need

Customize your report by selecting specific countries or regions and save 30%!

What Are Some Of The Factors Influencing The Network File System Market?

The ever-growing internet traffic is the major driver in the network file system market share during the forecast period. Moreover, factors such as continuous up-gradation in data centres, resulting in obsolescence in existing data centres, is likely to the demand for network file system.

Quick response, deployment, and technical advancements are also some important factors are like to influence the network file system market during the forecast period. However, data security concerns and inflexibility are some challenges faced in the network file system, which decline the network file system market during the forecasted period. Another factor that can restrain the growth of the network file system market is reduction in the data inconsistency.

As per the FMI report, the key industries play a vital role all around the regions that growing the network file system market share during the forecast period from 2022 to 2032. Based on the product segment, it is further categorised into NFSv3, NFSv4, NFSv2 and others that are likely to rise in the network file system market size during the forecast period as per network file system market report.

The market is supposed to fluctuate at the time of COVID-19 situations & start again with the same speed with the help of market participants including vendors, distributors, suppliers, manufacturers, and end-users to raise the lion’s share in the network file system market growth.

The network file system delivers more with few resources resulting in the reduction of the capital expenditures in data centres. Companies are adopting the network file system infrastructure as it also caters for the need for a quick response in business processes are likely to increase the adoption of network file system in the coming period.
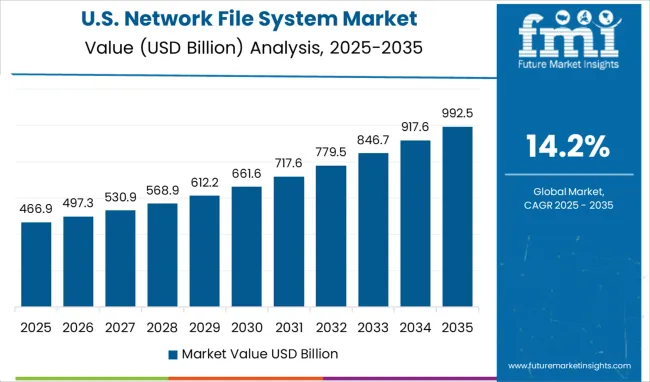
How Is The Performance Of The North America Network File System Market?

North America region holds a prominent share in the network file system market growth due to the presence of a wide variety of end-user enterprises and a competitive environment in the region during the forecast period from 2022 to 2032.

It acquires 32.6% of the share in the global network file system market size during the forecast period. The various industries are likely to grow the North American network file system market analysis.
Sudip Saha
Sudip Saha

Principal Consultant

Talk to Analyst

Find your sweet spots for generating winning opportunities in this market.

How Will The Europe Network File System Market Grow?

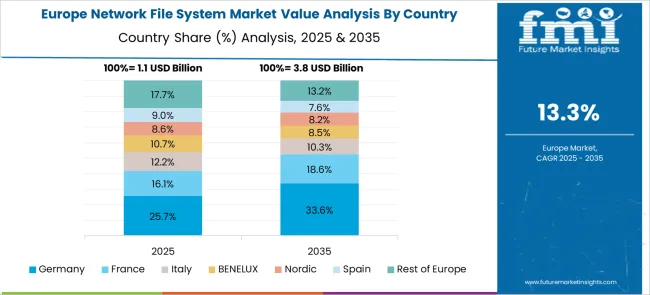
In Europe, the network file system market is likely to grow at a significant pace due to the rise in business demands and IT needs. Europe placed in the second position in the network file system market by acquiring 21.7% of the share in the network file system market. The adoption of network file system rising due to the large-scale outsourcing of managed hosting services in this region during the forecast period from 2022 to 2032.

How Is The Start-Up Ecosystem In The Network File System Market?

The network file system is allowed to share the file & data among the client by providing centralized administration and data security, which are likely to grow the network file market key trends & opportunities in the recent year.

The network file system uses in several application operating systems including macOS, Linus and Unix which are used in almost every enterprise leading to an increase in the network file system market size.

The adoption of network file system allows the users to make use of a single file which gives the available information, latest trends using the same file are anticipated to grow the network file system future trends during the forecast period from 2022 to 2032.

Get the data you need at a Fraction of the cost

Personalize your report by choosing insights you need
and save 40%!

Who Are Some Of The Key Competitors In The Network File System Market?

CenturyLink, Cisco, IBM Corporation, Digital Realty, Equinix, Inc., RACKSPACE, Global Switch, Level 3 Communications, and NTT Communications Corporation, are some of the key players in the network file system market.

Other prominent players in this market include Ascenty, AT&T, CentriLogic, China Telecom, CtrlS Datacenters, Cyrus, Expedient Data Centers, Telefonica, Telehouse (KDDI), Datapipe, Digiplex, DuPont Fabros, Fujitsu, HCL, Interoute Communications, Interxion, IO, NaviSite, PCCW Global, Singtel, Telstra International, Verizon Enterprise, and Zayo Group.

Recent Development in Network File System Market are:

  • On 26 January 2021, a software leading company named DataCore software acquired Caringo Inc to offer various software storage solutions for an object, file and block from a single vendor. It helps DataCore software to add expertise and talent in this acquisition for their customers.

Report Scope

Report Attribute Details
Growth Rate CAGR of 14.2% from 2022 to 2032
Base Year for Estimation 2021
Historical Data 2016-2021
Forecast Period 2022-2032
Quantitative Units Revenue in USD Million and CAGR from 2022-2032
Report Coverage Revenue Forecast, Volume Forecast, Company Ranking, Competitive Landscape, Growth Factors, Trends and Pricing Analysis
Segments Covered
  • Enterprise Size
  • Version
  • Features
  • Region
Regions Covered
  • North America
  • Latin America
  • Europe
  • East Asia
  • South Asia
  • Oceania
  • Middle East and Africa
Key Countries Profiled
  • USA
  • Canada
  • Brazil
  • Argentina
  • Germany
  • UK
  • France
  • Spain
  • Italy
  • Nordics
  • BENELUX
  • Australia & New Zealand
  • China
  • India
  • ASEAN
  • GCC
  • South Africa
Key Companies Profiled
Customization Available Upon Request

Segments

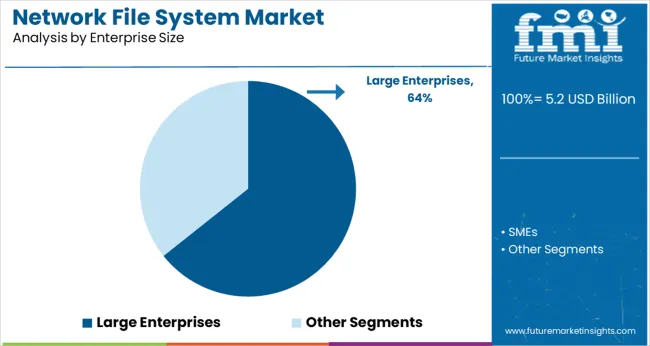
By Enterprise Size:

  • SMEs
  • Large Enterprises

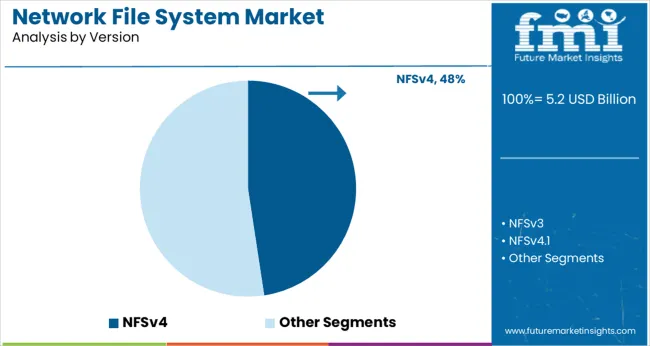
By Version:

  • NFSv3
  • NFSv4
  • NFSv4.1
  • NFSv4.2

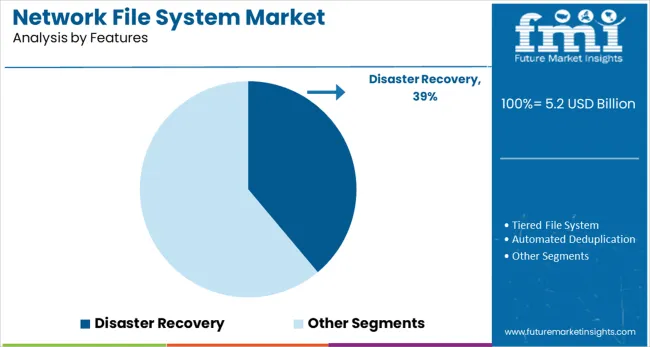
By Features:

  • Tiered File System
  • Disaster Recovery
  • Automated Deduplication
  • Others

By Region:

  • North America
  • Latin America
  • Europe
  • Asia Pacific
  • MEA
     

Frequently Asked Questions

What is the Growth Outlook for the Network File System Market?

The network file system market is likely to advance at a CAGR of 14.2% through 2032.

Which Region Holds the Network File System Market Share?

The North American region holds a network file system market share of 32.6% by 2032.

What is the Current Valuation of the Network File System Market?

The network file system market is anticipated to expect US$ 3.5 Billion in 2022.

What is the Future of the Network File System Market?

The network file system market is expected to account for US$ 13.5 Billion by 2032.

Table of Content

1. Executive Summary

    1.1. Global Market Outlook

    1.2. Demand-side Trends

    1.3. Supply-side Trends

    1.4. Technology Roadmap Analysis

    1.5. Analysis and Recommendations

2. Market Overview

    2.1. Market Coverage / Taxonomy

    2.2. Market Definition / Scope / Limitations

3. Market Background

    3.1. Market Dynamics

        3.1.1. Drivers

        3.1.2. Restraints

        3.1.3. Opportunity

        3.1.4. Trends

    3.2. Scenario Forecast

        3.2.1. Demand in Optimistic Scenario

        3.2.2. Demand in Likely Scenario

        3.2.3. Demand in Conservative Scenario

    3.3. Opportunity Map Analysis

    3.4. Investment Feasibility Matrix

    3.5. PESTLE and Porter’s Analysis

    3.6. Regulatory Landscape

        3.6.1. By Key Regions

        3.6.2. By Key Countries

    3.7. Regional Parent Market Outlook

4. Global Network File System Market Analysis 2017-2021 and Forecast, 2022-2032

    4.1. Historical Market Size Value (US$ Mn) Analysis, 2017-2021

    4.2. Current and Future Market Size Value (US$ Mn) Projections, 2022-2032

        4.2.1. Y-o-Y Growth Trend Analysis

        4.2.2. Absolute $ Opportunity Analysis

5. Global Network File System Market Analysis 2017-2021 and Forecast 2022-2032, By Enterprise Size

    5.1. Introduction / Key Findings

    5.2. Historical Market Size Value (US$ Mn) Analysis By Enterprise Size, 2017-2021

    5.3. Current and Future Market Size Value (US$ Mn) Analysis and Forecast By Enterprise Size, 2022-2032

        5.3.1. SMEs

        5.3.2. Large Enterprises

    5.4. Y-o-Y Growth Trend Analysis By Enterprise Size, 2017-2021

    5.5. Absolute $ Opportunity Analysis By Enterprise Size, 2022-2032

6. Global Network File System Market Analysis 2017-2021 and Forecast 2022-2032, By Version

    6.1. Introduction / Key Findings

    6.2. Historical Market Size Value (US$ Mn) Analysis By Version, 2017-2021

    6.3. Current and Future Market Size Value (US$ Mn) Analysis and Forecast By Version, 2022-2032

        6.3.1. NFSv3

        6.3.2. NFSv4

        6.3.3. NFSv4.1

        6.3.4. NFSv4.2

    6.4. Y-o-Y Growth Trend Analysis By Version, 2017-2021

    6.5. Absolute $ Opportunity Analysis By Version, 2022-2032

7. Global Network File System Market Analysis 2017-2021 and Forecast 2022-2032, By Features

    7.1. Introduction / Key Findings

    7.2. Historical Market Size Value (US$ Mn) Analysis By Features, 2017-2021

    7.3. Current and Future Market Size Value (US$ Mn) Analysis and Forecast By Features, 2022-2032

        7.3.1. Tiered File System

        7.3.2. Disaster Recovery

        7.3.3. Automated Deduplication

        7.3.4. Others

    7.4. Y-o-Y Growth Trend Analysis By Features, 2017-2021

    7.5. Absolute $ Opportunity Analysis By Features, 2022-2032

8. Global Network File System Market Analysis 2017-2021 and Forecast 2022-2032, By Region

    8.1. Introduction

    8.2. Historical Market Size Value (US$ Mn) Analysis By Region, 2017-2021

    8.3. Current Market Size Value (US$ Mn) Analysis and Forecast By Region, 2022-2032

        8.3.1. North America

        8.3.2. Latin America

        8.3.3. Europe

        8.3.4. Asia Pacific

        8.3.5. MEA

    8.4. Market Attractiveness Analysis By Region

9. North America Network File System Market Analysis 2017-2021 and Forecast 2022-2032, By Country

    9.1. Historical Market Size Value (US$ Mn) Trend Analysis By Market Taxonomy, 2017-2021

    9.2. Market Size Value (US$ Mn) Forecast By Market Taxonomy, 2022-2032

        9.2.1. By Country

            9.2.1.1. US

            9.2.1.2. Canada

        9.2.2. By Enterprise Size

        9.2.3. By Version

        9.2.4. By Features

    9.3. Market Attractiveness Analysis

        9.3.1. By Country

        9.3.2. By Enterprise Size

        9.3.3. By Version

        9.3.4. By Features

    9.4. Key Takeaways

10. Latin America Network File System Market Analysis 2017-2021 and Forecast 2022-2032, By Country

    10.1. Historical Market Size Value (US$ Mn) Trend Analysis By Market Taxonomy, 2017-2021

    10.2. Market Size Value (US$ Mn) Forecast By Market Taxonomy, 2022-2032

        10.2.1. By Country

            10.2.1.1. Brazil

            10.2.1.2. Mexico

            10.2.1.3. Rest of Latin America

        10.2.2. By Enterprise Size

        10.2.3. By Version

        10.2.4. By Features

    10.3. Market Attractiveness Analysis

        10.3.1. By Country

        10.3.2. By Enterprise Size

        10.3.3. By Version

        10.3.4. By Features

    10.4. Key Takeaways

11. Europe Network File System Market Analysis 2017-2021 and Forecast 2022-2032, By Country

    11.1. Historical Market Size Value (US$ Mn) Trend Analysis By Market Taxonomy, 2017-2021

    11.2. Market Size Value (US$ Mn) Forecast By Market Taxonomy, 2022-2032

        11.2.1. By Country

            11.2.1.1. Germany

            11.2.1.2. U.K.

            11.2.1.3. France

            11.2.1.4. Spain

            11.2.1.5. Italy

            11.2.1.6. Rest of Europe

        11.2.2. By Enterprise Size

        11.2.3. By Version

        11.2.4. By Features

    11.3. Market Attractiveness Analysis

        11.3.1. By Country

        11.3.2. By Enterprise Size

        11.3.3. By Version

        11.3.4. By Features

    11.4. Key Takeaways

12. Asia Pacific Network File System Market Analysis 2017-2021 and Forecast 2022-2032, By Country

    12.1. Historical Market Size Value (US$ Mn) Trend Analysis By Market Taxonomy, 2017-2021

    12.2. Market Size Value (US$ Mn) Forecast By Market Taxonomy, 2022-2032

        12.2.1. By Country

            12.2.1.1. China

            12.2.1.2. Japan

            12.2.1.3. South Korea

            12.2.1.4. Rest of Asia Pacific

        12.2.2. By Enterprise Size

        12.2.3. By Version

        12.2.4. By Features

    12.3. Market Attractiveness Analysis

        12.3.1. By Country

        12.3.2. By Enterprise Size

        12.3.3. By Version

        12.3.4. By Features

    12.4. Key Takeaways

13. MEA Network File System Market Analysis 2017-2021 and Forecast 2022-2032, By Country

    13.1. Historical Market Size Value (US$ Mn) Trend Analysis By Market Taxonomy, 2017-2021

    13.2. Market Size Value (US$ Mn) Forecast By Market Taxonomy, 2022-2032

        13.2.1. By Country

            13.2.1.1. GCC Countries

            13.2.1.2. South Africa

            13.2.1.3. Israel

            13.2.1.4. Rest of MEA

        13.2.2. By Enterprise Size

        13.2.3. By Version

        13.2.4. By Features

    13.3. Market Attractiveness Analysis

        13.3.1. By Country

        13.3.2. By Enterprise Size

        13.3.3. By Version

        13.3.4. By Features

    13.4. Key Takeaways

14. Key Countries Network File System Market Analysis

    14.1. US

        14.1.1. Pricing Analysis

        14.1.2. Market Share Analysis, 2021

            14.1.2.1. By Enterprise Size

            14.1.2.2. By Version

            14.1.2.3. By Features

    14.2. Canada

        14.2.1. Pricing Analysis

        14.2.2. Market Share Analysis, 2021

            14.2.2.1. By Enterprise Size

            14.2.2.2. By Version

            14.2.2.3. By Features

    14.3. Brazil

        14.3.1. Pricing Analysis

        14.3.2. Market Share Analysis, 2021

            14.3.2.1. By Enterprise Size

            14.3.2.2. By Version

            14.3.2.3. By Features

    14.4. Mexico

        14.4.1. Pricing Analysis

        14.4.2. Market Share Analysis, 2021

            14.4.2.1. By Enterprise Size

            14.4.2.2. By Version

            14.4.2.3. By Features

    14.5. Germany

        14.5.1. Pricing Analysis

        14.5.2. Market Share Analysis, 2021

            14.5.2.1. By Enterprise Size

            14.5.2.2. By Version

            14.5.2.3. By Features

    14.6. U.K.

        14.6.1. Pricing Analysis

        14.6.2. Market Share Analysis, 2021

            14.6.2.1. By Enterprise Size

            14.6.2.2. By Version

            14.6.2.3. By Features

    14.7. France

        14.7.1. Pricing Analysis

        14.7.2. Market Share Analysis, 2021

            14.7.2.1. By Enterprise Size

            14.7.2.2. By Version

            14.7.2.3. By Features

    14.8. Spain

        14.8.1. Pricing Analysis

        14.8.2. Market Share Analysis, 2021

            14.8.2.1. By Enterprise Size

            14.8.2.2. By Version

            14.8.2.3. By Features

    14.9. Italy

        14.9.1. Pricing Analysis

        14.9.2. Market Share Analysis, 2021

            14.9.2.1. By Enterprise Size

            14.9.2.2. By Version

            14.9.2.3. By Features

    14.10. China

        14.10.1. Pricing Analysis

        14.10.2. Market Share Analysis, 2021

            14.10.2.1. By Enterprise Size

            14.10.2.2. By Version

            14.10.2.3. By Features

    14.11. Japan

        14.11.1. Pricing Analysis

        14.11.2. Market Share Analysis, 2021

            14.11.2.1. By Enterprise Size

            14.11.2.2. By Version

            14.11.2.3. By Features

    14.12. South Korea

        14.12.1. Pricing Analysis

        14.12.2. Market Share Analysis, 2021

            14.12.2.1. By Enterprise Size

            14.12.2.2. By Version

            14.12.2.3. By Features

    14.13. GCC Countries

        14.13.1. Pricing Analysis

        14.13.2. Market Share Analysis, 2021

            14.13.2.1. By Enterprise Size

            14.13.2.2. By Version

            14.13.2.3. By Features

    14.14. South Africa

        14.14.1. Pricing Analysis

        14.14.2. Market Share Analysis, 2021

            14.14.2.1. By Enterprise Size

            14.14.2.2. By Version

            14.14.2.3. By Features

    14.15. Israel

        14.15.1. Pricing Analysis

        14.15.2. Market Share Analysis, 2021

            14.15.2.1. By Enterprise Size

            14.15.2.2. By Version

            14.15.2.3. By Features

15. Market Structure Analysis

    15.1. Competition Dashboard

    15.2. Competition Benchmarking

    15.3. Market Share Analysis of Top Players

        15.3.1. By Regional

        15.3.2. By Enterprise Size

        15.3.3. By Version

        15.3.4. By Features

16. Competition Analysis

    16.1. Competition Deep Dive

        16.1.1. Oracle

            16.1.1.1. Overview

            16.1.1.2. Product Portfolio

            16.1.1.3. Profitability by Market Segments

            16.1.1.4. Sales Footprint

            16.1.1.5. Strategy Overview

                16.1.1.5.1. Marketing Strategy

        16.1.2. DataCore Software

            16.1.2.1. Overview

            16.1.2.2. Product Portfolio

            16.1.2.3. Profitability by Market Segments

            16.1.2.4. Sales Footprint

            16.1.2.5. Strategy Overview

                16.1.2.5.1. Marketing Strategy

        16.1.3. F5

            16.1.3.1. Overview

            16.1.3.2. Product Portfolio

            16.1.3.3. Profitability by Market Segments

            16.1.3.4. Sales Footprint

            16.1.3.5. Strategy Overview

                16.1.3.5.1. Marketing Strategy

        16.1.4. Datto 

            16.1.4.1. Overview

            16.1.4.2. Product Portfolio

            16.1.4.3. Profitability by Market Segments

            16.1.4.4. Sales Footprint

            16.1.4.5. Strategy Overview

                16.1.4.5.1. Marketing Strategy

        16.1.5. Cloudian

            16.1.5.1. Overview

            16.1.5.2. Product Portfolio

            16.1.5.3. Profitability by Market Segments

            16.1.5.4. Sales Footprint

            16.1.5.5. Strategy Overview

                16.1.5.5.1. Marketing Strategy

        16.1.6. DataDirect Networks

            16.1.6.1. Overview

            16.1.6.2. Product Portfolio

            16.1.6.3. Profitability by Market Segments

            16.1.6.4. Sales Footprint

            16.1.6.5. Strategy Overview

                16.1.6.5.1. Marketing Strategy

        16.1.7. Hitachi Vantara

            16.1.7.1. Overview

            16.1.7.2. Product Portfolio

            16.1.7.3. Profitability by Market Segments

            16.1.7.4. Sales Footprint

            16.1.7.5. Strategy Overview

                16.1.7.5.1. Marketing Strategy

        16.1.8. Huawei Technologies

            16.1.8.1. Overview

            16.1.8.2. Product Portfolio

            16.1.8.3. Profitability by Market Segments

            16.1.8.4. Sales Footprint

            16.1.8.5. Strategy Overview

                16.1.8.5.1. Marketing Strategy

        16.1.9. IBM 

            16.1.9.1. Overview

            16.1.9.2. Product Portfolio

            16.1.9.3. Profitability by Market Segments

            16.1.9.4. Sales Footprint

            16.1.9.5. Strategy Overview

                16.1.9.5.1. Marketing Strategy

        16.1.10. Pure Storage

            16.1.10.1. Overview

            16.1.10.2. Product Portfolio

            16.1.10.3. Profitability by Market Segments

            16.1.10.4. Sales Footprint

            16.1.10.5. Strategy Overview

                16.1.10.5.1. Marketing Strategy

17. Assumptions & Acronyms Used

18. Research Methodology

Don't pay for what you don't need

Customize your report by selecting specific countries or regions and save 30%!

List of Tables

Table 01: Global Network File System Market Value (US$ Mn) Forecast by Region, 2017-2032

Table 02: Global Network File System Market Value (US$ Mn) Forecast by Enterprise Size, 2017-2032

Table 03: Global Network File System Market Value (US$ Mn) Forecast by Version, 2017-2032

Table 04: Global Network File System Market Value (US$ Mn) Forecast by Features, 2017-2032

Table 05: North America Network File System Market Value (US$ Mn) Forecast by Country, 2017-2032

Table 06: North America Network File System Market Value (US$ Mn) Forecast by Enterprise Size, 2017-2032

Table 07: North America Network File System Market Value (US$ Mn) Forecast by Version, 2017-2032

Table 08: North America Network File System Market Value (US$ Mn) Forecast by Features, 2017-2032

Table 09: Latin America Network File System Market Value (US$ Mn) Forecast by Country, 2017-2032

Table 10: Latin America Network File System Market Value (US$ Mn) Forecast by Enterprise Size, 2017-2032

Table 11: Latin America Network File System Market Value (US$ Mn) Forecast by Version, 2017-2032

Table 12: Latin America Network File System Market Value (US$ Mn) Forecast by Features, 2017-2032

Table 13: Europe Network File System Market Value (US$ Mn) Forecast by Country, 2017-2032

Table 14: Europe Network File System Market Value (US$ Mn) Forecast by Enterprise Size, 2017-2032

Table 15: Europe Network File System Market Value (US$ Mn) Forecast by Version, 2017-2032

Table 16: Europe Network File System Market Value (US$ Mn) Forecast by Features, 2017-2032

Table 17: Asia Pacific Network File System Market Value (US$ Mn) Forecast by Country, 2017-2032

Table 18: Asia Pacific Network File System Market Value (US$ Mn) Forecast by Enterprise Size, 2017-2032

Table 19: Asia Pacific Network File System Market Value (US$ Mn) Forecast by Version, 2017-2032

Table 20: Asia Pacific Network File System Market Value (US$ Mn) Forecast by Features, 2017-2032

Table 21: MEA Network File System Market Value (US$ Mn) Forecast by Country, 2017-2032

Table 22: MEA Network File System Market Value (US$ Mn) Forecast by Enterprise Size, 2017-2032

Table 23: MEA Network File System Market Value (US$ Mn) Forecast by Version, 2017-2032

Table 24: MEA Network File System Market Value (US$ Mn) Forecast by Features, 2017-2032
Sudip Saha
Sudip Saha

Principal Consultant

Talk to Analyst

Find your sweet spots for generating winning opportunities in this market.

List of Charts

Figure 01: Global Network File System Market Value (US$ Mn) by Enterprise Size, 2022-2032

Figure 02: Global Network File System Market Value (US$ Mn) by Version, 2022-2032

Figure 03: Global Network File System Market Value (US$ Mn) by Features, 2022-2032

Figure 04: Global Network File System Market Value (US$ Mn) by Region, 2022-2032

Figure 05: Global Network File System Market Value (US$ Mn) Analysis by Region, 2017-2032

Figure 06: Global Network File System Market Value Share (%) and BPS Analysis by Region, 2022-2032

Figure 07: Global Network File System Market Y-o-Y Growth (%) Projections by Region, 2022-2032

Figure 08: Global Network File System Market Value (US$ Mn) Analysis by Enterprise Size, 2017-2032

Figure 09: Global Network File System Market Value Share (%) and BPS Analysis by Enterprise Size, 2022-2032

Figure 10: Global Network File System Market Y-o-Y Growth (%) Projections by Enterprise Size, 2022-2032

Figure 11: Global Network File System Market Value (US$ Mn) Analysis by Version, 2017-2032

Figure 12: Global Network File System Market Value Share (%) and BPS Analysis by Version, 2022-2032

Figure 13: Global Network File System Market Y-o-Y Growth (%) Projections by Version, 2022-2032

Figure 14: Global Network File System Market Value (US$ Mn) Analysis by Features, 2017-2032

Figure 15: Global Network File System Market Value Share (%) and BPS Analysis by Features, 2022-2032

Figure 16: Global Network File System Market Y-o-Y Growth (%) Projections by Features, 2022-2032

Figure 17: Global Network File System Market Attractiveness by Enterprise Size, 2022-2032

Figure 18: Global Network File System Market Attractiveness by Version, 2022-2032

Figure 19: Global Network File System Market Attractiveness by Features, 2022-2032

Figure 20: Global Network File System Market Attractiveness by Region, 2022-2032

Figure 21: North America Network File System Market Value (US$ Mn) by Enterprise Size, 2022-2032

Figure 22: North America Network File System Market Value (US$ Mn) by Version, 2022-2032

Figure 23: North America Network File System Market Value (US$ Mn) by Features, 2022-2032

Figure 24: North America Network File System Market Value (US$ Mn) by Country, 2022-2032

Figure 25: North America Network File System Market Value (US$ Mn) Analysis by Country, 2017-2032

Figure 26: North America Network File System Market Value Share (%) and BPS Analysis by Country, 2022-2032

Figure 27: North America Network File System Market Y-o-Y Growth (%) Projections by Country, 2022-2032

Figure 28: North America Network File System Market Value (US$ Mn) Analysis by Enterprise Size, 2017-2032

Figure 29: North America Network File System Market Value Share (%) and BPS Analysis by Enterprise Size, 2022-2032

Figure 30: North America Network File System Market Y-o-Y Growth (%) Projections by Enterprise Size, 2022-2032

Figure 31: North America Network File System Market Value (US$ Mn) Analysis by Version, 2017-2032

Figure 32: North America Network File System Market Value Share (%) and BPS Analysis by Version, 2022-2032

Figure 33: North America Network File System Market Y-o-Y Growth (%) Projections by Version, 2022-2032

Figure 34: North America Network File System Market Value (US$ Mn) Analysis by Features, 2017-2032

Figure 35: North America Network File System Market Value Share (%) and BPS Analysis by Features, 2022-2032

Figure 36: North America Network File System Market Y-o-Y Growth (%) Projections by Features, 2022-2032

Figure 37: North America Network File System Market Attractiveness by Enterprise Size, 2022-2032

Figure 38: North America Network File System Market Attractiveness by Version, 2022-2032

Figure 39: North America Network File System Market Attractiveness by Features, 2022-2032

Figure 40: North America Network File System Market Attractiveness by Country, 2022-2032

Figure 41: Latin America Network File System Market Value (US$ Mn) by Enterprise Size, 2022-2032

Figure 42: Latin America Network File System Market Value (US$ Mn) by Version, 2022-2032

Figure 43: Latin America Network File System Market Value (US$ Mn) by Features, 2022-2032

Figure 44: Latin America Network File System Market Value (US$ Mn) by Country, 2022-2032

Figure 45: Latin America Network File System Market Value (US$ Mn) Analysis by Country, 2017-2032

Figure 46: Latin America Network File System Market Value Share (%) and BPS Analysis by Country, 2022-2032

Figure 47: Latin America Network File System Market Y-o-Y Growth (%) Projections by Country, 2022-2032

Figure 48: Latin America Network File System Market Value (US$ Mn) Analysis by Enterprise Size, 2017-2032

Figure 49: Latin America Network File System Market Value Share (%) and BPS Analysis by Enterprise Size, 2022-2032

Figure 50: Latin America Network File System Market Y-o-Y Growth (%) Projections by Enterprise Size, 2022-2032

Figure 51: Latin America Network File System Market Value (US$ Mn) Analysis by Version, 2017-2032

Figure 52: Latin America Network File System Market Value Share (%) and BPS Analysis by Version, 2022-2032

Figure 53: Latin America Network File System Market Y-o-Y Growth (%) Projections by Version, 2022-2032

Figure 54: Latin America Network File System Market Value (US$ Mn) Analysis by Features, 2017-2032

Figure 55: Latin America Network File System Market Value Share (%) and BPS Analysis by Features, 2022-2032

Figure 56: Latin America Network File System Market Y-o-Y Growth (%) Projections by Features, 2022-2032

Figure 57: Latin America Network File System Market Attractiveness by Enterprise Size, 2022-2032

Figure 58: Latin America Network File System Market Attractiveness by Version, 2022-2032

Figure 59: Latin America Network File System Market Attractiveness by Features, 2022-2032

Figure 60: Latin America Network File System Market Attractiveness by Country, 2022-2032

Figure 61: Europe Network File System Market Value (US$ Mn) by Enterprise Size, 2022-2032

Figure 62: Europe Network File System Market Value (US$ Mn) by Version, 2022-2032

Figure 63: Europe Network File System Market Value (US$ Mn) by Features, 2022-2032

Figure 64: Europe Network File System Market Value (US$ Mn) by Country, 2022-2032

Figure 65: Europe Network File System Market Value (US$ Mn) Analysis by Country, 2017-2032

Figure 66: Europe Network File System Market Value Share (%) and BPS Analysis by Country, 2022-2032

Figure 67: Europe Network File System Market Y-o-Y Growth (%) Projections by Country, 2022-2032

Figure 68: Europe Network File System Market Value (US$ Mn) Analysis by Enterprise Size, 2017-2032

Figure 69: Europe Network File System Market Value Share (%) and BPS Analysis by Enterprise Size, 2022-2032

Figure 70: Europe Network File System Market Y-o-Y Growth (%) Projections by Enterprise Size, 2022-2032

Figure 71: Europe Network File System Market Value (US$ Mn) Analysis by Version, 2017-2032

Figure 72: Europe Network File System Market Value Share (%) and BPS Analysis by Version, 2022-2032

Figure 73: Europe Network File System Market Y-o-Y Growth (%) Projections by Version, 2022-2032

Figure 74: Europe Network File System Market Value (US$ Mn) Analysis by Features, 2017-2032

Figure 75: Europe Network File System Market Value Share (%) and BPS Analysis by Features, 2022-2032

Figure 76: Europe Network File System Market Y-o-Y Growth (%) Projections by Features, 2022-2032

Figure 77: Europe Network File System Market Attractiveness by Enterprise Size, 2022-2032

Figure 78: Europe Network File System Market Attractiveness by Version, 2022-2032

Figure 79: Europe Network File System Market Attractiveness by Features, 2022-2032

Figure 80: Europe Network File System Market Attractiveness by Country, 2022-2032

Figure 81: Asia Pacific Network File System Market Value (US$ Mn) by Enterprise Size, 2022-2032

Figure 82: Asia Pacific Network File System Market Value (US$ Mn) by Version, 2022-2032

Figure 83: Asia Pacific Network File System Market Value (US$ Mn) by Features, 2022-2032

Figure 84: Asia Pacific Network File System Market Value (US$ Mn) by Country, 2022-2032

Figure 85: Asia Pacific Network File System Market Value (US$ Mn) Analysis by Country, 2017-2032

Figure 86: Asia Pacific Network File System Market Value Share (%) and BPS Analysis by Country, 2022-2032

Figure 87: Asia Pacific Network File System Market Y-o-Y Growth (%) Projections by Country, 2022-2032

Figure 88: Asia Pacific Network File System Market Value (US$ Mn) Analysis by Enterprise Size, 2017-2032

Figure 89: Asia Pacific Network File System Market Value Share (%) and BPS Analysis by Enterprise Size, 2022-2032

Figure 90: Asia Pacific Network File System Market Y-o-Y Growth (%) Projections by Enterprise Size, 2022-2032

Figure 91: Asia Pacific Network File System Market Value (US$ Mn) Analysis by Version, 2017-2032

Figure 92: Asia Pacific Network File System Market Value Share (%) and BPS Analysis by Version, 2022-2032

Figure 93: Asia Pacific Network File System Market Y-o-Y Growth (%) Projections by Version, 2022-2032

Figure 94: Asia Pacific Network File System Market Value (US$ Mn) Analysis by Features, 2017-2032

Figure 95: Asia Pacific Network File System Market Value Share (%) and BPS Analysis by Features, 2022-2032

Figure 96: Asia Pacific Network File System Market Y-o-Y Growth (%) Projections by Features, 2022-2032

Figure 97: Asia Pacific Network File System Market Attractiveness by Enterprise Size, 2022-2032

Figure 98: Asia Pacific Network File System Market Attractiveness by Version, 2022-2032

Figure 99: Asia Pacific Network File System Market Attractiveness by Features, 2022-2032

Figure 100: Asia Pacific Network File System Market Attractiveness by Country, 2022-2032

Figure 101: MEA Network File System Market Value (US$ Mn) by Enterprise Size, 2022-2032

Figure 102: MEA Network File System Market Value (US$ Mn) by Version, 2022-2032

Figure 103: MEA Network File System Market Value (US$ Mn) by Features, 2022-2032

Figure 104: MEA Network File System Market Value (US$ Mn) by Country, 2022-2032

Figure 105: MEA Network File System Market Value (US$ Mn) Analysis by Country, 2017-2032

Figure 106: MEA Network File System Market Value Share (%) and BPS Analysis by Country, 2022-2032

Figure 107: MEA Network File System Market Y-o-Y Growth (%) Projections by Country, 2022-2032

Figure 108: MEA Network File System Market Value (US$ Mn) Analysis by Enterprise Size, 2017-2032

Figure 109: MEA Network File System Market Value Share (%) and BPS Analysis by Enterprise Size, 2022-2032

Figure 110: MEA Network File System Market Y-o-Y Growth (%) Projections by Enterprise Size, 2022-2032

Figure 111: MEA Network File System Market Value (US$ Mn) Analysis by Version, 2017-2032

Figure 112: MEA Network File System Market Value Share (%) and BPS Analysis by Version, 2022-2032

Figure 113: MEA Network File System Market Y-o-Y Growth (%) Projections by Version, 2022-2032

Figure 114: MEA Network File System Market Value (US$ Mn) Analysis by Features, 2017-2032

Figure 115: MEA Network File System Market Value Share (%) and BPS Analysis by Features, 2022-2032

Figure 116: MEA Network File System Market Y-o-Y Growth (%) Projections by Features, 2022-2032

Figure 117: MEA Network File System Market Attractiveness by Enterprise Size, 2022-2032

Figure 118: MEA Network File System Market Attractiveness by Version, 2022-2032

Figure 119: MEA Network File System Market Attractiveness by Features, 2022-2032

Figure 120: MEA Network File System Market Attractiveness by Country, 2022-2032

Recommendations

Technology

Electronic Trial Master File (eTMF) System Market

Published : January 2024

Technology

Managed File Transfer (MFT) Market

Published : May 2023

Explore Technology Insights

View Reports

Network File System Market