Reports

- Global Locations -

Headquarters

Future Market Insights, Inc.

Christiana Corporate, 200
Continental Drive, Suite 401,
Newark, Delaware - 19713,
United States

T: +1-845-579-5705

Americas

Future Market Insights, Inc.

616 Corporate Way, Suite 2-9018,
Valley Cottage, NY 10989, United States

T: +1-347-918-3531

MEA

Future Market Insights

1602-6 Jumeirah Bay X2 Tower, Plot No: JLT-PH2-X2A,
Jumeirah Lakes Towers, Dubai,
United Arab Emirates

Europe

Future Market Insights

3rd Floor, 207 Regent Street,
W1B 3HH London
United Kingdom

T: + 44 (0) 20 8123 9659
D: +44 (0) 20 3287 4268

Asia Pacific

Future Market Insights

IndiaLand Global Tech Park, Unit UG-1, Behind Grand HighStreet, Phase 1, Hinjawadi, MH, Pune – 411057, India

Network Traffic Analysis Solution Market Outlook (2022 to 2032)

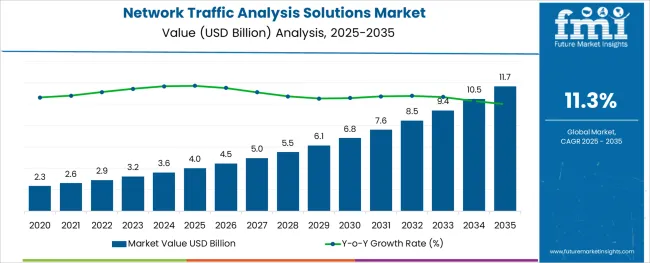
[309 Pages Report] The network traffic analysis solution market is expected to expand its roots in the global market at a moderate CAGR of 11.3% through 2032.

The market is valued at US$ 2.9 Billion in 2022 and is likely to reach US$ 8.5 Billion by 2032. Previously, the market was thriving at a higher CAGR of 12.5% (2016 to 2021), resulting in a market size of US$ 2.5 Billion in 2021.

As system applications rise along with the adoption of employee-owned (BYOD), virtualizations, distributed infrastructure, and cloud services, the consumption of network traffic analysis solutions, enhances the monitoring processes and analysis.

Network traffic analysis solutions are penetrating business spaces through the tools that provide better and structured visibility in communication within the system and network levels, increasing the control benefits that decrease the time interval between the resolution of network issues and their occurrence. Traffic analysis solutions are mostly used in monitoring network capacity and ensuring its security and safety, increasing the sales of network traffic analysis solutions.

Attributes Details
Network Traffic Analysis Solutions Market CAGR (2022 to 2032) 11.3%
Network Traffic Analysis Solutions Market Value (2022) US$ 2.9 Billion
Network Traffic Analysis Solutions Market Value (2032) US$ 8.5 Billion

Don't pay for what you don't need

Customize your report by selecting specific countries or regions and save 30%!

What is COVID-19's Impact on the Network Traffic Analysis Solutions Market?

Novel coronavirus and its spread in developed and developing countries, pushing governments to put travel bans, lockdowns, and logistical restrictions, adversely damaged various markets around the world. A global study on the network traffic analysis solutions market tells that the advent of covid-19 also helped some markets thrive with a better growth rate. The business evolved within its spaces, adopting new technological advancements to ensure high productivity while following work-from-home procedures. The constant monitoring and having a check on workflow around different funnels are big tasks. Though network traffic analysis solutions solve complex monitoring and analysis tasks for the end user, increasing the demand for network traffic analysis solutions.

Remote work has also pushed business leaders to adopt traffic analysis solutions to ensure data security, as data theft and advanced tools are being used to break the security layers. Constant monitoring and analysis help businesses in having control over data, especially in uncertain times.

What are the Key Drivers and Restraints for Growth of the Network Traffic Analysis Solutions Market?

The paradigm shift from normal text messaging to social media messaging apps along with big capital investments by e-commerce giants increases their control over the network and enhances the security of a company’s valuable data.

Network traffic analysis solutions market demand analysis explain the driving factors for the market as proliferating traffic, high consumption of the internet with 5G deployment, advanced attacks on business data, and enhanced control over information.

The high demand for network traffic analysis solutions is attributed to its accessible method for decrypting security professionals while not getting their hands on data privacy implications. In the changing corporate dynamics, data security is an important component of any business, and network analysis helps the end user analyze the threats.

The rapid growth of e-commerce giants like Amazon and Flipkart (Walmart) is expanding the retail space traffic. This allows the expansion of the network traffic analysis solutions market size. Multiple sale events like Flipkart’s big billion-day sale gain a lot of traction from Indian end users. E-commerce platforms adopt traffic analysis solutions to monitor network activities so that the website’s server doesn’t go down because of the high-end user traffic.

This includes providing the end user an enhanced, amazing experience, easing the navigation for them, and resolving all their queries. NTA solutions improve network differentiation in order to allow users to browse through the website conveniently.

Recent developments in the network traffic analysis solutions market explain evolving attacks on network-based communication systems such as phishing attacks or data theft, hackers using new technology to penetrate into security layers of businesses are creating an uneasy situation for corporations. Increased use of cloud technology and cloud traffic has also led to the expansion of network traffic analysis solutions.

It helps the cloud systems secure the important data and information of the company. NTA solutions help businesses analyze the threat and then manage it accordingly. Cutting-edge monitoring tools are also helping end-user businesses in keeping an eye on multiple components to enhance productivity, involving the management of distributed Denial-of-service (DDoS) attacks while maintaining the quality of experience (QoE), increasing the sales of network traffic analysis solutions.

As 5G deployment plays an important part in the growth of the network traffic analysis solutions market, covid-19, and its spread has put a hold on the deployment of 5G deployment around the countries, restraining the growth of the market. Even though the spread of covid-19 has been fruitful to the market, this one factor restrained the growth of the market.

Sudip Saha
Sudip Saha

Principal Consultant

Talk to Analyst

Find your sweet spots for generating winning opportunities in this market.

Comparative View of Adjacent Network Traffic Analysis Solutions Market 

Network Traffic Analysis Solutions Market:

Attributes Network Traffic Analysis Solutions Market
CAGR (2022 to 2032) 7.7%
Market Value (2026) US$ 4.45 Billion
Growth Factor Rising concerns over security and communication breaches, the need for enhanced network,s and government spending is leading the growth of the NTA solutions market.
Opportunity The fresh cyber-attacks using technologically advanced tools are creating opportunities for the NTA solutions vendors to experiment and dissect the errors in attacks in order to counter them.
Key Trends Multiple SMEs are adopting NTA solutions for safety while the integration of AI, ML, and BYOD along with remote work is consuming the traffic-based solutions.

Web Analytics Market:

Attributes Web Analytics Market
CAGR (2022 to 2032) 15%
Market Value (2026) US$ 7.05 Billion
Growth Factor Growing demand for eco-friendly aut and nanotechnology along with the introduction of technology to enhance the operability of the workspace is helping the traffic management market growth.
Opportunity The market creates opportunities for small firms and start-ups that use advanced technology to serve giant clients in traffic management systems such as industry-based traffic management solutions, designing and developing smart analytics
Key Trends Government initiatives involving the promotion of traffic management solutions to save the environment and grow them

Network Management Market

Attributes Network Management Market
CAGR (2022 to 2032) 9.3%
Market Value (2026) US$ 13.14 Billion
Growth Factor Demand for smooth and fast processing units, unprecedented speed, low latency, and large bandwidth, 5G services are driving the sales of the network management market.
Opportunity Integration of the latest tech like AI and ML with network management solutions provides a platform that creates opportunities for businesses as they are able to navigate from one space to another with enhanced operability.
Key Trends Heavy traffic management while keeping up the data and power efficiency is what network management tool vendor focus on.

Network traffic analysis solutions market growth trends explain the Integration of technologically advanced platforms like BYOD, Artificial Intelligence, Predictive decision-making, machine learning, and big data to manage the data well with the changing network dynamics.

Vendors now focus on making the solution platform more flexible and reliable with its attachment to cloud computing and cyber security. The research and development programs involving the production of network traffic management and analysis solutions are creating these platforms for different sizes of organizations, including SMEs and large enterprises.

SMEs use third-party network traffic analysis solutions as they don’t carry that amount of IT capabilities. Another trend that shapes the NTA solutions market is the latest 5G deployment drive around multiple countries, boosting the network and communication markets upward.

What is the Segmentation Outlook for the Network Traffic Analysis Solutions Market?

The network traffic analysis solutions market is categorized by deployment type, user type, and industry vertical. These categories are further divided into small segments that expand their channels in multiple market spaces. These segments perform differently in multiple markets as they have a stronghold in multiple regions.

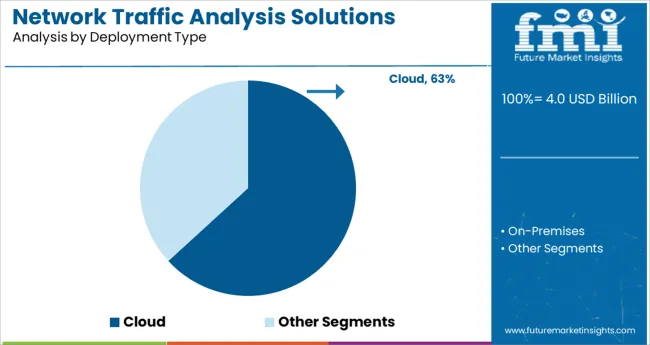
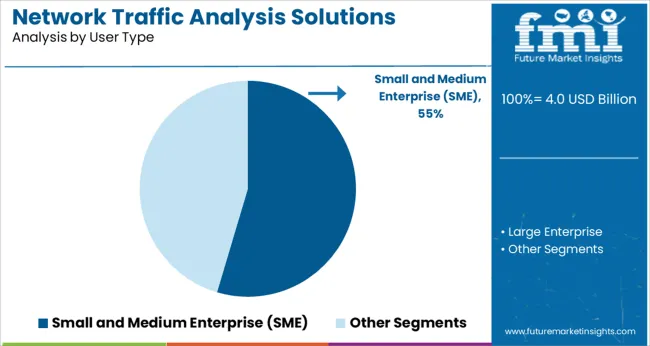
The deployment category is segmented into cloud and on-premises, while the user type category is segmented into small and medium enterprises (SME) and large enterprises. The last category is a vertical industry divided into banking, financial services, insurance, government, healthcare, energy and utilities, education, telecom, IT, manufacturing, and retail.

Which Segment is likely to Lead the Network Traffic Analysis Solutions Market by Deployment Type?

By deployment type, the network traffic analysis solutions market analysis finds that the On-premises segment is the biggest and is expected to hold the major chunk of the market in the forecast period, thriving at a CAGR of 9.1%.

The factors behind this segment's sales are reliability, easy implementation, and high consumption of on-premises solutions while security concerns arise. Another factor that drives the segment's growth is its increased use of social media monitoring.

Which Segment is likely to Lead the Network Traffic Analysis Solutions Market by Industrial Vertical?

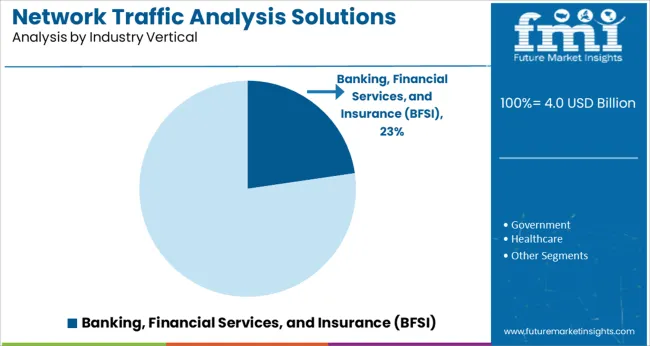
By industrial vertical, the banking, financial services, and insurance (BFSI) segment is the biggest segment in the network traffic analysis solutions market. It is expected to hold the largest portion in the forecast period.

The segment is thriving at a strong CAGR of 11.6%. The factors behind the growth of this segment are rising technological advancements in the banking sector and improving security and monitoring levels. Aggressive pricing, growing analysis, and monitoring need to expand the market size of the network traffic analysis solutions.
Get the data you need at a Fraction of the cost

Personalize your report by choosing insights you need
and save 40%!

What is the Regional Analysis for the Network Traffic Analysis Solutions Market?

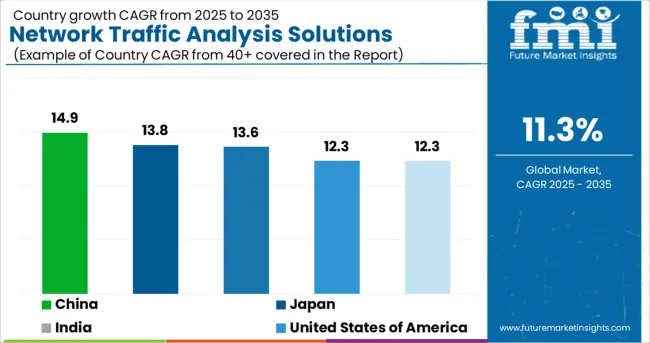
The network traffic analysis solutions market report explains that the market is divided into regions; North America, Latin America, Asia Pacific, Middle East and Africa (MEA), and Europe. The biggest market is the USA, growing at a CAGR of 12.3% between 2022 and 2032.

The region is expected to hold a market revenue of US$ 2.2 Billion by the end of 2032. Factors behind the high sales of NTA solutions are increasing traffic in the region, rising cyberattacks, and rapid 5G deployments.

Apart from this, China is the highest-growing market for network traffic analysis market, thriving at a CAGR of 14.9% and will hold the second-highest value of US$ 1.6 Billion by 2032, while the Japan region is the highest growth potential with a CAGR of 13.8% between 2022 to 2032, generating a revenue of US$ 479.6 Million. The UK also grows along with Japan, with the forecasted value of US$ 681.2 Million (2032) at a CAGR of 12.3% between 2022 to 2032.

Regions CAGR (2022 to 2032)
United States of America 12.3%
United Kingdom 12.3%
China 14.9%
Japan 13.8%
India 13.6%
  • The USA holds the biggest portion of the network traffic analysis solutions market.
  • China is the highest-growing market followed by Japan making the Asia Pacific region the fastest-growing region, thriving at a CAGR of 14.9% and 13.8% respectively between 2022 and 2032.
  • Growing 5G deployments and cyber-attacks along with digitization of business spaces are driving the factors of network traffic analysis solutions in Asia-Pacific countries like China and Japan. These factors are expanding the network traffic analysis solutions market size in the region.

How is the Competition in the Network Traffic Analysis Solutions Market?

The competitive landscape of the network traffic analysis solutions market is diversified, and vibrant and makes the market more tightly for new players. Companies also collaborate and merge with other companies, which strengthens their roots and expands their distributional channels.

Key Players:

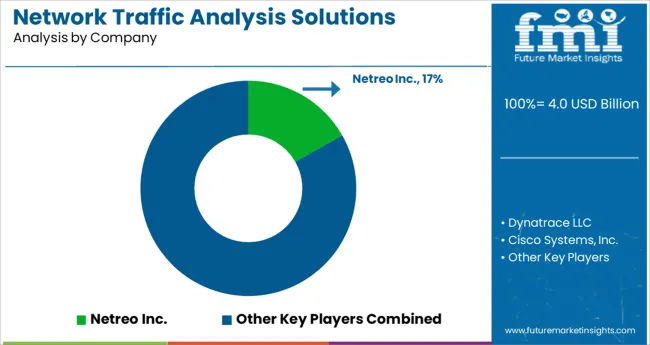
  • Netreo Inc.
  • Dynatrace LLC
  • Cisco System Inc
  • Palo Alto Networks Inc
  • Ipswitch Inc
  • Kentik
  • Awake Security

Recent Developments in the Network Traffic Analysis Solutions Market

  • Awake Security has acquired Series C funding for US$ 36 Million in order to fuel the adoption rate of advanced network traffic analysis platforms, increasing the sales of network traffic analysis solutions.
  • Kentik has introduced synthetic monitoring solutions for autonomous testing for cloud and hybrid networks, analyzing them to the core network and providing substantial data. This pushes the sales of network traffic analysis solutions.
  • Dynatrace LLC has upgraded its network monitoring platform to ensure high-quality processes go smoothly with the enhanced network sections, fueling the demand for network traffic analysis solutions.

Key Segments:

By Deployment Type:

  • Cloud
  • On-Premises

By User Type:

  • Small and Medium Enterprise (SME)
  • Large Enterprise

By Industry Vertical:

  • Banking, Financial Services and Insurance (BFSI)
  • Government
  • Healthcare
  • Energy and Utilities
  • Education
  • Telecom and IT
  • Manufacturing
  • Retail

By Region:

  • North America
  • Europe
  • Asia Pacific
  • Middle East and Africa (MEA)
  • South America

Frequently Asked Questions

What is the CAGR of the Network Traffic Analysis Solutions Market?

The network traffic analysis solutions market is set to grow at a CAGR of 11.3% through 2032.

Which is the Highest Growing Region in the network traffic analysis solutions Market?

China is the biggest region in network traffic analysis solutions market with a CAGR of 14.9% between 2022 and 2032.

Which Segment leads in the Network Traffic Analysis Solutions Market by Deployment Type?

On-premises segment is the leading segment in the network traffic analysis solutions market by type.

What is the Growth Estimated for the Network Traffic Analysis Solutions by 2032?

The network traffic analysis solutions market is set to reach US$ 8.5 Billion by 2032.

Which Region Has the Highest Growth Potential?

Asia Pacific has the highest growth potential in the Network Traffic Analysis Solutions market, where Japan and China have the highest growth rates of 13.8% and 14.9% respectively through 2032.

Table of Content

1. Preface | Network Traffic Analysis Solutions Market

    1.1. Market Definition and Scope

    1.2. Market Segmentation

    1.3. Key Research Objectives

    1.4. Research Highlights

2. Assumptions and Research Methodology

3. Executive Summary: Global Market 

4. Market Overview

    4.1. Introduction

    4.2. Market Dynamics

        4.2.1. Drivers

        4.2.2. Restraints

        4.2.3. Opportunity

    4.3. Key Trends

    4.4. Global Market Analysis and Forecasts, 2022 to 2032

        4.4.1. Market Revenue Projections (US$ Million)

    4.5. Porter’s Five Forces Analysis

    4.6. Ecosystem Analysis

    4.7. Market Outlook

5. Global Market Analysis and Forecasts, By Deployment Type

    5.1. Overview & Definition

    5.2. Global Market Size (US$ Million) Forecast By Deployment Type, 2022 to 2032

        5.2.1. Cloud

        5.2.2. On-Premises

    5.3. Deployment Type Comparison Matrix

    5.4. Market Attractiveness By Deployment Type

6. Global Market Analysis and Forecasts, By User Type

    6.1. Overview & Definition

    6.2. Global Market Size (US$ Million) Forecast By User Type, 2022 to 2032

        6.2.1. Small and Medium Enterprise (SME)

        6.2.2. Large Enterprise

    6.3. User Type Comparison Matrix

    6.4. Market Attractiveness By User Type

7. Global Market Analysis and Forecasts, By Industry Vertical

    7.1. Overview & Definition

    7.2. Global Market Size (US$ Million) Forecast By Industry Vertical, 2022 to 2032

        7.2.1. Banking, Financial Services, and Insurance (BFSI)

        7.2.2. Government

        7.2.3. Healthcare

        7.2.4. Energy and utilities

        7.2.5. Education

        7.2.6. Telecom and IT

        7.2.7. Manufacturing

        7.2.8. Retail

        7.2.9. Others (media & entertainment, aerospace & defense, and hospitality)

    7.3. Industry Vertical Comparison Matrix

    7.4. Market Attractiveness By Industry Vertical

8. Global Market Analysis and Forecasts, By Region

    8.1. Key Findings

    8.2. Global Market Size (US$ Million) Forecast By Region, 2022 to 2032

        8.2.1. North America

        8.2.2. Europe

        8.2.3. Asia Pacific

        8.2.4. Middle East and Africa

        8.2.5. South America

    8.3. Market Attractiveness By Region

9. North America Market Analysis and Forecasts

    9.1. Key Findings

    9.2. Key Trends

    9.3. Market Size (US$ Million) Forecast By Deployment Type, 2022 to 2032

        9.3.1. Cloud

        9.3.2. On-Premises

    9.4. Market Size (US$ Million) Forecast By User Type, 2022 to 2032

        9.4.1. Small and Medium Enterprise (SME)

        9.4.2. Large Enterprise

    9.5. Market Size (US$ Million) Forecast By Industry Vertical, 2022 to 2032

        9.5.1. Banking, Financial Services, and Insurance (BFSI)

        9.5.2. Government

        9.5.3. Healthcare

        9.5.4. Energy and utilities

        9.5.5. Education

        9.5.6. Telecom and IT

        9.5.7. Manufacturing

        9.5.8. Retail

        9.5.9. Others (media & entertainment, aerospace & defense, and hospitality)

    9.6. Market Size (US$ Million) Forecast By Country, 2022 to 2032

        9.6.1. United States of America

        9.6.2. Canada

        9.6.3. Rest of North America

    9.7. USA Market Size (US$ Million)

        9.7.1. By Deployment Type

        9.7.2. By User Type

        9.7.3. By Industry Vertical

    9.8. Canada Market Size (US$ Million)

        9.8.1. By Deployment Type

        9.8.2. By User Type

        9.8.3. By Industry Vertical

    9.9. Rest of North America Market Size (US$ Million)

        9.9.1. By Deployment Type

        9.9.2. By User Type

        9.9.3. By Industry Vertical

    9.10. Market Attractiveness Analysis

        9.10.1. By Deployment Type

        9.10.2. By User Type

        9.10.3. By Industry Vertical

        9.10.4. By Country

10. Europe Market Analysis and Forecasts

    10.1. Key Findings

    10.2. Key Trends

    10.3. Market Size (US$ Million) Forecast By Deployment Type, 2022 to 2032

        10.3.1. Cloud

        10.3.2. On-Premises

    10.4. Market Size (US$ Million) Forecast By User Type, 2022 to 2032

        10.4.1. Small and Medium Enterprise (SME)

        10.4.2. Large Enterprise

    10.5. Market Size (US$ Million) Forecast By Industry Vertical, 2022 to 2032

        10.5.1. Banking, Financial Services, and Insurance (BFSI)

        10.5.2. Government

        10.5.3. Healthcare

        10.5.4. Energy and utilities

        10.5.5. Education

        10.5.6. Telecom and IT

        10.5.7. Manufacturing

        10.5.8. Retail

        10.5.9. Others (media & entertainment, aerospace & defense, and hospitality)

    10.6. Market Size (US$ Million) Forecast By Country, 2022 to 2032

        10.6.1. United Kingdom

        10.6.2. Germany

        10.6.3. France

        10.6.4. Rest of Europe

    10.7. UK Market Size (US$ Million)

        10.7.1. By Deployment Type

        10.7.2. By User Type

        10.7.3. By Industry Vertical

    10.8. Germany Market Size (US$ Million)

        10.8.1. By Deployment Type

        10.8.2. By User Type

        10.8.3. By Industry Vertical

    10.9. France Market Size (US$ Million)

        10.9.1. By Deployment Type

        10.9.2. By User Type

        10.9.3. By Industry Vertical

    10.10. Rest of Europe Market Size (US$ Million)

        10.10.1. By Deployment Type

        10.10.2. By User Type

        10.10.3. By Industry Vertical

    10.11. Market Attractiveness Analysis

        10.11.1. By Deployment Type

        10.11.2. By User Type

        10.11.3. By Industry Vertical

        10.11.4. By Country

11. Asia Pacific Market Analysis and Forecasts

    11.1. Key Findings

    11.2. Key Trends

    11.3. Market Size (US$ Million) Forecast By Deployment Type, 2022 to 2032

        11.3.1. Cloud

        11.3.2. On-Premises

    11.4. Market Size (US$ Million) Forecast By User Type, 2022 to 2032

        11.4.1. Small and Medium Enterprise (SME)

        11.4.2. Large Enterprise

    11.5. Market Size (US$ Million) Forecast By Industry Vertical, 2022 to 2032

        11.5.1. Banking, Financial Services, and Insurance (BFSI)

        11.5.2. Government

        11.5.3. Healthcare

        11.5.4. Energy and utilities

        11.5.5. Education

        11.5.6. Telecom and IT

        11.5.7. Manufacturing

        11.5.8. Retail

        11.5.9. Others (media & entertainment, aerospace & defense, and hospitality)

    11.6. Market Size (US$ Million) Forecast By Country, 2022 to 2032

        11.6.1. China

        11.6.2. India

        11.6.3. Japan

        11.6.4. Rest of Asia Pacific

    11.7. China Market Size (US$ Million)

        11.7.1. By Deployment Type

        11.7.2. By User Type

        11.7.3. By Industry Vertical

    11.8. India Market Size (US$ Million)

        11.8.1. By Deployment Type

        11.8.2. By User Type

        11.8.3. By Industry Vertical

    11.9. Japan Market Size (US$ Million)

        11.9.1. By Deployment Type

        11.9.2. By User Type

        11.9.3. By Industry Vertical

    11.10. Rest of Asia Pacific Market Size (US$ Million)

        11.10.1. By Deployment Type

        11.10.2. By User Type

        11.10.3. By Industry Vertical

    11.11. Market Attractiveness Analysis

        11.11.1. By Deployment Type

        11.11.2. By User Type

        11.11.3. By Industry Vertical

        11.11.4. By Country

12. Middle East and Africa Market Analysis and Forecasts

    12.1. Key Findings

    12.2. Key Trends

    12.3. Market Size (US$ Million) Forecast By Deployment Type, 2022 to 2032

        12.3.1. Cloud

        12.3.2. On-Premises

    12.4. Market Size (US$ Million) Forecast By User Type, 2022 to 2032

        12.4.1. Small and Medium Enterprise (SME)

        12.4.2. Large Enterprise

    12.5. Market Size (US$ Million) Forecast By Industry Vertical, 2022 to 2032

        12.5.1. Banking, Financial Services, and Insurance (BFSI)

        12.5.2. Government

        12.5.3. Healthcare

        12.5.4. Energy and utilities

        12.5.5. Education

        12.5.6. Telecom and IT

        12.5.7. Manufacturing

        12.5.8. Retail

        12.5.9. Others (media & entertainment, aerospace & defense, and hospitality)

    12.6. Market Size (US$ Million) Forecast By Country, 2022 to 2032

        12.6.1. GCC

        12.6.2. South Africa

        12.6.3. Rest of Middle East and Africa

    12.7. GCC Market Size (US$ Million)

        12.7.1. By Deployment Type

        12.7.2. By User Type

        12.7.3. By Industry Vertical

    12.8. South Africa Market Size (US$ Million)

        12.8.1. By Deployment Type

        12.8.2. By User Type

        12.8.3. By Industry Vertical

    12.9. Rest of Middle East and Africa Market Size (US$ Million)

        12.9.1. By Deployment Type

        12.9.2. By User Type

        12.9.3. By Industry Vertical

    12.10. Market Attractiveness Analysis

        12.10.1. By Deployment Type

        12.10.2. By User Type

        12.10.3. By Industry Vertical

        12.10.4. By Country

13. South America Market Analysis and Forecasts

    13.1. Key Findings

    13.2. Key Trends

    13.3. Market Size (US$ Million) Forecast By Deployment Type, 2022 to 2032

        13.3.1. Cloud

        13.3.2. On-Premises

    13.4. Market Size (US$ Million) Forecast By User Type, 2022 to 2032

        13.4.1. Small and Medium Enterprise (SME)

        13.4.2. Large Enterprise

    13.5. Market Size (US$ Million) Forecast By Industry Vertical, 2022 to 2032

        13.5.1. Banking, Financial Services, and Insurance (BFSI)

        13.5.2. Government

        13.5.3. Healthcare

        13.5.4. Energy and utilities

        13.5.5. Education

        13.5.6. Telecom and IT

        13.5.7. Manufacturing

        13.5.8. Retail

        13.5.9. Others (media & entertainment, aerospace & defense, and hospitality)

    13.6. Market Size (US$ Million) Forecast By Country, 2022 to 2032

        13.6.1. Brazil

        13.6.2. Rest of South America

    13.7. Brazil Market Size (US$ Million)

        13.7.1. By Deployment Type

        13.7.2. By User Type

        13.7.3. By Industry Vertical

    13.8. Rest of South America Market Size (US$ Million)

        13.8.1. By Deployment Type

        13.8.2. By User Type

        13.8.3. By Industry Vertical

    13.9. Market Attractiveness Analysis

        13.9.1. By Deployment Type

        13.9.2. By User Type

        13.9.3. By Industry Vertical

        13.9.4. By Country

14. Competition Landscape

    14.1. Market Player - Competition Matrix (By Tier and Size of companies)

    14.2. Market Share Analysis By Company (2016)

    14.3. Company Profiles (Details - Overview, Financials, Recent Developments, Strategy, SWOT Analysis)

        14.3.1. Netreo Inc.

            14.3.1.1. Overview

            14.3.1.2. Financials

            14.3.1.3. Strategy

            14.3.1.4. SWOT

        14.3.2. Dynatrace LLC

            14.3.2.1. Overview

            14.3.2.2. Financials

            14.3.2.3. Strategy

            14.3.2.4. SWOT

        14.3.3. Cisco Systems, Inc.

            14.3.3.1. Overview

            14.3.3.2. Financials

            14.3.3.3. Strategy

            14.3.3.4. SWOT

        14.3.4. Palo Alto Networks, Inc.

            14.3.4.1. Overview

            14.3.4.2. Financials

            14.3.4.3. Strategy

            14.3.4.4. SWOT

        14.3.5. Ipswitch Inc.

            14.3.5.1. Overview

            14.3.5.2. Financials

            14.3.5.3. Strategy

            14.3.5.4. SWOT

        14.3.6. Netmon Inc.

            14.3.6.1. Overview

            14.3.6.2. Financials

            14.3.6.3. Strategy

            14.3.6.4. SWOT

        14.3.7. Zoho Corp. (ManageEngine)

            14.3.7.1. Overview

            14.3.7.2. Financials

            14.3.7.3. Strategy

            14.3.7.4. SWOT

        14.3.8. Flowmon Networks

            14.3.8.1. Overview

            14.3.8.2. Financials

            14.3.8.3. Strategy

            14.3.8.4. SWOT

        14.3.9. Genie Networks

            14.3.9.1. Overview

            14.3.9.2. Financials

            14.3.9.3. Strategy

            14.3.9.4. SWOT

        14.3.10. GREYCORTEX s.r.o.

            14.3.10.1. Overview

            14.3.10.2. Financials

            14.3.10.3. Strategy

            14.3.10.4. SWOT

15. Key Takeaways

Don't pay for what you don't need

Customize your report by selecting specific countries or regions and save 30%!

List of Tables

Table 01: Global Market Size Forecast, By Deployment Type, 2022 to 2032 (US$ Million)

Table 02: Global Market Value Share Analysis, By Deployment Type

Table 03: Global Market Size Forecast, By User Type, 2022 to 2032 (US$ Million)

Table 04: Global Market Value Share Analysis, By User Type

Table 05: Global Market Size Forecast, By Industry Vertical, 2022 to 2032 (US$ Million)

Table 06: Global Market Value Share Analysis, By Industry Vertical

Table 07: Global Market Value Share Analysis, By Region

Table 08: Global Market Size (US$ Million) Forecast, By Region, 2022 to 2032

Table 09: North America Market Value Share Analysis, By Deployment Type

Table 10: North America Market Size Forecast, By Deployment Type, 2022 to 2032 (US$ Million)

Table 11: North America Market Value Share Analysis, By User Type

Table 12: North America Market Size Forecast, By User Type, 2022 to 2032 (US$ Million)

Table 13: North America Market Value Share Analysis, By Industry Vertical

Table 14: North America Market Size Forecast, By Industry Vertical, 2022 to 2032 (US$ Million)

Table 15: North America Market Value Share Analysis, By Country

Table 16: North America Market Size Forecast, By Country, 2022 to 2032 (US$ Million)

Table 17: USA Market Value Share Analysis, By Deployment Type

Table 18: USA Market Size Forecast, By Deployment Type, 2022 to 2032 (US$ Million)

Table 19: USA Market Value Share Analysis, By User Type

Table 20: USA Market Size Forecast, By User Type, 2022 to 2032 (US$ Million)

Table 21: USA Market Value Share Analysis, By Industry Vertical

Table 22: USA Market Size Forecast, By Industry Vertical, 2022 to 2032 (US$ Million)

Table 23: Canada Market Value Share Analysis, By Deployment Type

Table 24: Canada Market Size Forecast, By Deployment Type, 2022 to 2032 (US$ Million)

Table 25: Canada Market Value Share Analysis, By User Type

Table 26: Canada Market Size Forecast, By User Type, 2022 to 2032 (US$ Million)

Table 27: Canada Market Value Share Analysis, By Industry Vertical

Table 28: Canada Market Size Forecast, By Industry Vertical, 2022 to 2032 (US$ Million)

Table 29: Rest of North America Market Size Forecast, By Deployment Type, 2022 to 2032 (US$ Million)

Table 30: Rest of North America Market Size Forecast, By User Type, 2022 to 2032 (US$ Million)

Table 31: Rest of North America Market Size Forecast, By Industry Vertical, 2022 to 2032 (US$ Million)

Table 32: Europe Market Value Share Analysis, By Deployment Type

Table 33: Europe Market Size Forecast, By Deployment Type, 2022 to 2032 (US$ Million)

Table 34: Europe Market Value Share Analysis, By User Type

Table 35: Europe Market Size Forecast, By User Type, 2022 to 2032 (US$ Million)

Table 36: Europe Market Value Share Analysis, By Industry Vertical

Table 37: Europe Market Size Forecast, By Industry Vertical, 2022 to 2032 (US$ Million)

Table 38: Europe Market Value Share Analysis, By Country

Table 39: Europe Market Size Forecast, By Country, 2022 to 2032 (US$ Million)

Table 40: UK Market Value Share Analysis, By Deployment Type

Table 41: UK Market Size Forecast, By Deployment Type, 2022 to 2032 (US$ Million)

Table 42: UK Market Value Share Analysis, By User Type

Table 43: UK Market Size Forecast, By User Type, 2022 to 2032 (US$ Million)

Table 44: UK Market Value Share Analysis, By Industry Vertical

Table 45: UK Market Size Forecast, By Industry Vertical, 2022 to 2032 (US$ Million)

Table 46: Germany Market Value Share Analysis, By Deployment Type

Table 47: Germany Market Size Forecast, By Deployment Type, 2022 to 2032 (US$ Million)

Table 48: Germany Market Value Share Analysis, By User Type

Table 49: Germany Market Size Forecast, By User Type, 2022 to 2032 (US$ Million)

Table 50: Germany Market Value Share Analysis, By Industry Vertical

Table 51: Germany Market Size Forecast, By Industry Vertical, 2022 to 2032 (US$ Million)

Table 52: France Market Value Share Analysis, By Deployment Type

Table 53: France Market Size Forecast, By Deployment Type, 2022 to 2032 (US$ Million)

Table 54: France Market Value Share Analysis, By User Type

Table 55: France Market Size Forecast, By User Type, 2022 to 2032 (US$ Million)

Table 56: France Market Value Share Analysis, By Industry Vertical

Table 57: France Market Size Forecast, By Industry Vertical, 2022 to 2032 (US$ Million)

Table 58: Rest of Europe Market Size Forecast, By Deployment Type, 2022 to 2032 (US$ Million)

Table 59: Rest of Europe Market Size Forecast, By User Type, 2022 to 2032 (US$ Million)

Table 60: Rest of Europe Market Size Forecast, By Industry Vertical, 2022 to 2032 (US$ Million)

Table 61: Asia Pacific Market Value Share Analysis, By Deployment Type

Table 62: Asia Pacific Market Size Forecast, By Deployment Type, 2022 to 2032 (US$ Million)

Table 63: Asia Pacific Market Value Share Analysis, By User Type

Table 64: Asia Pacific Market Size Forecast, By User Type, 2022 to 2032 (US$ Million)

Table 65: Asia Pacific Market Value Share Analysis, By Industry Vertical

Table 66: Asia Pacific Market Size Forecast, By Industry Vertical, 2022 to 2032 (US$ Million)

Table 67: Asia Pacific Market Value Share Analysis, By Country

Table 68: Asia Pacific Market Size Forecast, By Country, 2022 to 2032 (US$ Million)

Table 69: China Market Value Share Analysis, By Deployment Type

Table 70: China Market Size Forecast, By Deployment Type, 2022 to 2032 (US$ Million)

Table 71: China Market Value Share Analysis, By User Type

Table 72: China Market Size Forecast, By User Type, 2022 to 2032 (US$ Million)

Table 73: China Market Value Share Analysis, By Industry Vertical

Table 74: China Market Size Forecast, By Industry Vertical, 2022 to 2032 (US$ Million)

Table 75: India Market Value Share Analysis, By Deployment Type

Table 76: India Market Size Forecast, By Deployment Type, 2022 to 2032 (US$ Million)

Table 77: India Market Value Share Analysis, By User Type

Table 78: India Market Size Forecast, By User Type, 2022 to 2032 (US$ Million)

Table 79: India Market Value Share Analysis, By Industry Vertical

Table 80: India Market Size Forecast, By Industry Vertical, 2022 to 2032 (US$ Million)

Table 81: Japan Market Value Share Analysis, By Deployment Type

Table 82: Japan Market Size Forecast, By Deployment Type, 2022 to 2032 (US$ Million)

Table 83: Japan Market Value Share Analysis, By User Type

Table 84: Japan Market Size Forecast, By User Type, 2022 to 2032 (US$ Million)

Table 85: Japan Market Value Share Analysis, By Industry Vertical

Table 86: Japan Market Size Forecast, By Industry Vertical, 2022 to 2032 (US$ Million)

Table 87: Rest of Asia Pacific Market Size Forecast, By Deployment Type, 2022 to 2032 (US$ Million)

Table 88: Rest of Asia Pacific Market Size Forecast, By User Type, 2022 to 2032 (US$ Million)

Table 89: Rest of Asia Pacific Market Size Forecast, By Industry Vertical, 2022 to 2032 (US$ Million)

Table 90: Middle East and Africa Market Value Share Analysis, By Deployment Type

Table 91: Middle East and Africa Market Size Forecast, By Deployment Type, 2022 to 2032 (US$ Million)

Table 92: Middle East and Africa Market Value Share Analysis, By User Type

Table 93: Middle East and Africa Market Size Forecast, By User Type, 2022 to 2032 (US$ Million)

Table 94: Middle East and Africa Market Value Share Analysis, By Industry Vertical

Table 95: Middle East and Africa Market Size Forecast, By Industry Vertical, 2022 to 2032 (US$ Million)

Table 96: Middle East and Africa Market Value Share Analysis, By Country

Table 97: Middle East and Africa Market Size Forecast, By Country, 2022 to 2032 (US$ Million)

Table 98: GCC Countries Market Value Share Analysis, By Deployment Type

Table 99: GCC Countries Market Size Forecast, By Deployment Type, 2022 to 2032 (US$ Million)

Table 100: GCC Countries Market Value Share Analysis, By User Type

Table 101: GCC Countries Market Size Forecast, By User Type, 2022 to 2032 (US$ Million)

Table 102: GCC Countries Market Value Share Analysis, By Industry Vertical

Table 103: GCC Countries Market Size Forecast, By Industry Vertical, 2022 to 2032 (US$ Million)

Table 104: South Africa Market Value Share Analysis, By Deployment Type

Table 105: South Africa Market Size Forecast, By Deployment Type, 2022 to 2032 (US$ Million)

Table 106: South Africa Market Value Share Analysis, By User Type

Table 107: South Africa Market Size Forecast, By User Type, 2022 to 2032 (US$ Million)

Table 108: South Africa Market Value Share Analysis, By Industry Vertical

Table 109: South Africa Market Size Forecast, By Industry Vertical, 2022 to 2032 (US$ Million)

Table 110: Rest of Middle East and Africa Market Size Forecast, By Deployment Type, 2022 to 2032 (US$ Million)

Table 111: Rest of Middle East and Africa Market Size Forecast, By User Type, 2022 to 2032 (US$ Million)

Table 112: Rest of Middle East and Africa Market Size Forecast, By Industry Vertical, 2022 to 2032 (US$ Million)

Table 113: South America Market Value Share Analysis, By Deployment Type

Table 114: South America Market Size Forecast, By Deployment Type, 2022 to 2032 (US$ Million)

Table 115: South America Market Value Share Analysis, By User Type

Table 116: South America Market Size Forecast, By User Type, 2022 to 2032 (US$ Million)

Table 117: South America Market Value Share Analysis, By Industry Vertical

Table 118: South America Market Size Forecast, By Industry Vertical, 2022 to 2032 (US$ Million)

Table 119: South America Market Value Share Analysis, By Country

Table 120: South America Market Size Forecast, By Country, 2022 to 2032 (US$ Million)

Table 121: Brazil Market Value Share Analysis, By Deployment Type

Table 122: Brazil Market Size Forecast, By Deployment Type, 2022 to 2032 (US$ Million)

Table 123: Brazil Market Value Share Analysis, By User Type

Table 124: Brazil Market Size Forecast, By User Type, 2022 to 2032 (US$ Million)

Table 125: Brazil Market Value Share Analysis, By Industry Vertical

Table 126: Brazil Market Size Forecast, By Industry Vertical, 2022 to 2032 (US$ Million)

Table 127: Rest of South America Market Size Forecast, By Deployment Type, 2022 to 2032 (US$ Million)

Table 128: Rest of South America Market Size Forecast, By User Type, 2022 to 2032 (US$ Million)

Table 129: Rest of South America Market Size Forecast, By Industry Vertical, 2022 to 2032 (US$ Million)
Sudip Saha
Sudip Saha

Principal Consultant

Talk to Analyst

Find your sweet spots for generating winning opportunities in this market.

List of Charts

Figure 01: Global Market Revenue Forecast, 2022 to 2032 (US$ Million)

Figure 02: Global Market Y-o-Y Growth (%), 2022 to 2032

Figure 03: Market Revenue Share, By Deployment Type (2021)

Figure 04: Market Revenue Share, By Industry Vertical (2021)

Figure 05: Market Revenue Share, By User Type (2021)

Figure 06: Global Market Value Share Analysis, By Deployment Type, 2021 and 2032

Figure 07: Market, By Deployment Type, Cloud

Figure 08: Market, By Deployment Type, On-Premises

Figure 09: Market Comparison Matrix, By Deployment Type

Figure 10: Market Attractiveness Analysis, By Deployment Type

Figure 11: Global Market Value Share Analysis, By User Type, 2021 and 2032

Figure 12: Market, By User Type, Small Medium Enterprise

Figure 13: Market, By User Type, Large Enterprise 

Figure 14: Market Comparison Matrix, By User Type

Figure 15: Market Attractiveness Analysis, By User Type

Figure 16: Global Market Value Share Analysis, By Industry Vertical, 2021 and 2032

Figure 17: Market, By Industry Vertical, BFSI

Figure 18: Market, By Industry Vertical, Government

Figure 19: Market, By Industry Vertical, Healthcare

Figure 20: Market, By Industry Vertical, Energy and Utilities

Figure 21: Market, By Industry Vertical, Education

Figure 22: Market, By Industry Vertical, Telecom, and IT

Figure 23: Market, By Industry Vertical, Manufacturing

Figure 24: Market, By Industry Vertical, Retail

Figure 25: Market, By Industry Vertical, Others

Figure 26: Market Comparison Matrix, By Industry Vertical

Figure 27: Market Attractiveness Analysis, By Industry Vertical 

Figure 28: Global Market Value Share Analysis, By Region, 2021 and 2032

Figure 29: Global Market Analysis, By Region, North America

Figure 30: Global Market Analysis, By Region, Europe

Figure 31: Global Market Analysis, By Region, Asia Pacific

Figure 32: Global Market Analysis, By Region, Middle East, and Africa

Figure 33: Global Market Analysis, By Region, South America

Figure 34: Global Market Attractiveness Analysis, By Region

Figure 35: North America Market Revenue Forecast, 2022 to 2032 (US$ Million)

Figure 36: North America Market Y-o-Y Growth (%), 2022 to 2032

Figure 37: North America Market Value Share Analysis, By Deployment Type, 2021 and 2032

Figure 38: North America Market Value Share Analysis, By User Type, 2021 and 2032

Figure 39: North America Market Value Share Analysis, By Industry Vertical, 2021 and 2032

Figure 40: North America Market Value Share Analysis, By Country, 2021 and 2032

Figure 41: USA Market Value Share Analysis, By Deployment Type, 2021 and 2032

Figure 42: USA Market Value Share Analysis, By User Type, 2021 and 2032

Figure 43: USA Market Value Share Analysis, By Industry Vertical, 2021 and 2032

Figure 44: Canada Market Value Share Analysis, By Deployment Type, 2021 and 2032

Figure 45: Canada Market Value Share Analysis, By User Type, 2021 and 2032

Figure 46: Canada Market Value Share Analysis, By Industry Vertical, 2021 and 2032

Figure 47: North America Market Attractiveness Analysis, By Country

Figure 48: North America Market Attractiveness Analysis, By Deployment Type

Figure 49: North America Market Attractiveness Analysis, By Industry  Vertical

Figure 50: North America Market Attractiveness Analysis, By User Type

Figure 51: Europe Market Revenue Forecast, 2022 to 2032 (US$ Million)

Figure 52: Europe Market Y-o-Y Growth (%), 2022 to 2032

Figure 53: Europe Market Value Share Analysis, By Deployment Type, 2021 and 2032

Figure 54: Europe Market Value Share Analysis, By User Type, 2021 and 2032

Figure 55: Europe Market Value Share Analysis, By Industry Vertical, 2021 and 2032

Figure 56: Europe Market Value Share Analysis, By Country, 2021 and 2032

Figure 57: UK Market Value Share Analysis, By Deployment Type, 2021 and 2032

Figure 58: UK Market Value Share Analysis, By User Type, 2021 and 2032

Figure 59: UK Market Value Share Analysis, By Industry Vertical, 2021 and 2032

Figure 60: Germany Market Value Share Analysis, By Deployment Type, 2021 and 2032

Figure 61: Germany Market Value Share Analysis, By User Type, 2021 and 2032

Figure 62: Germany Market Value Share Analysis, By Industry Vertical, 2021 and 2032

Figure 63: France Market Value Share Analysis, By Deployment Type, 2021 and 2032

Figure 64: France Market Value Share Analysis, By User Type, 2021 and 2032

Figure 65: France Market Value Share Analysis, By Industry Vertical, 2021 and 2032

Figure 66: Europe Market Attractiveness Analysis, By Country

Figure 67: Europe Market Attractiveness Analysis, By Deployment Type

Figure 68: Europe Market Attractiveness Analysis, By Industry  Vertical

Figure 69: Europe Market Attractiveness Analysis, By User Type

Figure 70: Asia Pacific Market Revenue Forecast, 2022 to 2032 (US$ Million)

Figure 71: Asia Pacific Market Y-o-Y Growth (%), 2022 to 2032

Figure 72: Asia Pacific Market Value Share Analysis, By Deployment Type, 2021 and 2032

Figure 73: Asia Pacific Market Value Share Analysis, By User Type, 2021 and 2032

Figure 74: Asia Pacific Market Value Share Analysis, By Industry Vertical, 2021 and 2032

Figure 75: Asia Pacific Market Value Share Analysis, By Country, 2021 and 2032

Figure 76: China Market Value Share Analysis, By Deployment Type, 2021 and 2032

Figure 77: China Market Value Share Analysis, By User Type, 2021 and 2032

Figure 78: China Market Value Share Analysis, By Industry Vertical, 2021 and 2032

Figure 79: India Market Value Share Analysis, By Deployment Type, 2021 and 2032

Figure 80: India Market Value Share Analysis, By User Type, 2021 and 2032

Figure 81: India Market Value Share Analysis, By Industry Vertical, 2021 and 2032

Figure 82: Japan Market Value Share Analysis, By Deployment Type, 2021 and 2032

Figure 83: Japan Market Value Share Analysis, By User Type, 2021 and 2032

Figure 84: Japan Market Value Share Analysis, By Industry Vertical, 2021 and 2032

Figure 85: Asia Pacific Market Attractiveness Analysis, By Country

Figure 86: Asia Pacific Market Attractiveness Analysis, By Deployment Type

Figure 87: Asia Pacific Market Attractiveness Analysis, By Industry  Vertical

Figure 88: Asia Pacific Market Attractiveness Analysis, By User Type

Figure 89: Middle East and Africa Market Revenue Forecast, 2022 to 2032 (US$ Million)

Figure 90: Middle East and Africa Market Y-o-Y Growth (%), 2022 to 2032

Figure 91: Middle East and Africa Market Value Share Analysis, By Deployment Type, 2021 and 2032

Figure 92: Middle East and Africa Market Value Share Analysis, By User Type, 2021 and 2032

Figure 93: Middle East and Africa Market Value Share Analysis, By Industry Vertical, 2021 and 2032

Figure 94: Middle East and Africa Market Value Share Analysis, By Country, 2021 and 2032

Figure 95: GCC Countries Market Value Share Analysis, By Deployment Type, 2021 and 2032

Figure 96: GCC Countries Market Value Share Analysis, By User Type, 2021 and 2032

Figure 97: GCC Countries Market Value Share Analysis, By Industry Vertical, 2021 and 2032

Figure 98: South Africa Market Value Share Analysis, By Deployment Type, 2021 and 2032

Figure 99: South Africa Market Value Share Analysis, By User Type, 2021 and 2032

Figure 100: South Africa Market Value Share Analysis, By Industry Vertical, 2021 and 2032

Figure 101: Middle East and Africa Market Attractiveness Analysis, By Country

Figure 102: Middle East and Africa Market Attractiveness Analysis, By Deployment Type

Figure 103: Middle East and Africa Market Attractiveness Analysis, By Industry  Vertical

Figure 104: Middle East and Africa Market Attractiveness Analysis, By User Type

Figure 105: South America Market Revenue Forecast, 2022 to 2032 (US$ Million)

Figure 106: South America Market Y-o-Y Growth (%), 2022 to 2032

Figure 107: South America Market Value Share Analysis, By Deployment Type, 2021 and 2032

Figure 108: South America Market Value Share Analysis, By User Type, 2021 and 2032

Figure 109: South America Market Value Share Analysis, By Industry Vertical, 2021 and 2032

Figure 110: South America Market Value Share Analysis, By Country, 2021 and 2032

Figure 111: Brazil Market Value Share Analysis, By Deployment Type, 2021 and 2032

Figure 112: Brazil Market Value Share Analysis, By User Type, 2021 and 2032

Figure 113: Brazil Market Value Share Analysis, By Industry Vertical, 2021 and 2032

Figure 114: South America Market Attractiveness Analysis, By Country

Figure 115: South America Market Attractiveness Analysis, By Deployment Type

Figure 116: South America Market Attractiveness Analysis, By Industry  Vertical

Figure 117: South America Market Attractiveness Analysis, By User Type

Recommendations

Technology

Complexion Analysis System Market

Published : June 2023

Technology

Offshore Structural Analysis Software Market

Published : May 2022

Technology

Spend Analysis Software Market

Published : November 2021

Explore Technology Insights

View Reports

Network Traffic Analysis Solutions Market