Reports

- Global Locations -

Headquarters

Future Market Insights, Inc.

Christiana Corporate, 200
Continental Drive, Suite 401,
Newark, Delaware - 19713,
United States

T: +1-845-579-5705

Americas

Future Market Insights, Inc.

616 Corporate Way, Suite 2-9018,
Valley Cottage, NY 10989, United States

T: +1-347-918-3531

MEA

Future Market Insights

1602-6 Jumeirah Bay X2 Tower, Plot No: JLT-PH2-X2A,
Jumeirah Lakes Towers, Dubai,
United Arab Emirates

Europe

Future Market Insights

3rd Floor, 207 Regent Street,
W1B 3HH London
United Kingdom

T: + 44 (0) 20 8123 9659
D: +44 (0) 20 3287 4268

Asia Pacific

Future Market Insights

IndiaLand Global Tech Park, Unit UG-1, Behind Grand HighStreet, Phase 1, Hinjawadi, MH, Pune – 411057, India

Network Security Policy Management Market Outlook (2022 to 2032)

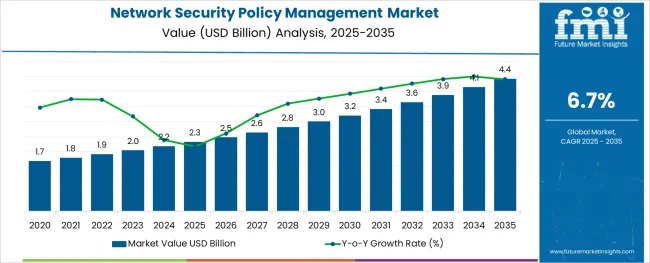
[306 Pages Report] The network security policy management market is poised to attain a CAGR of 6.7% during the forecast period 2022 to 2032.

The network security policy management market is anticipated to garner a revenue of US$ 1.9 Billion in 2022 and is likely to reach US$ 3.6 Billion by 2032.

The adoption of network security policy management is on the surge owing to the increasing volume of online transactions and operations and security not only saves data but also protects against online threats.

The adoption trends of digital payments are exploding, and as a great deal of sensitive information is at stake through the availability of online payments, the user's card number, bank details, and personal information, the network security policy management market growth has risen.

In addition, the growing popularity of Internet banking is driving up demand for network security policy management services, and rising digital risks and data breaches boosts the network security policy management market trends and forecasts.

Attributes Details
Network Security Policy Management Market CAGR (2022 to 2032) 6.7%
Network Security Policy Management Market Value (2022) US$ 1.9 Billion
Network Security Policy Management Market Size (2032) US$ 3.6 Billion

Don't pay for what you don't need

Customize your report by selecting specific countries or regions and save 30%!

What effect did COVID-19 have on the Network Security Policy Management Market?

The global industry has faced numerous challenges as a result of the covid 19 outbreak. Due to the pandemic, the network security policy management market outlook is undergoing several changes.

Lockdowns all over the world are causing significant problems for the network security policy management market.

The network security policy management market’s supply chain has been disrupted, and the network security policy management market trends are discouraged by social distancing and other restrictions on item delivery.

During the pandemic, however, the number of users who work from home is increasing, auguring well for the network security policy management future trends.

In addition, the demand for the ICT industry is constantly increasing, and as more employees use home computers for work, the demand for network security policy management is moving forward.

The network security management policy market is currently unable to meet demand. However, after December 19, market operations returned to normal.

What Factors are Primarily Influencing the Network Security Policy Management Market?

Today, cyber threats affect more than just personal computers as they also affect office systems, encouraged by many workplaces in many regions which have a weak network layer.

Data breaches, cybercrime, and threats can all easily disrupt networks in the workplace. Furthermore, the network contains a massive amount of sensitive data. All of this contributes to increased cyber threat issues in businesses.

Hence, the adoption of network security policy management across the world is on the rise, thereby curbing several cyber-attacks.

Many businesses are increasing their investments in network security management, in turn fostering the network security policy management key trends & opportunities.

In many parts of the world, people are unaware of the cyber threat; as a result of which, many businesses fail to take cyber threats seriously, which, in turn, impedes the adoption of network security policy management services in those regions.

Another factor restraining the demand for network security policy management services is that most of the time, these cyber threats are discovered after significant damage has been done, which is considered vain.

Many places have a scarcity of network-security policy management solutions hampering the network security policy management market opportunities.

Most businesses do not invest in network security policies as some businesses believe it requires a large initial investment, and this notion is likely to negatively affect the network security policy management market statistics.

The high initial investment is a major stumbling block in the network security policy management market's future trends.

Sudip Saha
Sudip Saha

Principal Consultant

Talk to Analyst

Find your sweet spots for generating winning opportunities in this market.

Comparative View of Adjacent Network Security Policy Management Market

Network Security Policy Management Market:

Attributes Network Security Policy Management Market
CAGR (2022 to 2032) 6.7%
Market Value (2026) US$ 2.6 Billion
Growth Factor An increase in the number and severity of cyber-attacks is a critical factor driving the market growth.
Opportunity Increased technological advancements and modernization of software used, as well as increased research and development activities in the market, are expected to create new opportunities for the security policy management market during the forecast period.
Key Trends Many businesses are anticipated to increase their network security policy management market investments in the coming years and the same is considered a major market trend.

Network Security Firewalls Market:

Attributes Network Security Firewalls Market
CAGR (2022 to 2032) 21%
Market Value (2026) US$ 10.9 Billion
Growth Factor Concerns about network security and privacy have resulted in an increase in the number of threats. This, combined with the fact that there are only a few fire protection vendors, has increased demand for network security, thereby accelerating the growth of the global network security firewall market.
Opportunity Increased adoption of IoT and cloud computing is expected to provide lucrative opportunities for global market expansion during the forecast period.
Key Trends Increasing investments in cyber security solutions to prevent smart asset theft and compromise of systems used to monitor and control security systems and the state.

Content Delivery Network Security Market:

Attributes Content Delivery Network Security Market
CAGR (2022 to 2032) 12%
Market Value (2026) US$ 22.7 Billion
Growth Factor The demand for CDN security services is expected to rise as a result of 5G. The deployment of 5G infrastructure will increase bandwidth, resulting in a greater demand for high-quality video services.
Opportunity Increased mobile device adoption, the popularity of large screens, and investments in original content creation are all driving consumption.
Key Trends Cloud-based WAF is becoming increasingly popular among organizations for protecting their public-facing web applications owing to the traditional corporate website,

Major factors scaling up the network security policy management market growth include the need to expand the activity of the business process with security, the need to reduce reliance on the human process, and rising geopolitical tension.

The increase in investments by the air defence sector as a result of rising geopolitical tensions is also expected to augur well for the network security policy management market future trends.

Cross-communication and data exchange is becoming more common in the commercial sector. As a result, businesses are planning to beef up security, increasing the demand for network security policy management in the coming years.

Increased investment in the air defence sector as a result of increased geopolitical tensions is also expected to enlarge the network security policy management market size during the forecast period.

Network security policy management services adoption trends are facilitated by increased investment in R&D programmes for the development of multiple preventive safety policies and guidelines provided by regulatory agencies.

Working with international universities and leading providers to develop effective security policies, as well as the development of technologically advanced infrastructure and ongoing research projects, are opening up a wide array of network security policy management market opportunities.

How is the Segmentation in the Network Security Policy Management Market?

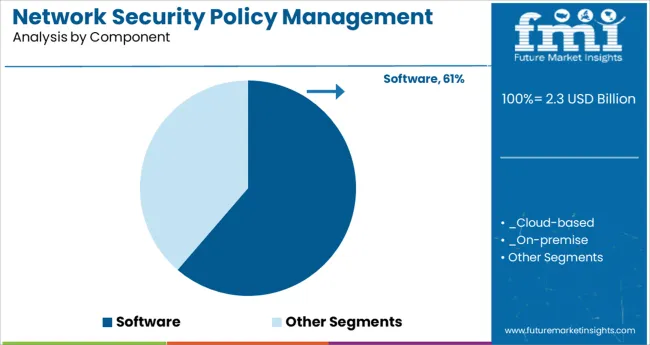
By component, the network security policy management market is segmented into software and services, where the Software segment is sub-segmented into Cloud-Based, On-Premise, and Services are sub-segmented into professional Services, and Managed Services.

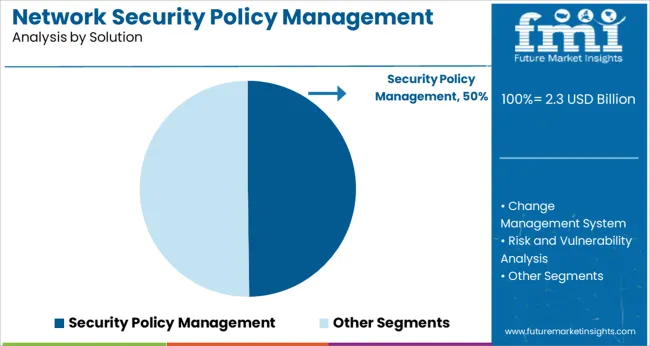
By solution, the market is categorized into security policy management, change management system, risk and vulnerability analysis, and application connectivity management.

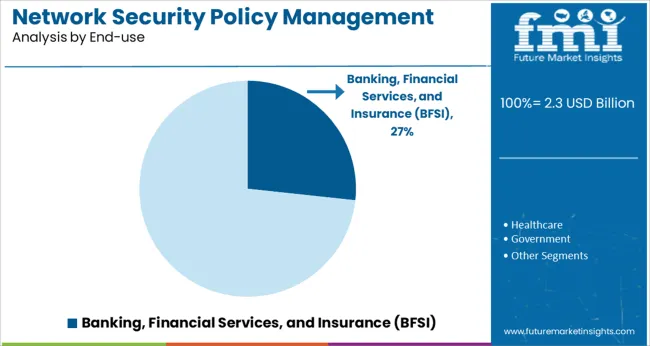
The market, on the basis of end-user, is segmented into Banking, Financial Services and Insurance (BFSI), healthcare, government, IT & telecom, retail, transportation, energy & utilities, and others.

By enterprise size, the security policy management market is categorized into Small & Medium Enterprises (SMEs), and large enterprises.

Get the data you need at a Fraction of the cost

Personalize your report by choosing insights you need
and save 40%!

Which Segment is Likely to Lead the Network Security Policy Management Market, by Component?

The services segment is anticipated to lead the network policy management market with a CAGR of 9.0% during the forecast period 2022 to 2032.

The service segment is likely to dominate the market during the forecast period as a result of its growing popularity and use, and this trend is expected to continue in the forecast period as networking and cross-communications among IT industries increase.

Which Segment is Expected to Dominate the Network Security Policy Management Market, Based on End-Use?

Banking, Financial Services, and Insurance (BFSI) is expected to dominate the market growing at a rate of 7.4% from 2022 to 2032.

The BFSI industry vertical is expected to have the largest network security policy management market share as it deals with large amounts of sensitive and private financial data and as the BFSI is the most targeted industry vertical.

Enterprises in the BFSI sector are requesting security policy management solutions to ensure irreversible security. Furthermore, the industry vertical is the most regulated, as it must meet numerous security requirements.
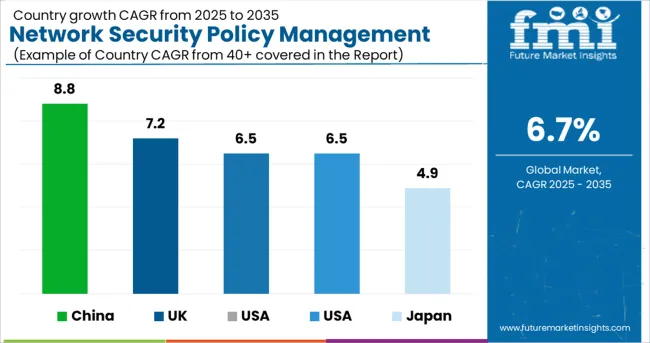
What is the Regional-Outlook for the Network Security Policy Management Market?

Regions CAGR (2022 to 2032)
USA Market 6.5%
UK Market 7.2%
China Market 8.8%
Japan Market 4.9%
India Market 6.5%

During the forecast period, the US market is anticipated to experience high profitability rates with a CAGR of 6.5% from 2022 to 2032.

In these regions, there is also an exceptional network security policy management market with top leaders vying for a larger network security policy management market share.

The market's key players are likely to make numerous developments contributing to the region’s network security policy management market statistics.

Demand for network security policy management services in India and China is constantly increasing since cyber-attacks, data breaches, and the misuse of sensitive information are all on the rise.

As the Indian and Chinese regions have less secure online networks, the trajectory for network security policy management services adoption trends is likely to go up as they are much needed in those regions.

There is a great deal of concern about cyber-attacks. As a result, network security policy adoption is likely to be higher during the forecast period.

Emerging trends in the network security policy management market are growing trend in the UK. This is considered a significant contributor to the global network security policy management market growth.
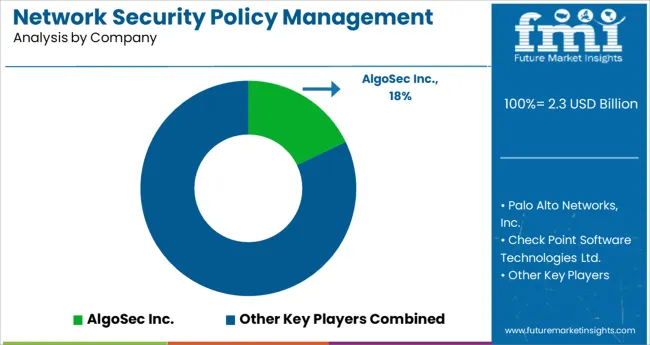
How Strong is the Competition in the Network Security Policy Management Market?

There is comparatively less competition in the network security policy management market.

However, network security policy management market growth is rapidly increasing as new businesses are expected to emerge during the forecast period.

There are also network security policy management market opportunities for large corporations to invest in the market.

The security policy management vendors are working to raise awareness about security solutions.

Product changes and technological advancements are examples of market developments.

During this time, the market's key players are forming new alliances and planning market expansion strategies in order to consolidate their market position by expanding their network security policy management market share.

Some of the recent developments in the network security policy management market are as follows:

  • The major players in North America are acquiring shares from other markets. It opens up more market expansion opportunities for network security.
  • The key players are developing network security to provide enterprises with internal and external security.
  • Micro Focus released AD Bridge 1.0. This product enables customers to better manage and secure Linux resources by leveraging their existing investment in Active Directory.

Vital Market Players include:

  • AlgoSec Inc.
  • Palo Alto Networks, Inc.
  • Check Point Software Technologies Ltd.
  • FireMon, LLC.
  • Forcepoint LLC

Key Segments:

By Component:

  • Software
    • Cloud-Based
    • On-Premise
  • Services
    • Professional Services
    • Managed Services

By Solution:

  • Security Policy Management
  • Change Management System
  • Risk and Vulnerability Analysis
  • Application Connectivity Management

By End-use:

  • Banking
  • Financial Services and Insurance (BFSI)
  • Healthcare, Government
  • IT & Telecom, Retail, Transportation
  • Energy & Utilities
  • Others

By Enterprise Size:

  • Small & Medium Enterprises (SMEs)
  • Large Enterprises

By Region:

  • North America
  • Europe
  • Asia Pacific
  • Middle East & Africa
  • South America

Frequently Asked Questions

What is the Growth Outlook for the Network Security Policy Management Market?

The network security policy management market is projected to register a CAGR of 6.7% during the forecast period (2022 to 2032).

Which Region Holds a Sway in the Network Security Policy Management Market?

During the projected period, the US is expected to lead the email marketing market with a CAGR of 6.5% through 2032.

Which Segment is Likely to Lead the Network Security Policy Management Market by Component?

Services segment is anticipated to lead the network security policy management market with a CAGR of 9.0% during the forecast period 2022 to 2032.

What is Estimated Network Security Policy Management Market Size by 2032?

The network security policy management market is expected to be valued at US$ 3.6 Billion by 2032.

Which Region has the Highest Growth Potential?

The network security policy management market’s fastest-growing region is expected to be China with a CAGR of 8.8% from 2022 to 2032.

Table of Content

1. Preface | Network Security Policy Management Market

    1.1. Market Scope

    1.2. Market Segmentation

    1.3. Key Research Objectives

2. Assumptions and Research Methodology

    2.1. Market Taxonomy - Segment Definitions

    2.2. Research Methodology

        2.2.1. List of Primary and Secondary Sources

    2.3. Key Assumptions for Data Modelling

3. Executive Summary: Global Market

4. Market Overview

    4.1. Introduction

    4.2. Global Market - Macro Economic Factors Overview

        4.2.1. Global ICT Spending (US$ Million), 2016 to 2032

        4.2.2. Key Regional Socio-Political-Technological Developments and their Impact Considerations

    4.3. Technology/Product Roadmap

    4.4. Key Market Indicators

        4.4.1. Features Analysis: Solution

            4.4.1.1. Auditing and Compliance

            4.4.1.2. Change Management

            4.4.1.3. Micro-segmentation

            4.4.1.4. Risk Management

            4.4.1.5. Digital Transformation

            4.4.1.6. DevOps

    4.5. Market Factor Analysis

        4.5.1. Porter’s Five Forces Analysis

        4.5.2. PESTLE Analysis

        4.5.3. Ecosystem Analysis

        4.5.4. Market Dynamics (Growth Influencers)

            4.5.4.1. Drivers

                4.5.4.1.1. Supply Side

                4.5.4.1.2. Demand Side

            4.5.4.2. Restraints

            4.5.4.3. Opportunities

            4.5.4.4. Impact Analysis of Drivers & Restraints

    4.6. Regulations and Policies

    4.7. Case Studies: Solution

    4.8. Impact Analysis of Cyber Attacks: Market

    4.9. Global Market Analysis and Forecast, 2022 to 2032

        4.9.1. Market Revenue Analysis (US$ Million)

            4.9.1.1. Historic Growth Trends, 2016 to 2032

            4.9.1.2. Forecast Trends, 2022 to 2032

    4.10. Market Opportunity Analysis - by Region (Global/North America/Europe/Asia Pacific/Middle East & Africa/South America)

        4.10.1. By Region/Country

        4.10.2. By Component

        4.10.3. By Solution

        4.10.4. By End-use

        4.10.5. By Enterprise Size

    4.11. Competitive Scenario and Trends

        4.11.1. Market Concentration Rate

            4.11.1.1. List of New Entrants 

        4.11.2. Mergers & Acquisitions, Expansions

    4.12. Market Outlook

5. Global Market Analysis and Forecast, by Component

    5.1. Overview and Definitions

    5.2. Key Segment Analysis

    5.3. Market Size (US$ Million) Forecast, by Component, 2022 to 2032

    5.4. Software

        5.4.1. Cloud-based

            5.4.1.1. Public

            5.4.1.2. Private

            5.4.1.3. Hybrid

        5.4.2. On-premise

    5.5. Services

        5.5.1. Professional Services

        5.5.2. Managed Services

6. Global Market Analysis and Forecast, by Solution

    6.1. Overview and Definitions

    6.2. Key Segment Analysis

    6.3. Market Size (US$ Million) Forecast, by Solution, 2022 to 2032

        6.3.1. Security Policy Management

        6.3.2. Change Management System

        6.3.3. Risk and Vulnerability Analysis

        6.3.4. Application Connectivity Management

7. Global Market Analysis and Forecast, by End-use

    7.1. Overview and Definitions

    7.2. Key Segment Analysis

    7.3. Market Size (US$ Million) Forecast, by End-use, 2022 to 2032

        7.3.1. Banking, Financial Services, and Insurance (BFSI)

        7.3.2. Healthcare

        7.3.3. Government

        7.3.4. IT & Telecom

        7.3.5. Retail

        7.3.6. Transportation

        7.3.7. Energy & Utilities

        7.3.8. Others

8. Global Market Analysis and Forecast, by Enterprise Size

    8.1. Overview and Definitions

    8.2. Key Segment Analysis

    8.3. Market Size (US$ Million) Forecast, by Enterprise Size, 2022 to 2032

        8.3.1. Small & Medium Enterprises (SMEs)

        8.3.2. Large Enterprises

9. Global Market Analysis and Forecast, by Region

    9.1. Overview

    9.2. Key Segment Analysis

    9.3. Market Size (US$ Million) Forecast, by Region, 2022 to 2032

        9.3.1. North America

        9.3.2. Europe

        9.3.3. Asia Pacific

        9.3.4. Middle East & Africa

        9.3.5. South America

10. North America Market Analysis and Forecast

    10.1. Key Findings

    10.2. Impact Analysis of Drivers and Restraints

    10.3. Market Size (US$ Million) Forecast, by Component, 2022 to 2032

        10.3.1. Software

            10.3.1.1. Cloud-based

                10.3.1.1.1. Public

                10.3.1.1.2. Private

                10.3.1.1.3. Hybrid

            10.3.1.2. On-premise

        10.3.2. Services

            10.3.2.1. Professional Services

            10.3.2.2. Managed Services

    10.4. Market Size (US$ Million) Forecast, by solution, 2022 to 2032

        10.4.1. Security Policy Management

        10.4.2. Change Management System

        10.4.3. Risk and Vulnerability Analysis

        10.4.4. Application Connectivity Management

    10.5. Market Size (US$ Million) Forecast, by End-use, 2022 to 2032

        10.5.1. Banking, Financial Services, and Insurance (BFSI)

        10.5.2. Healthcare

        10.5.3. Government

        10.5.4. IT & Telecom

        10.5.5. Retail

        10.5.6. Transportation

        10.5.7. Energy & Utilities

        10.5.8. Others

    10.6. Market Size (US$ Million) Forecast, by Enterprise Size, 2022 to 2032

        10.6.1. Small & Medium Enterprises (SMEs)

        10.6.2. Large Enterprises

    10.7. Market Size (US$ Million) Forecast, by Country and Region, 2022 to 2032

        10.7.1. The USA

        10.7.2. Canada

        10.7.3. Rest of North America

11. Europe Market Analysis and Forecast

    11.1. Key Findings

    11.2. Impact Analysis of Drivers and Restraints

    11.3. Market Size (US$ Million) Forecast, by Component, 2022 to 2032

        11.3.1. Software

            11.3.1.1. Cloud-based

                11.3.1.1.1. Public

                11.3.1.1.2. Private

                11.3.1.1.3. Hybrid

            11.3.1.2. On-premise

        11.3.2. Services

            11.3.2.1. Professional Services

            11.3.2.2. Managed Services

    11.4. Market Size (US$ Million) Forecast, by solution, 2022 to 2032

        11.4.1. Security Policy Management

        11.4.2. Change Management System

        11.4.3. Risk and Vulnerability Analysis

        11.4.4. Application Connectivity Management

    11.5. Market Size (US$ Million) Forecast, by End-use, 2022 to 2032

        11.5.1. Banking, Financial Services, and Insurance (BFSI)

        11.5.2. Healthcare

        11.5.3. Government

        11.5.4. IT & Telecom

        11.5.5. Retail

        11.5.6. Transportation

        11.5.7. Energy & Utilities

        11.5.8. Others

    11.6. Market Size (US$ Million) Forecast, by Enterprise Size, 2022 to 2032

        11.6.1. Small & Medium Enterprises (SMEs)

        11.6.2. Large Enterprises

    11.7. Market Size (US$ Million) Forecast, by Country and Region, 2022 to 2032

        11.7.1. Germany

        11.7.2. France

        11.7.3. The UK

        11.7.4. Rest of Europe

12. Asia Pacific Market Analysis and Forecast

    12.1. Key Findings

    12.2. Impact Analysis of Drivers and Restraints

    12.3. Market Size (US$ Million) Forecast, by Component, 2022 to 2032

        12.3.1. Software

            12.3.1.1. Cloud-based

                12.3.1.1.1. Public

                12.3.1.1.2. Private

                12.3.1.1.3. Hybrid

            12.3.1.2. On-premise

        12.3.2. Services

            12.3.2.1. Professional Services

            12.3.2.2. Managed Services

    12.4. Market Size (US$ Million) Forecast, by Solution, 2022 to 2032

        12.4.1. Security Policy Management

        12.4.2. Change Management System

        12.4.3. Risk and Vulnerability Analysis

        12.4.4. Application Connectivity Management

    12.5. Market Size (US$ Million) Forecast, by End-use, 2022 to 2032

        12.5.1. Banking, Financial Services, and Insurance (BFSI)

        12.5.2. Healthcare

        12.5.3. Government

        12.5.4. IT & Telecom

        12.5.5. Retail

        12.5.6. Transportation

        12.5.7. Energy & Utilities

        12.5.8. Others

    12.6. Market Size (US$ Million) Forecast, by Enterprise Size, 2022 to 2032

        12.6.1. Small & Medium Enterprises (SMEs)

        12.6.2. Large Enterprises

    12.7. Market Size (US$ Million) Forecast, by Country and Region, 2022 to 2032

        12.7.1. China

        12.7.2. India

        12.7.3. Japan

        12.7.4. Rest of Asia Pacific

13. Middle East &Africa (MEA) Market Analysis and Forecast

    13.1. Key Findings

    13.2. Impact Analysis of Drivers and Restraints

    13.3. Market Size (US$ Million) Forecast, by Component, 2022 to 2032

        13.3.1. Software

            13.3.1.1. Cloud-based

                13.3.1.1.1. Public

                13.3.1.1.2. Private

                13.3.1.1.3. Hybrid

            13.3.1.2. On-premise

        13.3.2. Services

            13.3.2.1. Professional Services

            13.3.2.2. Managed Services

    13.4. Market Size (US$ Million) Forecast, by Solution, 2022 to 2032

        13.4.1. Security Policy Management

        13.4.2. Change Management System

        13.4.3. Risk and Vulnerability Analysis

        13.4.4. Application Connectivity Management

    13.5. Market Size (US$ Million) Forecast, by End-use, 2022 to 2032

        13.5.1. Banking, Financial Services, and Insurance (BFSI)

        13.5.2. Healthcare

        13.5.3. Government

        13.5.4. IT & Telecom

        13.5.5. Retail

        13.5.6. Transportation

        13.5.7. Energy & Utilities

        13.5.8. Others

    13.6. Market Size (US$ Million) Forecast, by Enterprise Size, 2022 to 2032

        13.6.1. Small & Medium Enterprises (SMEs)

        13.6.2. Large Enterprises

    13.7. Market Size (US$ Million) Forecast, by Country and Region, 2022 to 2032

        13.7.1. GCC Countries

        13.7.2. South Africa

        13.7.3. Rest of MEA

14. South America Market Analysis and Forecast

    14.1. Key Findings

    14.2. Impact Analysis of Drivers and Restraints

    14.3. Market Size (US$ Million) Forecast, by Component, 2022 to 2032

        14.3.1. Software

            14.3.1.1. Cloud-based

                14.3.1.1.1. Public

                14.3.1.1.2. Private

                14.3.1.1.3. Hybrid

            14.3.1.2. On-premise

        14.3.2. Services

            14.3.2.1. Professional Services

            14.3.2.2. Managed Services

    14.4. Market Size (US$ Million) Forecast, by solution, 2022 to 2032

        14.4.1. Security Policy Management

        14.4.2. Change Management System

        14.4.3. Risk and Vulnerability Analysis

        14.4.4. Application Connectivity Management

    14.5. Market Size (US$ Million) Forecast, by End-use, 2022 to 2032

        14.5.1. Banking, Financial Services, and Insurance (BFSI)

        14.5.2. Healthcare

        14.5.3. Government

        14.5.4. IT & Telecom

        14.5.5. Retail

        14.5.6. Transportation

        14.5.7. Energy & Utilities

        14.5.8. Others

    14.6. Market Size (US$ Million) Forecast, by Enterprise Size, 2022 to 2032

        14.6.1. Small & Medium Enterprises (SMEs)

        14.6.2. Large Enterprises

    14.7. Market Size (US$ Million) Forecast, by Country and Region, 2022 to 2032

        14.7.1. Brazil

        14.7.2. Rest of South America

15. Competition Landscape

    15.1. Market Player - Competition Matrix

    15.2. Market Revenue Share Analysis (%), by Company (2021)

    15.3. Regional Presence (Intensity Map)

16. Company Profiles(Details - Business Overview, Sales Area/Geographical Presence, Revenue and Strategy)

    16.1. AlgoSec Inc.

        16.1.1. Business Overview

        16.1.2. Sales Area/Geographical Revenue 

        16.1.3. Business Strategy

    16.2. Palo Alto Networks, Inc.

        16.2.1. Business Overview

        16.2.2. Sales Area/Geographical Revenue 

        16.2.3. Business Strategy

    16.3. Check Point Software Technologies Ltd.

        16.3.1. Business Overview

        16.3.2. Sales Area/Geographical Revenue 

        16.3.3. Business Strategy

    16.4. FireMon, LLC.

        16.4.1. Business Overview

        16.4.2. Sales Area/Geographical Revenue

        16.4.3. Business Strategy

    16.5. Forcepoint LLC

        16.5.1. Business Overview

        16.5.2. Sales Area/Geographical Revenue

        16.5.3. Business Strategy

    16.6. Hewlett Packard Enterprise Development LP

        16.6.1. Business Overview

        16.6.2. Sales Area/Geographical Revenue

        16.6.3. Business Strategy

    16.7. IBM Corporation

        16.7.1. Business Overview

        16.7.2. Sales Area/Geographical Revenue

        16.7.3. Business Strategy

    16.8. Juniper Networks, Inc.

        16.8.1. Business Overview

        16.8.2. Sales Area/Geographical Revenue

        16.8.3. Business Strategy

    16.9. Sophos Ltd.

        16.9.1. Business Overview

        16.9.2. Sales Area/Geographical Revenue

        16.9.3. Business Strategy

    16.10. Tufin Software Technologies Ltd.

        16.10.1. Business Overview

        16.10.2. Sales Area/Geographical Revenue

        16.10.3. Business Strategy

17. Key Takeaways

Don't pay for what you don't need

Customize your report by selecting specific countries or regions and save 30%!

List of Tables

Table 1: Global Market Value (US$ Million) Forecast, by Component, 2022 to 2032

Table 2: Global Market Value (US$ Million) Forecast, by Cloud-Based Software, 2022 to 2032

Table 3: Global Market Value (US$ Million) Forecast, by Enterprise Size, 2022 to 2032

Table 4: Global Market Value (US$ Million) Forecast, by Solution, 2022 to 2032

Table 5: Global Market Value (US$ Million) Forecast, by End-use, 2022 to 2032

Table 6: Global Market Value (US$ Million) Forecast, by Region, 2022 to 2032

Table 7: North America Market Value (US$ Million) Forecast, by Component, 2022 to 2032

Table 8: North America Market Value (US$ Million) Forecast, by Cloud-Based Software, 2022 to 2032

Table 9: North America Market Value (US$ Million) Forecast, by Enterprise Size, 2022 to 2032

Table 10: North America Market Value (US$ Million) Forecast, by Solution, 2022 to 2032

Table 11: North America Market Value (US$ Million) Forecast, by End-use, 2022 to 2032

Table 12: North America Market Value (US$ Million) Forecast, by Country, 2022 to 2032

Table 13: Europe Market Value (US$ Million) Forecast, by Component, 2022 to 2032

Table 14: Europe Market Value (US$ Million) Forecast, by Cloud-Based Software, 2022 to 2032

Table 15: Europe Market Value (US$ Million) Forecast, by Enterprise Size, 2022 to 2032

Table 16: Europe Market Value (US$ Million) Forecast, by Solution, 2022 to 2032

Table 17: Europe Market Value (US$ Million) Forecast, by End-use, 2022 to 2032

Table 18: Europe Market Value (US$ Million) Forecast, by Country, 2022 to 2032

Table 19: Asia Pacific Market Value (US$ Million) Forecast, by Component, 2022 to 2032

Table 20: Asia Pacific Market Value (US$ Million) Forecast, by Cloud-Based Software, 2022 to 2032

Table 21: Asia Pacific Market Value (US$ Million) Forecast, by Enterprise Size, 2022 to 2032

Table 22: Asia Pacific Market Value (US$ Million) Forecast, by Solution, 2022 to 2032

Table 23: Asia Pacific Market Value (US$ Million) Forecast, by End-use, 2022 to 2032

Table 24: Asia Pacific Market Value (US$ Million) Forecast, by Country, 2022 to 2032

Table 25: Middle East & Africa Market Value (US$ Million) Forecast, by Component, 2022 to 2032

Table 26: Middle East & Africa Market Value (US$ Million) Forecast, by Cloud Based Software, 2022 to 2032

Table 27: Middle East & Africa Market Value (US$ Million) Forecast, by Enterprise Size, 2022 to 2032

Table 28: Middle East & Africa Market Value (US$ Million) Forecast, by Solution, 2022 to 2032

Table 29: Middle East & Africa Market Value (US$ Million) Forecast, by End-use, 2022 to 2032

Table 30: Middle East & Africa Market Value (US$ Million) Forecast, by Country, 2022 to 2032

Table 31: South America Market Value (US$ Million) Forecast, by Component, 2022 to 2032

Table 32: South America Market Value (US$ Million) Forecast, by Cloud Based Software, 2022 to 2032

Table 33: South America Market Value (US$ Million) Forecast, by Enterprise Size, 2022 to 2032

Table 34: South America Market Value (US$ Million) Forecast, by Solution, 2022 to 2032

Table 35: South America Market Value (US$ Million) Forecast, by End-use, 2022 to 2032

Table 36: South America Market Value (US$ Million) Forecast, by Country, 2022 to 2032
Sudip Saha
Sudip Saha

Principal Consultant

Talk to Analyst

Find your sweet spots for generating winning opportunities in this market.

List of Charts

Figure 1: Market Size (US$ Million) Forecast, 2022 to 2032

Figure 2: Global Market Y-o-Y Growth (Value %), 2022 to 2032

Figure 3: Market Size (US$ Million) Forecast, 2022 to 2032

Figure 4: Global Market Y-o-Y Growth (Value %), 2022 to 2032

Figure 5: Global Market Opportunity Growth Analysis (US$ Million), 2022 to 2032

Figure 6: Global Market Outlook (Value %), by Component

Figure 7: Global Market Outlook (Value %), by Enterprise Size

Figure 8: Global Market Outlook (Value %), by Solution

Figure 9: Global Market Outlook (Value %), by End-use 

Figure 10: Global Market Outlook (Value %), by Region

Figure 11: Global Market Value Share Analysis, by Component, 2021

Figure 12: Global Market Value Share Analysis, by Component, 2021

Figure 13: Global Market Value Share Analysis, by Enterprise Size, 2021

Figure 14: Global Market Value Share Analysis, by Enterprise Size, 2021

Figure 15: Global Market Value Share Analysis, by Solution, 2021

Figure 16: Global Market Value Share Analysis, by Solution, 2021

Figure 17: Global Market Value Share Analysis, by End-use, 2021

Figure 18: Global Market Value Share Analysis, by End-use, 2021

Figure 19: Global Market Value Share Analysis, by Region, 2021

Figure 20: Global Market Value Share Analysis, by Region, 2021

Figure 21: North America Market Value Share Analysis, by Component, 2021

Figure 22: North America Market Value Share Analysis, by Component, 2021

Figure 23: North America Market Value Share Analysis, by Enterprise Size, 2021

Figure 24: North America Market Value Share Analysis, by Enterprise Size, 2021

Figure 25: North America Market Value Share Analysis, by Solution, 2021

Figure 26: North America Market Value Share Analysis, by Solution, 2021

Figure 27: North America Market Value Share Analysis, by End-use, 2021

Figure 28: North America Market Value Share Analysis, by End-use, 2021

Figure 29: North America Market Value Share Analysis, by Country, 2021

Figure 30: North America Market Value Share Analysis, by Country, 2021

Figure 31: Europe Market Value Share Analysis, by Component, 2021

Figure 32: Europe Market Value Share Analysis, by Component, 2021

Figure 33: Europe Market Value Share Analysis, by Enterprise Size, 2021

Figure 34: Europe Market Value Share Analysis, by Enterprise Size, 2021

Figure 35: Europe Market Value Share Analysis, by Solution, 2021

Figure 36: Europe Market Value Share Analysis, by Solution, 2021

Figure 37: Europe Market Value Share Analysis, by End-use, 2021

Figure 38: Europe Market Value Share Analysis, by End-use, 2021

Figure 39: Europe Market Value Share Analysis, by Country, 2021

Figure 40: Europe Market Value Share Analysis, by Country, 2021

Figure 41: Asia Pacific Market Value Share Analysis, by Component, 2021

Figure 42: Asia Pacific Market Value Share Analysis, by Component, 2021

Figure 43: Asia Pacific Market Value Share Analysis, by Enterprise Size, 2021

Figure 44: Asia Pacific Market Value Share Analysis, by Enterprise Size, 2021

Figure 45: Asia Pacific Market Value Share Analysis, by Solution, 2021

Figure 46: Asia Pacific Market Value Share Analysis, by Solution, 2021

Figure 47: Asia Pacific Market Value Share Analysis, by End-use, 2021

Figure 48: Asia Pacific Market Value Share Analysis, by End-use, 2021

Figure 49: Asia Pacific Market Value Share Analysis, by Country, 2021

Figure 50: Asia Pacific Market Value Share Analysis, by Country, 2021

Figure 51: Middle East & Africa Market Value Share Analysis, by Component, 2021

Figure 52: Middle East & Africa Market Value Share Analysis, by Component, 2021

Figure 53: Middle East & Africa Market Value Share Analysis, by Enterprise Size, 2021

Figure 54: Middle East & Africa Market Value Share Analysis, by Enterprise Size, 2021

Figure 55: Middle East & Africa Market Value Share Analysis, by Solution, 2021

Figure 56: Middle East & Africa Market Value Share Analysis, by Solution, 2021

Figure 57: Middle East & Africa Market Value Share Analysis, by End-use, 2021

Figure 58: Middle East & Africa Market Value Share Analysis, by End-use, 2021

Figure 59: Middle East & Africa Market Value Share Analysis, by Country, 2021

Figure 60: Middle East & Africa Market Value Share Analysis, by Country, 2021

Figure 61: South America Market Value Share Analysis, by Component, 2021

Figure 62: South America Market Value Share Analysis, by Component, 2021

Figure 63: South America Market Value Share Analysis, by Enterprise Size, 2021

Figure 64: South America Market Value Share Analysis, by Enterprise Size, 2021

Figure 65: South America Market Value Share Analysis, by Solution, 2021

Figure 66: South America Market Value Share Analysis, by Solution, 2021

Figure 67: South America Market Value Share Analysis, by End-use, 2021

Figure 68: South America Market Value Share Analysis, by End-use, 2021

Figure 69: South America Market Value Share Analysis, by Country, 2021

Figure 70: South America Market Value Share Analysis, by Country, 2021

Recommendations

Technology

Enterprise Asset Management Market

Published : February 2024

Technology

CDN Security Market

Published : October 2023

Technology

Corporate Web Security Market

Published : June 2022

Technology

Internet of Things (IoT) Security Product Market

Published : July 2017

Explore Technology Insights

View Reports

Network Security Policy Management Market