Reports

- Global Locations -

Headquarters

Future Market Insights, Inc.

Christiana Corporate, 200
Continental Drive, Suite 401,
Newark, Delaware - 19713,
United States

T: +1-845-579-5705

Americas

Future Market Insights, Inc.

616 Corporate Way, Suite 2-9018,
Valley Cottage, NY 10989, United States

T: +1-347-918-3531

MEA

Future Market Insights

1602-6 Jumeirah Bay X2 Tower, Plot No: JLT-PH2-X2A,
Jumeirah Lakes Towers, Dubai,
United Arab Emirates

Europe

Future Market Insights

3rd Floor, 207 Regent Street,
W1B 3HH London
United Kingdom

T: + 44 (0) 20 8123 9659
D: +44 (0) 20 3287 4268

Asia Pacific

Future Market Insights

IndiaLand Global Tech Park, Unit UG-1, Behind Grand HighStreet, Phase 1, Hinjawadi, MH, Pune – 411057, India

Change Management Software Market Outlook

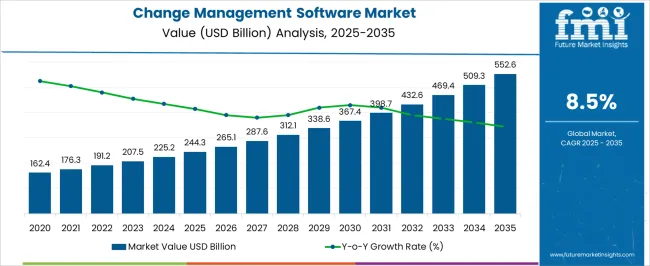
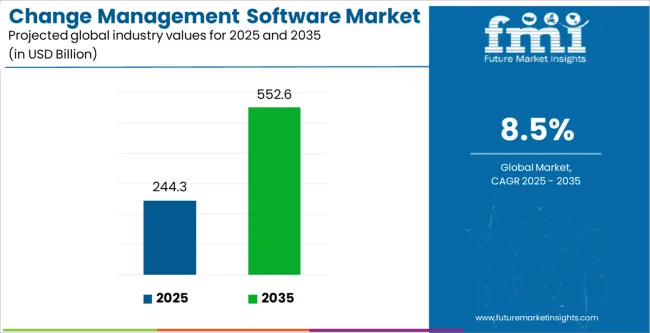
The change management software market is expected to expand its roots at a steady CAGR of 8.9% during the forecast period. The market is likely to hold a revenue of US$ 2.06 billion in 2023 while it is anticipated to cross a value of US$ 4.8 billion by 2033.

As the market for artificial intelligence and machine learning grows, so does the expansion of DevOps. The rising use of AI is projected to give change management software providers huge opportunities.

The demand for change management software is likely to grow as digital transformation, automation of IT processes, and applications become more common.

Change management software aids in reducing the negative consequences of IT migrations on an organization. This factor is likely to contribute to the growth of the market. With the majority of workstations moving to remote locations, the demand for change management software to regularly monitor logs for suspicious activity is rising. Ensure that confidential files are not accessed through log management. This is also expected to boost the sales of change management software in the change management software market during the forecast period.

Attributes Details
Market CAGR (2023 to 2033) 8.9%
Market Size (2023) US$ 2.06 billion
Market Size (2033) US$ 4.8 billion

Don't pay for what you don't need

Customize your report by selecting specific countries or regions and save 30%!

What are the Key Dynamics Governing the Growth of the Change Management Software Market?

The demand for change management software is anticipated to rise as it allows the traceability of changes as well as the support of the change process in a system.

The fundamental goal of change management software is to ensure that changes are implemented in a safe and controlled manner while also controlling risk. The market is being driven by the growing sales of change management software and the demand for consistent means of change evolution in the IT and telecommunications sectors.

The growing demand for change management software for the governance of change structures in making informed decisions and the need for risk management analysis in organizations.

As the increase in cyber-attacks on businesses has grown around the world, the demand for change management software is rising as it is accepted and utilized to combat these threats. The rise in cyber threats and cybercrime has heightened the demand for risk mitigation in end-user businesses.

The sales of change management software are rising as it improves the financial and strategic performance of the business, resulting in a higher Return on Investment (ROI).

A social engineering or polishing attack is also a common component of cyber threats. Change management software is used to counteract these attacks. As a result, the demand for change management software is anticipated to rise during the forecast period. Enterprises can use change management software to understand the risk and the modifications needed to mitigate it.

Factors Propelling the Change Management Software Industry Forward

The rise of the IT and telecommunications industries has resulted in the growth of cloud computing. As well as the growth of cloud-connected devices such as smartphones, laptops, and other gadgets.

The demand for change management software is growing as it helps to eliminate resistance, boost creativity, increase job efficiency, and lower costs. The sales of change management software are rising as it is widely used in the IT and telecommunications industries.

The International Trade Administration (ITA) claims that in the United States, 50 percent of companies with more than 1,000 users employed Cloud Access Security Broker (CASB) technologies. To monitor and control their use of software as a service in 2018.

The rising demand for change management software and cloud computing has increased the possibility of vulnerability attacks on cloud networks. As a result of these advantages, there has been a boom in the adoption of cloud-based CMS software.

In addition, the usage of CMS technologies in vulnerability assessments is anticipated to fuel the sales of change management software during the forecast period.
Sudip Saha
Sudip Saha

Principal Consultant

Talk to Analyst

Find your sweet spots for generating winning opportunities in this market.

Comparative View

Change Management Software Market:

Attributes Change Management Software Market
CAGR (2023 to 2033) 8.9%
Market Value (2023) US$ 2.06 billion
Growth Factor The increase in digital transformation and automation of IT applications and processes is mainly responsible for the market's growth.
Opportunity The expansion of DevOps and the rising use of AI is projected to give change management software providers huge opportunities.
Key Trends Change management software is being used by organizations to understand the risk and the changes that must be mitigated.

Change and Configuration Market:

Attributes Change and Configuration Market
CAGR (2023 to 2033) 10.9%
Market Value (2023) US$ 3.44 billion
Growth Factor Configuration management systems are designed to provide accurate configuration information to aid decision-making resulting in market growth.
Opportunity The change and configuration management market is gaining popularity across numerous industries due to a variety of benefits, including cost savings and faster problem resolution.
Key Trends As the frequency of banking fraud rises, there is a greater necessity to safeguard all endpoints with the use of change and configuration management.

Organizational Change Management Software Market:

Attributes Organizational Change Management Software Market
CAGR (2023 to 2033) 13.5%
Market Value (2023) US$ 3.28 billion
Growth Factor The increasing use of cloud-based solutions, as well as the growing demand for enterprises to provide flexible work options to their employees, are all contributing to the market's growth.
Opportunity Organizational change management software improves accuracy, reduces system downtime, and increases efficiency, all of which are expected to lead to profitable growth opportunities in the market
Key Trends The introduction of advanced technologies and devices to meet rising corporate needs has expanded dramatically, leading to the growing network size.

The rapid expansion of internet connectivity around the world, as well as various technological breakthroughs such as 5G, blockchain, cloud services, Internet of Things (IoT), and Artificial Intelligence (AI), have boosted the demand for change management software. Globally, more than 4.5 billion people were actively using the internet as of April 2021.

The rise of the ICT sector has contributed greatly to GDP growth. Sales of change management software, and research and development spending, among other economic shifts in various countries around the world.

The change management software market is growing due to an increase in digital transformation and automation of IT processes and applications. However, the challenges of integrating technologies and toolsets are limiting market expansion.

Change management software provides the plans, methods, and other relevant artifacts required to construct effective change management software. As well as the documentation set required to support it.

The change management software aids in increasing performance, reducing resistance, lowering expenses, increasing innovation, increasing work efficiency, and simplifying the entire IT change management process. While change can be challenging, spending some effort, time, and money on change management can assist an organization in ensuring that a new business software system is implemented successfully.

Country-wise Insights

Countries Revenue Share % (2023)
United States 18.1%
Germany 6.5%
Japan 3.2%
Australia 1.6%
Countries CAGR % (2023 to 2033)
China 9.6%
India 9.4%
United Kingdom 9.3%

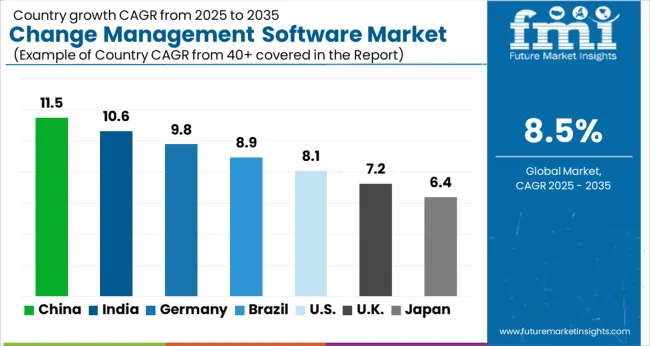
Over the forecast period, Asia Pacific is anticipated to witness the highest growth in the change management software market. China and India are regarded as high-demand markets for change management software, with CAGRs of 9.6% and 9.4%, respectively.

Businesses strive to provide quick access to accurate records, protect themselves from cybersecurity risks, and perform critical duties. Such as decreasing outages and breaches while lowering costs. Due to the growth in IT infrastructures in China, numerous businesses have turned their attention to configuration management. The demand for change management software solutions in the region has been driven by the optimization of IT asset maintenance to avoid discrepancies.

According to the Small and Medium Enterprise Agency (SMEA) of Japan, 99.7% of functional industries come under the small and medium enterprise (SME) group. Making Japan an excellent country for configuration management solutions in the APAC region.

SMEs have favored low to medium-cost options, such as change management software, over ERP solutions because of financial constraints and a lack of IT infrastructure.

For the change and configuration management sector, the Asia Pacific region is quickly becoming one of the fast-growing regions. Change management is emerging as a solution to help global companies cope with frequent challenges that come when dealing with worldwide teams. New expansion regions, and an influx of data as they expand their reach into the Asia Pacific and boost their investments in IT initiatives.

Get the data you need at a Fraction of the cost

Personalize your report by choosing insights you need
and save 40%!

Category-wise Landscape

Category By Deployment Mode
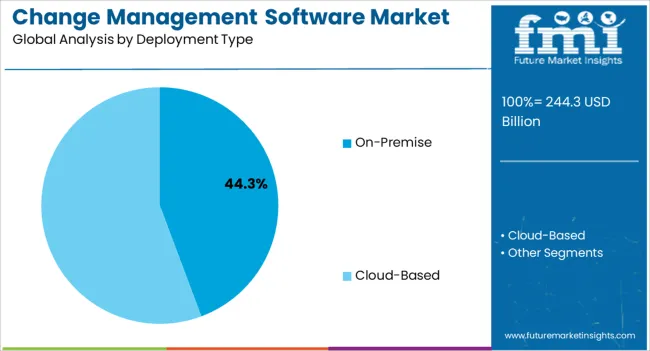
Leading Segment On-Premises
Market Share (2022) 58.7%
Category By component Type
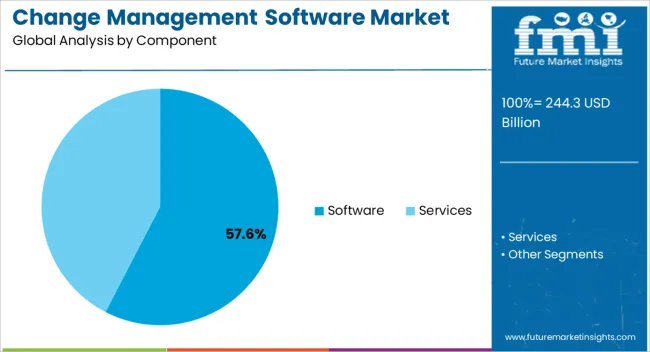
Leading Segment Software
Market Share (2022) 63.4%

Which Segment is likely to Lead the Change Management Software Market by Deployment?

In the change management software market, cloud-based deployment is gaining traction at 11.9%. Though, the on-premise segment leads the market as it held a market share of 58.7% in 2022. The ability to swiftly expand business demands and the shift of customers to the cloud as a result of reduced IT overcapacity are the key reasons driving the growth of cloud-based deployment.

Many public cloud providers are configuring change management on the cloud since they have various tools for installations. Leading to the deployment of cloud-based change management software by many enterprises.

Due to the increased use of cloud networking and expanding internet penetration internationally, the use of cloud-based subscriptions such as Software-as-a-Service (SaaS) has expanded. These factors are propelling the demand for change management software forward.

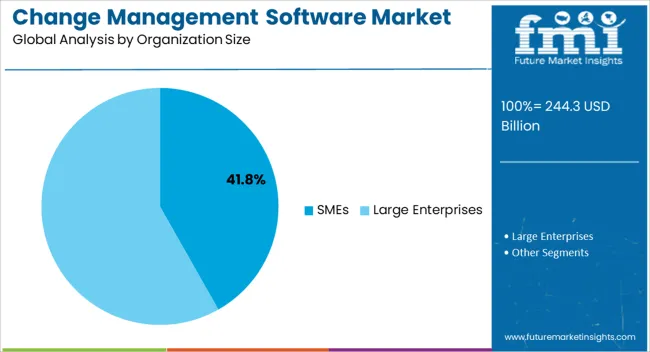
Which Segment is likely to Lead the Change Management Software Market by Organization Size?

Due to the increase in small and medium businesses in developing countries, SMEs are dominating the change management software market. Furthermore, small businesses are using cloud-based networking for their business operations. Such as asset management, blockchain, and others, which is boosting the sales of change management software.

Due to the use of cloud computing, small and medium businesses are dominating the market for change management software, necessitating the demand for change management software in these businesses.

According to the World Bank, small and medium-sized businesses account for 90% of all businesses. Small and medium-sized businesses (SMEs) generate 40% of national income (GDP) in emerging economies. Furthermore, the CMS's increased agility in business operations contributes to the growth of small and medium enter.
Competition Scenario

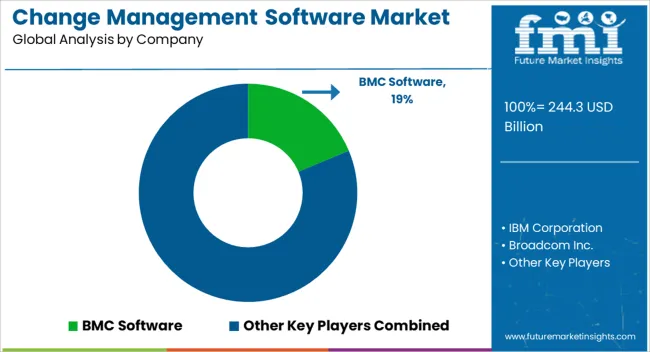
More than half of the market is controlled by a few leading players. The expansion of these firms in the field of cloud technologies coupled with artificial intelligence (AI), IoT, and other technologies is reflected in the analysis of significant market share for these companies. Key players in the change management software market are concentrating their efforts on completing various business models to provide advanced change management solutions

Market Developments

  • Sectigo, a provider of automated digital identity management and web security solutions, said in June 2020 that its Certificate Manager platform has been linked with ServiceNow, a cloud-based digital workflows platform. IT teams can manage huge inventories of certificates in the ServiceNow IT Service Management (ITSM) interface and automate the end-to-end lifecycle of certificates at scale with the Sectigo Certificate App for ServiceNow.
  • In May 2020, Microsoft also announced the creation of a new monthly update channel for enterprises using the Microsoft 365 Apps service. Formerly known as Office 365 ProPlus, as well as plans to rename existing update channels. Microsoft also advises using its most recent update configuration and management tools. This may take into account the forthcoming channel name changes in June 2020.
  • Aruba, a Hewlett Packard Enterprise business, announced the integration of Aruba ClearPass Policy Manager with Microsoft endpoint protection solutions. To provide substantial breakthroughs in enterprise cyberattack prevention in May 2020.
  • BMC Software Inc. announced the release of BMC Helix v20.02, which contains capabilities. Such as BMC Helix Remediate Integrations, which allow blind spot identification, closed-loop modification, and improved configuration management.
  • Broadcom Inc has launched its Change management platform for CA SDM with the features like change managers and change advisory board (CAB).

Key Players

  • BMC Software
  • IBM Corporation
  • Broadcom Inc.
  • Cherwell Software, LLC.
  • Ivanti

Key Segments Covered

By Component:

  • Software
  • Services

By Deployment Type:

  • On-Premise
  • Cloud-based

By Organization Size:

  • SMEs
  • Large Enterprises

By Industry Type:

  • BFSI (Banking, Financial Services, and Insurance)
  • Healthcare and Life Science
  • Education
  • Government and Public Sector
  • Telecom and IT
  • Retail and Consumer Packaged Goods
  • Others

Key Regions Covered:

  • North America
    • United States
    • Canada
  • Latin America
    • Brazil
    • Mexico
    • Rest of Latin America
  • Europe
    • Germany
    • United Kingdom
    • France
    • Spain
    • Russia
    • Rest of Europe
  • Japan
  • Asia Pacific Excluding Japan
    • China
    • India
    • Malaysia
    • Singapore
    • Australia
    • Rest of Asia Pacific Excluding Japan (APEJ)
  • The Middle East and Africa
    • GCC Countries
    • Israel
    • South Africa
    • Middle East and Africa (MEA)

Frequently Asked Questions

How Big is the Change Management Software Market?

The market is estimated to secure a valuation of US$ 2.06 billion in 2023.

Is Change Management Software Market in Demand?

The market is in high demand, expanding at a CAGR of 8.9%.

Which Factors are Facilitating the Sales of Change Management Software Market?

Increasing commonality of automated IT processes and digital transformation.

Which Opportunities are Enhancing the Scope of Market?

Escalated cyber-attacks are expected to push the sales of change management software.

Which Country has High Growth Rate?

China has high growth rate, expanding at a CAGR of 9.6%.

Table of Content

1. Executive Summary

    1.1. Global Market Outlook

    1.2. Demand-side Trends

    1.3. Supply-side Trends

    1.4. Technology Roadmap Analysis

    1.5. Analysis and Recommendations

2. Market Overview

    2.1. Market Coverage / Taxonomy

    2.2. Market Definition / Scope / Limitations

3. Market Background

    3.1. Market Dynamics

        3.1.1. Drivers

        3.1.2. Restraints

        3.1.3. Opportunity

        3.1.4. Trends

    3.2. Scenario Forecast

        3.2.1. Demand in Optimistic Scenario

        3.2.2. Demand in Likely Scenario

        3.2.3. Demand in Conservative Scenario

    3.3. Opportunity Map Analysis

    3.4. Investment Feasibility Matrix

    3.5. PESTLE and Porter’s Analysis

    3.6. Regulatory Landscape

        3.6.1. By Key Regions

        3.6.2. By Key Countries

    3.7. Regional Parent Market Outlook

4. Global Market Analysis 2018 to 2022 and Forecast, 2023 to 2033

    4.1. Historical Market Size Value (US$ Million) Analysis, 2018 to 2022

    4.2. Current and Future Market Size Value (US$ Million) Projections, 2023 to 2033

        4.2.1. Y-o-Y Growth Trend Analysis

        4.2.2. Absolute $ Opportunity Analysis

5. Global Market Analysis 2018 to 2022 and Forecast 2023 to 2033, By Component

    5.1. Introduction / Key Findings

    5.2. Historical Market Size Value (US$ Million) Analysis By Component, 2018 to 2022

    5.3. Current and Future Market Size Value (US$ Million) Analysis and Forecast By Component, 2023 to 2033

        5.3.1. Software

        5.3.2. Services

    5.4. Y-o-Y Growth Trend Analysis By Component, 2018 to 2022

    5.5. Absolute $ Opportunity Analysis By Component, 2023 to 2033

6. Global Market Analysis 2018 to 2022 and Forecast 2023 to 2033, By Deployment Type

    6.1. Introduction / Key Findings

    6.2. Historical Market Size Value (US$ Million) Analysis By Deployment Type, 2018 to 2022

    6.3. Current and Future Market Size Value (US$ Million) Analysis and Forecast By Deployment Type, 2023 to 2033

        6.3.1. On-Premise

        6.3.2. Cloud-based

    6.4. Y-o-Y Growth Trend Analysis By Deployment Type, 2018 to 2022

    6.5. Absolute $ Opportunity Analysis By Deployment Type, 2023 to 2033

7. Global Market Analysis 2018 to 2022 and Forecast 2023 to 2033, By Organization Size

    7.1. Introduction / Key Findings

    7.2. Historical Market Size Value (US$ Million) Analysis By Organization Size , 2018 to 2022

    7.3. Current and Future Market Size Value (US$ Million) Analysis and Forecast By Organization Size , 2023 to 2033

        7.3.1. SMEs

        7.3.2. Large Enterprises

    7.4. Y-o-Y Growth Trend Analysis By Organization Size , 2018 to 2022

    7.5. Absolute $ Opportunity Analysis By Organization Size , 2023 to 2033

8. Global Market Analysis 2018 to 2022 and Forecast 2023 to 2033, By Industry Type

    8.1. Introduction / Key Findings

    8.2. Historical Market Size Value (US$ Million) Analysis By Industry Type, 2018 to 2022

    8.3. Current and Future Market Size Value (US$ Million) Analysis and Forecast By Industry Type, 2023 to 2033

        8.3.1. BFSI

        8.3.2. Healthcare and Life Science

        8.3.3. Education

        8.3.4. Government and Public Sector

        8.3.5. Telecom and IT

        8.3.6. Retail and Consumer Packaged Goods

        8.3.7. Others

    8.4. Y-o-Y Growth Trend Analysis By Industry Type, 2018 to 2022

    8.5. Absolute $ Opportunity Analysis By Industry Type, 2023 to 2033

9. Global Market Analysis 2018 to 2022 and Forecast 2023 to 2033, By Region

    9.1. Introduction

    9.2. Historical Market Size Value (US$ Million) Analysis By Region, 2018 to 2022

    9.3. Current Market Size Value (US$ Million) Analysis and Forecast By Region, 2023 to 2033

        9.3.1. North America

        9.3.2. Latin America

        9.3.3. Europe

        9.3.4. South Asia

        9.3.5. East Asia

        9.3.6. Oceania

        9.3.7. MEA

    9.4. Market Attractiveness Analysis By Region

10. North America Market Analysis 2018 to 2022 and Forecast 2023 to 2033, By Country

    10.1. Historical Market Size Value (US$ Million) Trend Analysis By Market Taxonomy, 2018 to 2022

    10.2. Market Size Value (US$ Million) Forecast By Market Taxonomy, 2023 to 2033

        10.2.1. By Country

            10.2.1.1. The USA

            10.2.1.2. Canada

        10.2.2. By Component

        10.2.3. By Deployment Type

        10.2.4. By Organization Size

        10.2.5. By Industry Type

    10.3. Market Attractiveness Analysis

        10.3.1. By Country

        10.3.2. By Component

        10.3.3. By Deployment Type

        10.3.4. By Organization Size

        10.3.5. By Industry Type

    10.4. Key Takeaways

11. Latin America Market Analysis 2018 to 2022 and Forecast 2023 to 2033, By Country

    11.1. Historical Market Size Value (US$ Million) Trend Analysis By Market Taxonomy, 2018 to 2022

    11.2. Market Size Value (US$ Million) Forecast By Market Taxonomy, 2023 to 2033

        11.2.1. By Country

            11.2.1.1. Brazil

            11.2.1.2. Mexico

            11.2.1.3. Rest of Latin America

        11.2.2. By Component

        11.2.3. By Deployment Type

        11.2.4. By Organization Size

        11.2.5. By Industry Type

    11.3. Market Attractiveness Analysis

        11.3.1. By Country

        11.3.2. By Component

        11.3.3. By Deployment Type

        11.3.4. By Organization Size

        11.3.5. By Industry Type

    11.4. Key Takeaways

12. Europe Market Analysis 2018 to 2022 and Forecast 2023 to 2033, By Country

    12.1. Historical Market Size Value (US$ Million) Trend Analysis By Market Taxonomy, 2018 to 2022

    12.2. Market Size Value (US$ Million) Forecast By Market Taxonomy, 2023 to 2033

        12.2.1. By Country

            12.2.1.1. Germany

            12.2.1.2. United Kingdom

            12.2.1.3. France

            12.2.1.4. Spain

            12.2.1.5. Italy

            12.2.1.6. Rest of Europe

        12.2.2. By Component

        12.2.3. By Deployment Type

        12.2.4. By Organization Size

        12.2.5. By Industry Type

    12.3. Market Attractiveness Analysis

        12.3.1. By Country

        12.3.2. By Component

        12.3.3. By Deployment Type

        12.3.4. By Organization Size

        12.3.5. By Industry Type

    12.4. Key Takeaways

13. South Asia Market Analysis 2018 to 2022 and Forecast 2023 to 2033, By Country

    13.1. Historical Market Size Value (US$ Million) Trend Analysis By Market Taxonomy, 2018 to 2022

    13.2. Market Size Value (US$ Million) Forecast By Market Taxonomy, 2023 to 2033

        13.2.1. By Country

            13.2.1.1. India

            13.2.1.2. Malaysia

            13.2.1.3. Singapore

            13.2.1.4. Thailand

            13.2.1.5. Rest of South Asia

        13.2.2. By Component

        13.2.3. By Deployment Type

        13.2.4. By Organization Size

        13.2.5. By Industry Type

    13.3. Market Attractiveness Analysis

        13.3.1. By Country

        13.3.2. By Component

        13.3.3. By Deployment Type

        13.3.4. By Organization Size

        13.3.5. By Industry Type

    13.4. Key Takeaways

14. East Asia Market Analysis 2018 to 2022 and Forecast 2023 to 2033, By Country

    14.1. Historical Market Size Value (US$ Million) Trend Analysis By Market Taxonomy, 2018 to 2022

    14.2. Market Size Value (US$ Million) Forecast By Market Taxonomy, 2023 to 2033

        14.2.1. By Country

            14.2.1.1. China

            14.2.1.2. Japan

            14.2.1.3. South Korea

        14.2.2. By Component

        14.2.3. By Deployment Type

        14.2.4. By Organization Size

        14.2.5. By Industry Type

    14.3. Market Attractiveness Analysis

        14.3.1. By Country

        14.3.2. By Component

        14.3.3. By Deployment Type

        14.3.4. By Organization Size

        14.3.5. By Industry Type

    14.4. Key Takeaways

15. Oceania Market Analysis 2018 to 2022 and Forecast 2023 to 2033, By Country

    15.1. Historical Market Size Value (US$ Million) Trend Analysis By Market Taxonomy, 2018 to 2022

    15.2. Market Size Value (US$ Million) Forecast By Market Taxonomy, 2023 to 2033

        15.2.1. By Country

            15.2.1.1. Australia

            15.2.1.2. New Zealand

        15.2.2. By Component

        15.2.3. By Deployment Type

        15.2.4. By Organization Size

        15.2.5. By Industry Type

    15.3. Market Attractiveness Analysis

        15.3.1. By Country

        15.3.2. By Component

        15.3.3. By Deployment Type

        15.3.4. By Organization Size

        15.3.5. By Industry Type

    15.4. Key Takeaways

16. MEA Market Analysis 2018 to 2022 and Forecast 2023 to 2033, By Country

    16.1. Historical Market Size Value (US$ Million) Trend Analysis By Market Taxonomy, 2018 to 2022

    16.2. Market Size Value (US$ Million) Forecast By Market Taxonomy, 2023 to 2033

        16.2.1. By Country

            16.2.1.1. GCC Countries

            16.2.1.2. South Africa

            16.2.1.3. Israel

            16.2.1.4. Rest of MEA

        16.2.2. By Component

        16.2.3. By Deployment Type

        16.2.4. By Organization Size

        16.2.5. By Industry Type

    16.3. Market Attractiveness Analysis

        16.3.1. By Country

        16.3.2. By Component

        16.3.3. By Deployment Type

        16.3.4. By Organization Size

        16.3.5. By Industry Type

    16.4. Key Takeaways

17. Key Countries Market Analysis

    17.1. USA

        17.1.1. Pricing Analysis

        17.1.2. Market Share Analysis, 2022

            17.1.2.1. By Component

            17.1.2.2. By Deployment Type

            17.1.2.3. By Organization Size

            17.1.2.4. By Industry Type

    17.2. Canada

        17.2.1. Pricing Analysis

        17.2.2. Market Share Analysis, 2022

            17.2.2.1. By Component

            17.2.2.2. By Deployment Type

            17.2.2.3. By Organization Size

            17.2.2.4. By Industry Type

    17.3. Brazil

        17.3.1. Pricing Analysis

        17.3.2. Market Share Analysis, 2022

            17.3.2.1. By Component

            17.3.2.2. By Deployment Type

            17.3.2.3. By Organization Size

            17.3.2.4. By Industry Type

    17.4. Mexico

        17.4.1. Pricing Analysis

        17.4.2. Market Share Analysis, 2022

            17.4.2.1. By Component

            17.4.2.2. By Deployment Type

            17.4.2.3. By Organization Size

            17.4.2.4. By Industry Type

    17.5. Germany

        17.5.1. Pricing Analysis

        17.5.2. Market Share Analysis, 2022

            17.5.2.1. By Component

            17.5.2.2. By Deployment Type

            17.5.2.3. By Organization Size

            17.5.2.4. By Industry Type

    17.6. United Kingdom

        17.6.1. Pricing Analysis

        17.6.2. Market Share Analysis, 2022

            17.6.2.1. By Component

            17.6.2.2. By Deployment Type

            17.6.2.3. By Organization Size

            17.6.2.4. By Industry Type

    17.7. France

        17.7.1. Pricing Analysis

        17.7.2. Market Share Analysis, 2022

            17.7.2.1. By Component

            17.7.2.2. By Deployment Type

            17.7.2.3. By Organization Size

            17.7.2.4. By Industry Type

    17.8. Spain

        17.8.1. Pricing Analysis

        17.8.2. Market Share Analysis, 2022

            17.8.2.1. By Component

            17.8.2.2. By Deployment Type

            17.8.2.3. By Organization Size

            17.8.2.4. By Industry Type

    17.9. Italy

        17.9.1. Pricing Analysis

        17.9.2. Market Share Analysis, 2022

            17.9.2.1. By Component

            17.9.2.2. By Deployment Type

            17.9.2.3. By Organization Size

            17.9.2.4. By Industry Type

    17.10. India

        17.10.1. Pricing Analysis

        17.10.2. Market Share Analysis, 2022

            17.10.2.1. By Component

            17.10.2.2. By Deployment Type

            17.10.2.3. By Organization Size

            17.10.2.4. By Industry Type

    17.11. Malaysia

        17.11.1. Pricing Analysis

        17.11.2. Market Share Analysis, 2022

            17.11.2.1. By Component

            17.11.2.2. By Deployment Type

            17.11.2.3. By Organization Size

            17.11.2.4. By Industry Type

    17.12. Singapore

        17.12.1. Pricing Analysis

        17.12.2. Market Share Analysis, 2022

            17.12.2.1. By Component

            17.12.2.2. By Deployment Type

            17.12.2.3. By Organization Size

            17.12.2.4. By Industry Type

    17.13. Thailand

        17.13.1. Pricing Analysis

        17.13.2. Market Share Analysis, 2022

            17.13.2.1. By Component

            17.13.2.2. By Deployment Type

            17.13.2.3. By Organization Size

            17.13.2.4. By Industry Type

    17.14. China

        17.14.1. Pricing Analysis

        17.14.2. Market Share Analysis, 2022

            17.14.2.1. By Component

            17.14.2.2. By Deployment Type

            17.14.2.3. By Organization Size

            17.14.2.4. By Industry Type

    17.15. Japan

        17.15.1. Pricing Analysis

        17.15.2. Market Share Analysis, 2022

            17.15.2.1. By Component

            17.15.2.2. By Deployment Type

            17.15.2.3. By Organization Size

            17.15.2.4. By Industry Type

    17.16. South Korea

        17.16.1. Pricing Analysis

        17.16.2. Market Share Analysis, 2022

            17.16.2.1. By Component

            17.16.2.2. By Deployment Type

            17.16.2.3. By Organization Size

            17.16.2.4. By Industry Type

    17.17. Australia

        17.17.1. Pricing Analysis

        17.17.2. Market Share Analysis, 2022

            17.17.2.1. By Component

            17.17.2.2. By Deployment Type

            17.17.2.3. By Organization Size

            17.17.2.4. By Industry Type

    17.18. New Zealand

        17.18.1. Pricing Analysis

        17.18.2. Market Share Analysis, 2022

            17.18.2.1. By Component

            17.18.2.2. By Deployment Type

            17.18.2.3. By Organization Size

            17.18.2.4. By Industry Type

    17.19. GCC Countries

        17.19.1. Pricing Analysis

        17.19.2. Market Share Analysis, 2022

            17.19.2.1. By Component

            17.19.2.2. By Deployment Type

            17.19.2.3. By Organization Size

            17.19.2.4. By Industry Type

    17.20. South Africa

        17.20.1. Pricing Analysis

        17.20.2. Market Share Analysis, 2022

            17.20.2.1. By Component

            17.20.2.2. By Deployment Type

            17.20.2.3. By Organization Size

            17.20.2.4. By Industry Type

    17.21. Israel

        17.21.1. Pricing Analysis

        17.21.2. Market Share Analysis, 2022

            17.21.2.1. By Component

            17.21.2.2. By Deployment Type

            17.21.2.3. By Organization Size

            17.21.2.4. By Industry Type

18. Market Structure Analysis

    18.1. Competition Dashboard

    18.2. Competition Benchmarking

    18.3. Market Share Analysis of Top Players

        18.3.1. By Regional

        18.3.2. By Component

        18.3.3. By Deployment Type

        18.3.4. By Organization Size

        18.3.5. By Industry Type

19. Competition Analysis

    19.1. Competition Deep Dive

        19.1.1. BMC Software

            19.1.1.1. Overview

            19.1.1.2. Product Portfolio

            19.1.1.3. Profitability by Market Segments

            19.1.1.4. Sales Footprint

            19.1.1.5. Strategy Overview

                19.1.1.5.1. Marketing Strategy

        19.1.2. IBM Corporation

            19.1.2.1. Overview

            19.1.2.2. Product Portfolio

            19.1.2.3. Profitability by Market Segments

            19.1.2.4. Sales Footprint

            19.1.2.5. Strategy Overview

                19.1.2.5.1. Marketing Strategy

        19.1.3. Broadcom Inc.

            19.1.3.1. Overview

            19.1.3.2. Product Portfolio

            19.1.3.3. Profitability by Market Segments

            19.1.3.4. Sales Footprint

            19.1.3.5. Strategy Overview

                19.1.3.5.1. Marketing Strategy

        19.1.4. Cherwell Software, LLC.

            19.1.4.1. Overview

            19.1.4.2. Product Portfolio

            19.1.4.3. Profitability by Market Segments

            19.1.4.4. Sales Footprint

            19.1.4.5. Strategy Overview

                19.1.4.5.1. Marketing Strategy

        19.1.5. Ivanti

            19.1.5.1. Overview

            19.1.5.2. Product Portfolio

            19.1.5.3. Profitability by Market Segments

            19.1.5.4. Sales Footprint

            19.1.5.5. Strategy Overview

                19.1.5.5.1. Marketing Strategy

        19.1.6. ServiceNow

            19.1.6.1. Overview

            19.1.6.2. Product Portfolio

            19.1.6.3. Profitability by Market Segments

            19.1.6.4. Sales Footprint

            19.1.6.5. Strategy Overview

                19.1.6.5.1. Marketing Strategy

        19.1.7. EasyVista

            19.1.7.1. Overview

            19.1.7.2. Product Portfolio

            19.1.7.3. Profitability by Market Segments

            19.1.7.4. Sales Footprint

            19.1.7.5. Strategy Overview

                19.1.7.5.1. Marketing Strategy

        19.1.8. Micro Focus and Zoho

            19.1.8.1. Overview

            19.1.8.2. Product Portfolio

            19.1.8.3. Profitability by Market Segments

            19.1.8.4. Sales Footprint

            19.1.8.5. Strategy Overview

                19.1.8.5.1. Marketing Strategy

        19.1.9. Axios Systems

            19.1.9.1. Overview

            19.1.9.2. Product Portfolio

            19.1.9.3. Profitability by Market Segments

            19.1.9.4. Sales Footprint

            19.1.9.5. Strategy Overview

                19.1.9.5.1. Marketing Strategy

        19.1.10. CA Technologies

            19.1.10.1. Overview

            19.1.10.2. Product Portfolio

            19.1.10.3. Profitability by Market Segments

            19.1.10.4. Sales Footprint

            19.1.10.5. Strategy Overview

                19.1.10.5.1. Marketing Strategy

20. Assumptions & Acronyms Used

21. Research Methodology

List of Tables

Table 1: Global Market Value (US$ Million) Forecast by Region, 2018 to 2033

Table 2: Global Market Value (US$ Million) Forecast by Component, 2018 to 2033

Table 3: Global Market Value (US$ Million) Forecast by Deployment Type, 2018 to 2033

Table 4: Global Market Value (US$ Million) Forecast by Organization Size , 2018 to 2033

Table 5: Global Market Value (US$ Million) Forecast by Industry Type, 2018 to 2033

Table 6: North America Market Value (US$ Million) Forecast by Country, 2018 to 2033

Table 7: North America Market Value (US$ Million) Forecast by Component, 2018 to 2033

Table 8: North America Market Value (US$ Million) Forecast by Deployment Type, 2018 to 2033

Table 9: North America Market Value (US$ Million) Forecast by Organization Size , 2018 to 2033

Table 10: North America Market Value (US$ Million) Forecast by Industry Type, 2018 to 2033

Table 11: Latin America Market Value (US$ Million) Forecast by Country, 2018 to 2033

Table 12: Latin America Market Value (US$ Million) Forecast by Component, 2018 to 2033

Table 13: Latin America Market Value (US$ Million) Forecast by Deployment Type, 2018 to 2033

Table 14: Latin America Market Value (US$ Million) Forecast by Organization Size , 2018 to 2033

Table 15: Latin America Market Value (US$ Million) Forecast by Industry Type, 2018 to 2033

Table 16: Europe Market Value (US$ Million) Forecast by Country, 2018 to 2033

Table 17: Europe Market Value (US$ Million) Forecast by Component, 2018 to 2033

Table 18: Europe Market Value (US$ Million) Forecast by Deployment Type, 2018 to 2033

Table 19: Europe Market Value (US$ Million) Forecast by Organization Size , 2018 to 2033

Table 20: Europe Market Value (US$ Million) Forecast by Industry Type, 2018 to 2033

Table 21: South Asia Market Value (US$ Million) Forecast by Country, 2018 to 2033

Table 22: South Asia Market Value (US$ Million) Forecast by Component, 2018 to 2033

Table 23: South Asia Market Value (US$ Million) Forecast by Deployment Type, 2018 to 2033

Table 24: South Asia Market Value (US$ Million) Forecast by Organization Size , 2018 to 2033

Table 25: South Asia Market Value (US$ Million) Forecast by Industry Type, 2018 to 2033

Table 26: East Asia Market Value (US$ Million) Forecast by Country, 2018 to 2033

Table 27: East Asia Market Value (US$ Million) Forecast by Component, 2018 to 2033

Table 28: East Asia Market Value (US$ Million) Forecast by Deployment Type, 2018 to 2033

Table 29: East Asia Market Value (US$ Million) Forecast by Organization Size , 2018 to 2033

Table 30: East Asia Market Value (US$ Million) Forecast by Industry Type, 2018 to 2033

Table 31: Oceania Market Value (US$ Million) Forecast by Country, 2018 to 2033

Table 32: Oceania Market Value (US$ Million) Forecast by Component, 2018 to 2033

Table 33: Oceania Market Value (US$ Million) Forecast by Deployment Type, 2018 to 2033

Table 34: Oceania Market Value (US$ Million) Forecast by Organization Size , 2018 to 2033

Table 35: Oceania Market Value (US$ Million) Forecast by Industry Type, 2018 to 2033

Table 36: MEA Market Value (US$ Million) Forecast by Country, 2018 to 2033

Table 37: MEA Market Value (US$ Million) Forecast by Component, 2018 to 2033

Table 38: MEA Market Value (US$ Million) Forecast by Deployment Type, 2018 to 2033

Table 39: MEA Market Value (US$ Million) Forecast by Organization Size , 2018 to 2033

Table 40: MEA Market Value (US$ Million) Forecast by Industry Type, 2018 to 2033

List of Charts

Figure 1: Global Market Value (US$ Million) by Component, 2023 to 2033

Figure 2: Global Market Value (US$ Million) by Deployment Type, 2023 to 2033

Figure 3: Global Market Value (US$ Million) by Organization Size , 2023 to 2033

Figure 4: Global Market Value (US$ Million) by Industry Type, 2023 to 2033

Figure 5: Global Market Value (US$ Million) by Region, 2023 to 2033

Figure 6: Global Market Value (US$ Million) Analysis by Region, 2018 to 2033

Figure 7: Global Market Value Share (%) and BPS Analysis by Region, 2023 to 2033

Figure 8: Global Market Y-o-Y Growth (%) Projections by Region, 2023 to 2033

Figure 9: Global Market Value (US$ Million) Analysis by Component, 2018 to 2033

Figure 10: Global Market Value Share (%) and BPS Analysis by Component, 2023 to 2033

Figure 11: Global Market Y-o-Y Growth (%) Projections by Component, 2023 to 2033

Figure 12: Global Market Value (US$ Million) Analysis by Deployment Type, 2018 to 2033

Figure 13: Global Market Value Share (%) and BPS Analysis by Deployment Type, 2023 to 2033

Figure 14: Global Market Y-o-Y Growth (%) Projections by Deployment Type, 2023 to 2033

Figure 15: Global Market Value (US$ Million) Analysis by Organization Size , 2018 to 2033

Figure 16: Global Market Value Share (%) and BPS Analysis by Organization Size , 2023 to 2033

Figure 17: Global Market Y-o-Y Growth (%) Projections by Organization Size , 2023 to 2033

Figure 18: Global Market Value (US$ Million) Analysis by Industry Type, 2018 to 2033

Figure 19: Global Market Value Share (%) and BPS Analysis by Industry Type, 2023 to 2033

Figure 20: Global Market Y-o-Y Growth (%) Projections by Industry Type, 2023 to 2033

Figure 21: Global Market Attractiveness by Component, 2023 to 2033

Figure 22: Global Market Attractiveness by Deployment Type, 2023 to 2033

Figure 23: Global Market Attractiveness by Organization Size , 2023 to 2033

Figure 24: Global Market Attractiveness by Industry Type, 2023 to 2033

Figure 25: Global Market Attractiveness by Region, 2023 to 2033

Figure 26: North America Market Value (US$ Million) by Component, 2023 to 2033

Figure 27: North America Market Value (US$ Million) by Deployment Type, 2023 to 2033

Figure 28: North America Market Value (US$ Million) by Organization Size , 2023 to 2033

Figure 29: North America Market Value (US$ Million) by Industry Type, 2023 to 2033

Figure 30: North America Market Value (US$ Million) by Country, 2023 to 2033

Figure 31: North America Market Value (US$ Million) Analysis by Country, 2018 to 2033

Figure 32: North America Market Value Share (%) and BPS Analysis by Country, 2023 to 2033

Figure 33: North America Market Y-o-Y Growth (%) Projections by Country, 2023 to 2033

Figure 34: North America Market Value (US$ Million) Analysis by Component, 2018 to 2033

Figure 35: North America Market Value Share (%) and BPS Analysis by Component, 2023 to 2033

Figure 36: North America Market Y-o-Y Growth (%) Projections by Component, 2023 to 2033

Figure 37: North America Market Value (US$ Million) Analysis by Deployment Type, 2018 to 2033

Figure 38: North America Market Value Share (%) and BPS Analysis by Deployment Type, 2023 to 2033

Figure 39: North America Market Y-o-Y Growth (%) Projections by Deployment Type, 2023 to 2033

Figure 40: North America Market Value (US$ Million) Analysis by Organization Size , 2018 to 2033

Figure 41: North America Market Value Share (%) and BPS Analysis by Organization Size , 2023 to 2033

Figure 42: North America Market Y-o-Y Growth (%) Projections by Organization Size , 2023 to 2033

Figure 43: North America Market Value (US$ Million) Analysis by Industry Type, 2018 to 2033

Figure 44: North America Market Value Share (%) and BPS Analysis by Industry Type, 2023 to 2033

Figure 45: North America Market Y-o-Y Growth (%) Projections by Industry Type, 2023 to 2033

Figure 46: North America Market Attractiveness by Component, 2023 to 2033

Figure 47: North America Market Attractiveness by Deployment Type, 2023 to 2033

Figure 48: North America Market Attractiveness by Organization Size , 2023 to 2033

Figure 49: North America Market Attractiveness by Industry Type, 2023 to 2033

Figure 50: North America Market Attractiveness by Country, 2023 to 2033

Figure 51: Latin America Market Value (US$ Million) by Component, 2023 to 2033

Figure 52: Latin America Market Value (US$ Million) by Deployment Type, 2023 to 2033

Figure 53: Latin America Market Value (US$ Million) by Organization Size , 2023 to 2033

Figure 54: Latin America Market Value (US$ Million) by Industry Type, 2023 to 2033

Figure 55: Latin America Market Value (US$ Million) by Country, 2023 to 2033

Figure 56: Latin America Market Value (US$ Million) Analysis by Country, 2018 to 2033

Figure 57: Latin America Market Value Share (%) and BPS Analysis by Country, 2023 to 2033

Figure 58: Latin America Market Y-o-Y Growth (%) Projections by Country, 2023 to 2033

Figure 59: Latin America Market Value (US$ Million) Analysis by Component, 2018 to 2033

Figure 60: Latin America Market Value Share (%) and BPS Analysis by Component, 2023 to 2033

Figure 61: Latin America Market Y-o-Y Growth (%) Projections by Component, 2023 to 2033

Figure 62: Latin America Market Value (US$ Million) Analysis by Deployment Type, 2018 to 2033

Figure 63: Latin America Market Value Share (%) and BPS Analysis by Deployment Type, 2023 to 2033

Figure 64: Latin America Market Y-o-Y Growth (%) Projections by Deployment Type, 2023 to 2033

Figure 65: Latin America Market Value (US$ Million) Analysis by Organization Size , 2018 to 2033

Figure 66: Latin America Market Value Share (%) and BPS Analysis by Organization Size , 2023 to 2033

Figure 67: Latin America Market Y-o-Y Growth (%) Projections by Organization Size , 2023 to 2033

Figure 68: Latin America Market Value (US$ Million) Analysis by Industry Type, 2018 to 2033

Figure 69: Latin America Market Value Share (%) and BPS Analysis by Industry Type, 2023 to 2033

Figure 70: Latin America Market Y-o-Y Growth (%) Projections by Industry Type, 2023 to 2033

Figure 71: Latin America Market Attractiveness by Component, 2023 to 2033

Figure 72: Latin America Market Attractiveness by Deployment Type, 2023 to 2033

Figure 73: Latin America Market Attractiveness by Organization Size , 2023 to 2033

Figure 74: Latin America Market Attractiveness by Industry Type, 2023 to 2033

Figure 75: Latin America Market Attractiveness by Country, 2023 to 2033

Figure 76: Europe Market Value (US$ Million) by Component, 2023 to 2033

Figure 77: Europe Market Value (US$ Million) by Deployment Type, 2023 to 2033

Figure 78: Europe Market Value (US$ Million) by Organization Size , 2023 to 2033

Figure 79: Europe Market Value (US$ Million) by Industry Type, 2023 to 2033

Figure 80: Europe Market Value (US$ Million) by Country, 2023 to 2033

Figure 81: Europe Market Value (US$ Million) Analysis by Country, 2018 to 2033

Figure 82: Europe Market Value Share (%) and BPS Analysis by Country, 2023 to 2033

Figure 83: Europe Market Y-o-Y Growth (%) Projections by Country, 2023 to 2033

Figure 84: Europe Market Value (US$ Million) Analysis by Component, 2018 to 2033

Figure 85: Europe Market Value Share (%) and BPS Analysis by Component, 2023 to 2033

Figure 86: Europe Market Y-o-Y Growth (%) Projections by Component, 2023 to 2033

Figure 87: Europe Market Value (US$ Million) Analysis by Deployment Type, 2018 to 2033

Figure 88: Europe Market Value Share (%) and BPS Analysis by Deployment Type, 2023 to 2033

Figure 89: Europe Market Y-o-Y Growth (%) Projections by Deployment Type, 2023 to 2033

Figure 90: Europe Market Value (US$ Million) Analysis by Organization Size , 2018 to 2033

Figure 91: Europe Market Value Share (%) and BPS Analysis by Organization Size , 2023 to 2033

Figure 92: Europe Market Y-o-Y Growth (%) Projections by Organization Size , 2023 to 2033

Figure 93: Europe Market Value (US$ Million) Analysis by Industry Type, 2018 to 2033

Figure 94: Europe Market Value Share (%) and BPS Analysis by Industry Type, 2023 to 2033

Figure 95: Europe Market Y-o-Y Growth (%) Projections by Industry Type, 2023 to 2033

Figure 96: Europe Market Attractiveness by Component, 2023 to 2033

Figure 97: Europe Market Attractiveness by Deployment Type, 2023 to 2033

Figure 98: Europe Market Attractiveness by Organization Size , 2023 to 2033

Figure 99: Europe Market Attractiveness by Industry Type, 2023 to 2033

Figure 100: Europe Market Attractiveness by Country, 2023 to 2033

Figure 101: South Asia Market Value (US$ Million) by Component, 2023 to 2033

Figure 102: South Asia Market Value (US$ Million) by Deployment Type, 2023 to 2033

Figure 103: South Asia Market Value (US$ Million) by Organization Size , 2023 to 2033

Figure 104: South Asia Market Value (US$ Million) by Industry Type, 2023 to 2033

Figure 105: South Asia Market Value (US$ Million) by Country, 2023 to 2033

Figure 106: South Asia Market Value (US$ Million) Analysis by Country, 2018 to 2033

Figure 107: South Asia Market Value Share (%) and BPS Analysis by Country, 2023 to 2033

Figure 108: South Asia Market Y-o-Y Growth (%) Projections by Country, 2023 to 2033

Figure 109: South Asia Market Value (US$ Million) Analysis by Component, 2018 to 2033

Figure 110: South Asia Market Value Share (%) and BPS Analysis by Component, 2023 to 2033

Figure 111: South Asia Market Y-o-Y Growth (%) Projections by Component, 2023 to 2033

Figure 112: South Asia Market Value (US$ Million) Analysis by Deployment Type, 2018 to 2033

Figure 113: South Asia Market Value Share (%) and BPS Analysis by Deployment Type, 2023 to 2033

Figure 114: South Asia Market Y-o-Y Growth (%) Projections by Deployment Type, 2023 to 2033

Figure 115: South Asia Market Value (US$ Million) Analysis by Organization Size , 2018 to 2033

Figure 116: South Asia Market Value Share (%) and BPS Analysis by Organization Size , 2023 to 2033

Figure 117: South Asia Market Y-o-Y Growth (%) Projections by Organization Size , 2023 to 2033

Figure 118: South Asia Market Value (US$ Million) Analysis by Industry Type, 2018 to 2033

Figure 119: South Asia Market Value Share (%) and BPS Analysis by Industry Type, 2023 to 2033

Figure 120: South Asia Market Y-o-Y Growth (%) Projections by Industry Type, 2023 to 2033

Figure 121: South Asia Market Attractiveness by Component, 2023 to 2033

Figure 122: South Asia Market Attractiveness by Deployment Type, 2023 to 2033

Figure 123: South Asia Market Attractiveness by Organization Size , 2023 to 2033

Figure 124: South Asia Market Attractiveness by Industry Type, 2023 to 2033

Figure 125: South Asia Market Attractiveness by Country, 2023 to 2033

Figure 126: East Asia Market Value (US$ Million) by Component, 2023 to 2033

Figure 127: East Asia Market Value (US$ Million) by Deployment Type, 2023 to 2033

Figure 128: East Asia Market Value (US$ Million) by Organization Size , 2023 to 2033

Figure 129: East Asia Market Value (US$ Million) by Industry Type, 2023 to 2033

Figure 130: East Asia Market Value (US$ Million) by Country, 2023 to 2033

Figure 131: East Asia Market Value (US$ Million) Analysis by Country, 2018 to 2033

Figure 132: East Asia Market Value Share (%) and BPS Analysis by Country, 2023 to 2033

Figure 133: East Asia Market Y-o-Y Growth (%) Projections by Country, 2023 to 2033

Figure 134: East Asia Market Value (US$ Million) Analysis by Component, 2018 to 2033

Figure 135: East Asia Market Value Share (%) and BPS Analysis by Component, 2023 to 2033

Figure 136: East Asia Market Y-o-Y Growth (%) Projections by Component, 2023 to 2033

Figure 137: East Asia Market Value (US$ Million) Analysis by Deployment Type, 2018 to 2033

Figure 138: East Asia Market Value Share (%) and BPS Analysis by Deployment Type, 2023 to 2033

Figure 139: East Asia Market Y-o-Y Growth (%) Projections by Deployment Type, 2023 to 2033

Figure 140: East Asia Market Value (US$ Million) Analysis by Organization Size , 2018 to 2033

Figure 141: East Asia Market Value Share (%) and BPS Analysis by Organization Size , 2023 to 2033

Figure 142: East Asia Market Y-o-Y Growth (%) Projections by Organization Size , 2023 to 2033

Figure 143: East Asia Market Value (US$ Million) Analysis by Industry Type, 2018 to 2033

Figure 144: East Asia Market Value Share (%) and BPS Analysis by Industry Type, 2023 to 2033

Figure 145: East Asia Market Y-o-Y Growth (%) Projections by Industry Type, 2023 to 2033

Figure 146: East Asia Market Attractiveness by Component, 2023 to 2033

Figure 147: East Asia Market Attractiveness by Deployment Type, 2023 to 2033

Figure 148: East Asia Market Attractiveness by Organization Size , 2023 to 2033

Figure 149: East Asia Market Attractiveness by Industry Type, 2023 to 2033

Figure 150: East Asia Market Attractiveness by Country, 2023 to 2033

Figure 151: Oceania Market Value (US$ Million) by Component, 2023 to 2033

Figure 152: Oceania Market Value (US$ Million) by Deployment Type, 2023 to 2033

Figure 153: Oceania Market Value (US$ Million) by Organization Size , 2023 to 2033

Figure 154: Oceania Market Value (US$ Million) by Industry Type, 2023 to 2033

Figure 155: Oceania Market Value (US$ Million) by Country, 2023 to 2033

Figure 156: Oceania Market Value (US$ Million) Analysis by Country, 2018 to 2033

Figure 157: Oceania Market Value Share (%) and BPS Analysis by Country, 2023 to 2033

Figure 158: Oceania Market Y-o-Y Growth (%) Projections by Country, 2023 to 2033

Figure 159: Oceania Market Value (US$ Million) Analysis by Component, 2018 to 2033

Figure 160: Oceania Market Value Share (%) and BPS Analysis by Component, 2023 to 2033

Figure 161: Oceania Market Y-o-Y Growth (%) Projections by Component, 2023 to 2033

Figure 162: Oceania Market Value (US$ Million) Analysis by Deployment Type, 2018 to 2033

Figure 163: Oceania Market Value Share (%) and BPS Analysis by Deployment Type, 2023 to 2033

Figure 164: Oceania Market Y-o-Y Growth (%) Projections by Deployment Type, 2023 to 2033

Figure 165: Oceania Market Value (US$ Million) Analysis by Organization Size , 2018 to 2033

Figure 166: Oceania Market Value Share (%) and BPS Analysis by Organization Size , 2023 to 2033

Figure 167: Oceania Market Y-o-Y Growth (%) Projections by Organization Size , 2023 to 2033

Figure 168: Oceania Market Value (US$ Million) Analysis by Industry Type, 2018 to 2033

Figure 169: Oceania Market Value Share (%) and BPS Analysis by Industry Type, 2023 to 2033

Figure 170: Oceania Market Y-o-Y Growth (%) Projections by Industry Type, 2023 to 2033

Figure 171: Oceania Market Attractiveness by Component, 2023 to 2033

Figure 172: Oceania Market Attractiveness by Deployment Type, 2023 to 2033

Figure 173: Oceania Market Attractiveness by Organization Size , 2023 to 2033

Figure 174: Oceania Market Attractiveness by Industry Type, 2023 to 2033

Figure 175: Oceania Market Attractiveness by Country, 2023 to 2033

Figure 176: MEA Market Value (US$ Million) by Component, 2023 to 2033

Figure 177: MEA Market Value (US$ Million) by Deployment Type, 2023 to 2033

Figure 178: MEA Market Value (US$ Million) by Organization Size , 2023 to 2033

Figure 179: MEA Market Value (US$ Million) by Industry Type, 2023 to 2033

Figure 180: MEA Market Value (US$ Million) by Country, 2023 to 2033

Figure 181: MEA Market Value (US$ Million) Analysis by Country, 2018 to 2033

Figure 182: MEA Market Value Share (%) and BPS Analysis by Country, 2023 to 2033

Figure 183: MEA Market Y-o-Y Growth (%) Projections by Country, 2023 to 2033

Figure 184: MEA Market Value (US$ Million) Analysis by Component, 2018 to 2033

Figure 185: MEA Market Value Share (%) and BPS Analysis by Component, 2023 to 2033

Figure 186: MEA Market Y-o-Y Growth (%) Projections by Component, 2023 to 2033

Figure 187: MEA Market Value (US$ Million) Analysis by Deployment Type, 2018 to 2033

Figure 188: MEA Market Value Share (%) and BPS Analysis by Deployment Type, 2023 to 2033

Figure 189: MEA Market Y-o-Y Growth (%) Projections by Deployment Type, 2023 to 2033

Figure 190: MEA Market Value (US$ Million) Analysis by Organization Size , 2018 to 2033

Figure 191: MEA Market Value Share (%) and BPS Analysis by Organization Size , 2023 to 2033

Figure 192: MEA Market Y-o-Y Growth (%) Projections by Organization Size , 2023 to 2033

Figure 193: MEA Market Value (US$ Million) Analysis by Industry Type, 2018 to 2033

Figure 194: MEA Market Value Share (%) and BPS Analysis by Industry Type, 2023 to 2033

Figure 195: MEA Market Y-o-Y Growth (%) Projections by Industry Type, 2023 to 2033

Figure 196: MEA Market Attractiveness by Component, 2023 to 2033

Figure 197: MEA Market Attractiveness by Deployment Type, 2023 to 2033

Figure 198: MEA Market Attractiveness by Organization Size , 2023 to 2033

Figure 199: MEA Market Attractiveness by Industry Type, 2023 to 2033

Figure 200: MEA Market Attractiveness by Country, 2023 to 2033

Recommendations

Technology

MEA Enterprise Software Market

Published : September 2022

Explore Technology Insights

View Reports

Change Management Software Market