Transformer Tap Changers and Voltage Control Relay Market Size and Share Forecast Outlook (2025 to 2035)

The transformer tap changers and voltage control relay market is expected to reach USD 1,611.2 Million by 2025, and then USD 2,502.1 Million by 2035. This happens due to a growth rate of 4.5% each year on average. More need for power, new energy sources, money put into the grid, and smart grid tech boost this rise.
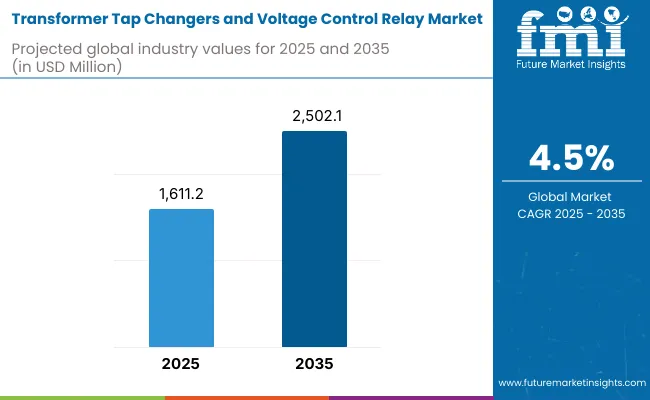
Transformer Tap Changers And Voltage Control Relay Market Projected Global Industry Values For 2025 2035

From 2025 to 2035, the transformer tap changers and voltage control relay market is expected to experience significant growth. This stems from the need for improved power grids, more efficient energy management, and innovative electrical tools. Tap changers and relays in transformers maintain the steady power supply for homes, workplaces, and factories. They help the power flow right in grids, which is key for most uses.

Regional Market Trends in Transformer Tap Changers and Voltage Control Relays

North America

North America should have a big part of the market for transformer tap changers and voltage control relays. This is due to upgrades to power grids and the need for good power distribution. The USA and Canada lead in putting money into smart grids, green-powered energy, and changing old setups.

The use of better voltage control relays and tap changers is growing. This is because of the need for reliable grids and good energy management. Adding more resources like wind and sunlight to power grids needs better equipment for voltage control. This boosts demand for these tools even more.

Europe

Europe is big for the growth of tap changers and voltage control relay market. Countries like Germany, France, UK, and Italy are leading. The area is spending a lot on green energy, saving energy, and making smart grids, which need good voltage control.

The EU's big goals for cleaner energy and cutting gas emissions help the need for smart voltage tech. Europe’s aim on digital and smart grids also boosts tap changers and voltage relays.

Asia-Pacific

The Asia-pacific region will see fast growth in the transformer tap changers and voltage control relay market. This is due to high rates of industry, city growth, and more needs for electricity. Countries like China, India, Japan, and South Korea are working hard to grow and update their power systems to meet the rising energy needs of their people.

In particular, the use of green energy in places like China and India, which have big plans for renewable energy, is pushing the need for better voltage control tools. Also, large amounts of money spent on power systems and grid updates in APAC countries will keep driving the demand for tap changers and voltage control relays.

Challenges and Opportunities

Challenges

High Initial Costs and System Complexity

The high cost of advanced equipment devices such as smart grids and smart systems is one of the main restraints for the transformer tap changers and voltage control relay market. Furthermore, the difficulty of deployment and integration into existing power grids can also present challenges, particularly in developing markets with less established infrastructure.

The lengthy payback period of large-scale grid modernization is one of the obstacles to the acceptance of advanced tap changers and even voltage control relays to operate and maintain these systems, which requires increasingly specialized professionals with advanced skills.

Opportunities

Smart Grid Integration and Renewable Energy Integration

While there are challenges, the market presents immense growth potential. An important opportunity for the transformer tap changers and voltage control relay market is the global transition toward smart grids and renewable energy sources. Smart grids that require dynamic regulation and control are expected to be widely adopted, particularly in developed economies.

In addition to this, there is a push to increase the use of renewable energy sources, such as solar and wind. As we transition towards renewable energy, the variability of these power sources creates a demand for more flexible voltage control devices. The demand for advanced tap changers and voltage control relays will persist as nations focus on improving energy efficiency, enhancing grid resiliency, and promoting sustainability.

Shifts in the Transformer Tap Changers and Voltage Control Relay Market from 2020 to 2024 and Future Trends 2025 to 2035

From 2020 to 2024, the growth of the transformer tap changers and voltage control relay market is driven by the rising need to stabilize power and ensure efficient electricity transmission, as well as the increase in population, urbanization, industrialization, and the global initiative for the use of renewable energy sources.

These transformer tap changers enabled voltage level adjustments to help ensure the reliability and efficiency of the power distribution systems utilized by the fully integrated system. Voltage regulation is a concern for many types of industrial processes and for the operation of the electrical grid, and so the number of voltage control relays is increasing in electrical networks.

From 2025 to 2035, the market for transformer tap changers and voltage control relays is expected to continue growing, driven by advancements in smart grid technologies and automation. Utilities and industries are trying to focus on the improvement of the reliability of the grid and the efficiency of operations, which will lead to the increasing application of digital and automated voltage control solutions.

The smart transformers, with advanced tap changer mechanisms and voltage control relays, will be increasingly deployed, empowering real-time voltage regulation and monitoring, optimizing energy distribution, and minimizing energy losses. Furthermore, the increasing installation of renewable energy technologies, along with the trend towards decentralized power generation, will create a higher demand for innovative transformer tap changers and voltage control relays that can efficiently handle variable power outputs.

Market Shifts: A Comparative Analysis 2020 to 2024 vs. 2025 to 2035

Market Shift 2020 to 2024
Regulatory Landscape Increased focus on compliance with environmental and safety standards for power distribution systems.
Technological Advancements Improved designs for tap changers and relays to increase durability, reduce maintenance, and improve voltage regulation.
Industry Applications Primarily used in power distribution networks, transformers, and electrical grids.
Adoption of Smart Equipment Limited integration of smart features such as remote control and monitoring in voltage control devices.
Sustainability & Cost Efficiency Growing focus on reducing energy losses and improving the efficiency of electrical grids.
Data Analytics & Predictive Modeling Basic monitoring of voltage levels and tap changer performance.
Production & Supply Chain Dynamics Standardized manufacturing processes for tap changers and relays, with some flexibility for custom solutions.
Market Growth Drivers Demand for improved power transmission, efficient energy distribution, and integration of renewable energy sources.
Market Shift 2025 to 2035
Regulatory Landscape Implementation of stricter regulations governing grid efficiency, renewable energy integration, and smart grid technologies.
Technological Advancements Development of smart transformers with integrated digital tap changers and voltage control relays that enable real-time monitoring and predictive control.
Industry Applications Expansion into renewable energy sectors, especially in solar and wind farms, to regulate variable energy outputs and integrate decentralized power sources.
Adoption of Smart Equipment Widespread adoption of smart tap changers and voltage control relays with IoT integration, enabling real-time data collection, performance analytics, and remote control.
Sustainability & Cost Efficiency Stronger emphasis on sustainable energy distribution, grid optimization, and reduction of operational costs through advanced voltage control technologies.
Data Analytics & Predictive Modeling Advanced predictive analytics and AI-driven models for optimizing voltage control, forecasting maintenance needs, and minimizing downtime.
Production & Supply Chain Dynamics Shift towards more flexible, modular production methods to accommodate the increasing demand for customized, smart voltage control solutions.
Market Growth Drivers Growth driven by the need for grid modernization, the integration of smart grid technologies, and the transition towards decentralized, renewable-based power systems.

Country-wise Insights

United States

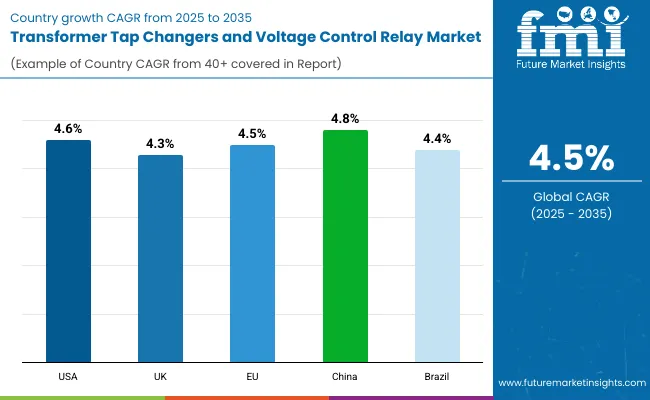
In the United States, the transformer tap changers and voltage control relays market is experiencing extensive growth. This is a result of growing demand for improved power networks, increased investment in green power, and much greater interest in smart grid technology. Agencies like the Federal Energy Regulatory Commission (FERC) and the U.S. Department of Energy (DOE) make rules about the safe and efficient electrical grid.

Among the major trends are increasing deployment of on-load tap changers (OLTCs) in substations, growing demand for voltage control relays capable of catering to stable grids, and spending on predictive technologies for smarter performance. The transition to electric vehicles and renewable power is also driving demand for more sophisticated voltage solutions.

Country CAGR (2025 to 2035)
USA 4.6%

United Kingdom

The UK transformer tap changers and voltage control relay market is expected to grow in the coming years. This increase is attributed to increased investment in renewable energy sources, such as offshore wind and solar power. There is a greater need to modernize the power grid and find better methods to store energy. The Office of Gas and Electricity Markets (Ofgem) makes sure that power networks and safety rules are followed.

Some trends in the market are the increase in tap changers in transformers for a stable grid, more voltage control systems in energy storage, and better digital relays for a smarter grid. The government’s goal of less carbon and a cleaner energy grid will likely boost the need for advanced voltage solutions.

Country CAGR (2025 to 2035)
UK 4.3%

European Union

The EU transformer tap changers and voltage control relay market is seeing growth. Renewable energy, modern grids, and smart grid technologies boost this market. ENTSO-E and ACER govern the grid and power systems. Main trends show a push for energy efficiency. On-load tap changers (OLTCs) help control voltage in green energy setups.

This leads to a greater need for voltage control relays in smart grids. Digital and automated tap changers are now common. They improve energy distribution and make grids more resilient.

Country CAGR (2025 to 2035)
European Union (EU) 4.5%

China

The market for transformer tap changers and voltage control relay in China is growing fast. This is due to increased industrial demands, the development of newer power grids, and a greater investment in green energy. Groups such as the State Grid Corporation of China (SGCC) and the National Energy Administration (NEA) guide the development and utilization of energy systems.

Trends to watch include the increased use of on-load tap changers (OLTCs) in substation systems, the higher need for voltage control relays in small energy setups (DERs), and a push for smart grid technology. Additionally, China's "Made in China 2025" plan is promoting advancements in power technology and upgrading the country's power grids.

Country CAGR (2025 to 2035)
China 4.8%

Brazil

The market for transformer tap changers and voltage control relays in Brazil is growing. This is due to the larger electric grid, increased use of renewable energy, and steps to make the energy system more stable and efficient. Bodies like the National Electric Energy Agency (ANEEL) make sure power is safe and up to standard.

The market is seeing more need for tap changers in renewable energy. Voltage control relays are also needed to manage grid changes. There is a move towards using smart tech and automation in energy. Additionally, the Brazilian government's energy reforms are driving the adoption of smart grid technology.

Country CAGR (2025 to 2035)
Brazil 4.4%

Transformer Tap Changers and Voltage Control Relay Market - Segmentation Outlook

Three-Phase Transformers and Industrial Applications Lead Market Growth with Advancements in Power Distribution and Grid Management

The transformer tap changer and voltage control relay market is growing well because more people require a reliable power supply and steady voltage in factories and power plants. Three-Phase Transformers lead the pack, with the Industrial sector taking center stage due to its big need for strong power tools.

Market Share by Phase (2025)
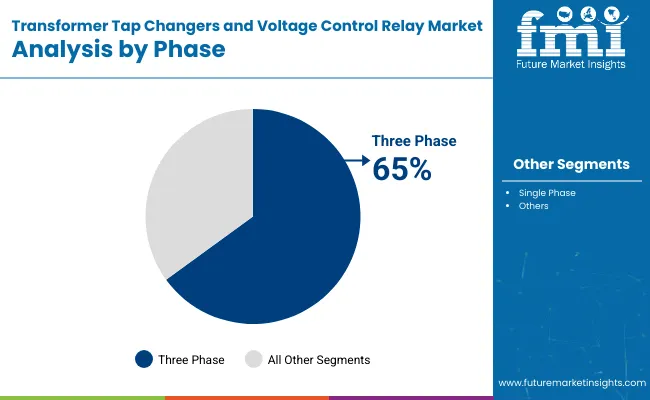
Phase Market Share (2025)
Three Phase 65.0%

Three-Phase Transformers Lead Market Demand with High Efficiency and Power Handling Capacity

The three-phase transformer is the most popular product type in the transformer market since it is suited for in-depth essential loads and delivers a greater amount of efficiency when compared to its single-phase counter-part and is at last used at industrial and various burglar levels. They are crucial in the transmission and distribution of electrical power in grids and large-scale places.

Three-phase transformers are generally more reliable and efficient, which leads to their demand by industrial manufacturing and utility grids for better power supply systems. With global industries and power grids increasing across different regions, the need for three-phase transformers with tap changers and voltage control relays would be ever-increasing to achieve the required control over voltage levels.

Market Share by Application (2025)
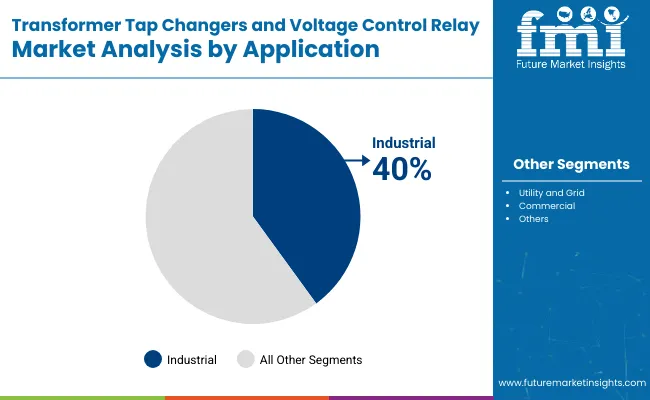
Application Market Share (2025)
Industrial 40.0%

Industrial Applications Lead with Growing Demand for Voltage Control and Power Regulation

Three-phase transformers are top sellers in the market. They work with bigger power and are more efficient, perfect for factories and utilities. They are key for moving and spreading power in grids and big places. People want three-phase transformers for better and steady power systems in factories and utility grids. As factories and grids grow worldwide, the need for transformers with tap changers and voltage control relays will rise. This is to manage and keep voltage stable.

Competitive Outlook

The growth of transformer tap changers and the voltage control relay market can be attributed to the increasing demand for efficient power management systems, especially in the power generation and distribution industries. Some of the major factors driving market growth include the exponential demand for continuous power supply, grid modernization, and increased energy efficiency.

The tap taps of the transformer can also be used with the help of relays during voltage control to regulate the voltage and protect the system from these fluctuations. Market players are adopting innovations such as load tap changers, on-load and off-load tap changers, and digital voltage control relays in this market to enhance system performance and reliability.

Market Share Analysis by Company
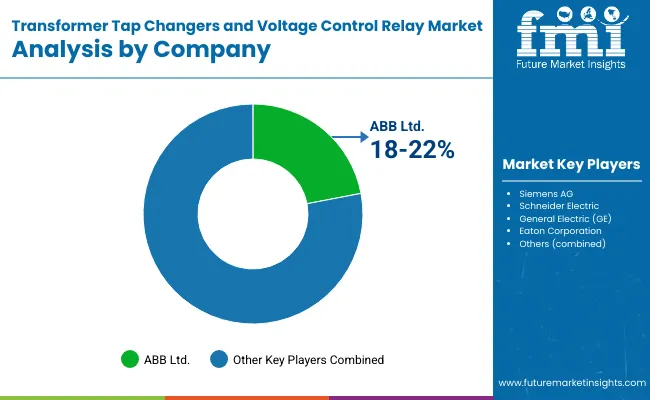
Company Name Estimated Market Share (%)
ABB Ltd. 18-22%
Siemens AG 14-18%
Schneider Electric 12-16%
General Electric (GE) 10-14%
Eaton Corporation 6-10%
Other Companies (combined) 30-40%

Key Company Offerings and Activities 2024 to 2025

Company Name Key Offerings/Activities
ABB Ltd. In 2024, new tap changers made for good grid use came out.
Siemens AG In 2025, new digital relays to fix voltage in modern grids were launched.
Schneider Electric In 2024, they made more tap changers to work with smart grids to save energy.
General Electric (GE) In 2025, new tap changers with better insulation and safety from high-voltage hits were shown.
Eaton Corporation In 2024, new relays with smart upkeep options for a more reliable grid were launched.

Key Company Insights

ABB Ltd. (18-22%)

ABB leads in the development of devices for changing transformer taps and voltage control. They offer a wide range of products for these purposes that are used worldwide.

Siemens AG (14-18%)

Siemens is known for digital voltage control tools. They use smart grid tech to make power networks better and more reliable.

Schneider Electric (12-16%)

Schneider Electric makes eco-friendly and energy-saving devices. They provide smart tap changers and voltage control systems that monitor power grids in real-time.

General Electric (GE) (10-14%)

GE's products include both manual and digital tap changers. These enhancements improve the safety of transformers and strengthen the power grid.

Eaton Corporation (6-10%)

Eaton focuses on high-performance voltage control tools and tap changers. They offer solutions for both industrial use and power grids, with a goal of making systems more reliable through advanced analytics.

Other Key Players (30-40% Combined)

Several manufacturers and suppliers of power control and protection systems also play a significant role in the transformer tap changers and voltage control relay market. These include:

  • LARSEN & TOUBRO LIMITED-Known for its high-quality tap changers and voltage regulation solutions for utility providers.
  • RHEA SYSTEMS- Makes special voltage control relays and transformers for certain industrial needs.
  • Alstom offers a range of transformer tap changers and voltage regulators to meet various energy needs.
  • Mitsubishi Electric Corporation- Provides reliable tap changers and voltage controllers for big power systems.
  • Howard Industries is famous for top-notch relay systems and transformer voltage tech.

Key Segmentation of the Transformer Tap Changers and Voltage Control Relay Market

By Phase:

  • Single Phase
  • Three Phase

By Application:

  • Industrial
  • Utility and Grid
  • Commercial
  • Others

By Product Type:

  • Transformer Tap Changers
    • Off-circuit Tap Changer
    • On-circuit Tap Changer
  • Voltage Control Relays
    • DIN Rail
    • Panel Mounted

By Region:

  • North America
  • Latin America
  • Western Europe
  • Eastern Europe
  • East Asia
  • South Asia Pacific
  • Middle East and Africa

Table of Content

  1. Executive Summary
  2. Industry Introduction, including Taxonomy and Market Definition
  3. Market Trends and Success Factors, including Macro-economic Factors, Market Dynamics, and Recent Industry Developments
  4. Global Market Demand Analysis 2020 to 2024 and Forecast 2025 to 2035, including Historical Analysis and Future Projections
  5. Pricing Analysis
  6. Global Market Analysis 2020 to 2024 and Forecast 2025 to 2035
    • Phase
    • Application
    • Product Type
  7. Global Market Analysis 2020 to 2024 and Forecast 2025 to 2035, By Phase
    • Single Phase
    • Three Phase
  8. Global Market Analysis 2020 to 2024 and Forecast 2025 to 2035, By Application
    • Industrial
    • Utility and Grid
    • Commercial
    • Others
  9. Global Market Analysis 2020 to 2024 and Forecast 2025 to 2035, By Product Type
    • Transformer Tap Changers
    • Voltage Control Relays
  10. Global Market Analysis 2020 to 2024 and Forecast 2025 to 2035, By Region
    • North America
    • Latin America
    • Western Europe
    • Eastern Europe
    • East Asia
    • South Asia Pacific
    • Middle East and Africa
  11. North America Sales Analysis 2020 to 2024 and Forecast 2025 to 2035, by Key Segments and Countries
  12. Latin America Sales Analysis 2020 to 2024 and Forecast 2025 to 2035, by Key Segments and Countries
  13. Western Europe Sales Analysis 2020 to 2024 and Forecast 2025 to 2035, by Key Segments and Countries
  14. Eastern Europe Sales Analysis 2020 to 2024 and Forecast 2025 to 2035, by Key Segments and Countries
  15. East Asia Sales Analysis 2020 to 2024 and Forecast 2025 to 2035, by Key Segments and Countries
  16. South Asia Pacific Sales Analysis 2020 to 2024 and Forecast 2025 to 2035, by Key Segments and Countries
  17. Middle East and Africa Sales Analysis 2020 to 2024 and Forecast 2025 to 2035, by Key Segments and Countries
  18. Sales Forecast 2025 to 2035 by Phase, Application, and Product Type for 30 Countries
  19. Competition Outlook, including Market Structure Analysis, Company Share Analysis by Key Players, and Competition Dashboard
  20. Company Profile
    • Siemens AG
    • Schneider Electric
    • ABB
    • Maschinenfabrik Reinhausen GmbH
    • Hitachi Energy Ltd
    • Toshiba Energy Systems & Solutions Corporation
    • Prolec-GE Waukesha, Inc.
    • Eaton
    • OMRON Corporation
    • Mitsubishi Electric Corporation

List of Tables

Table 01: Global Market Size Volume (Units) and Value (US$ million) Forecast By Product Type, 2018 to 2033

Table 02: Global Market Size Volume (Units) and Value (US$ million) Forecast By Phase, 2018 to 2033

Table 03: Global Market Size Volume (Units) and Value (US$ million) Forecast By Application, 2018 to 2033

Table 04: Global Market Volume (Units) Historical Data 2018 to 2022 and Forecast 2023 to 2033 by Region

Table 05: Global Market Value (US$ million) Historical Data 2018 to 2022 and Forecast 2023 to 2033 by Region

Table 06: North America Agricultural Sprayers Market Size (US$ million) and Volume (Units) Analysis and Forecast By Country, 2018 to 2033

Table 07: North America Market Size Volume (Units) and Value (US$ million) Forecast By Product Type, 2018 to 2033

Table 08: North America Market Size Volume (Units) and Value (US$ million) Forecast By Phase, 2018 to 2033

Table 09: North America Market Size Volume (Units) and Value (US$ million) Forecast By Application, 2018 to 2033

Table 10: Latin America Size (US$ million) and Volume (Units) Analysis and Forecast By Country, 2018 to 2033

Table 11: Latin America Market Size Volume (Units) and Value (US$ million) Forecast By Product Type, 2018 to 2033

Table 12: Latin America Market Size Volume (Units) and Value (US$ million) Forecast By Phase, 2018 to 2033

Table 13: Latin America Market Size Volume (Units) and Value (US$ million) Forecast By Application, 2018 to 2033

Table 14: Western Europe Continuous Emission Monitoring Market Size (US$ million) and Volume (Units) Analysis and Forecast By Country, 2018 to 2033

Table 15: Western Europe Market Size Volume (Units) and Value (US$ million) Forecast By Product Type, 2018 to 2033

Table 16: Western Europe Market Size Volume (Units) and Value (US$ million) Forecast By Phase, 2018 to 2033

Table 17: Western Europe Market Size Volume (Units) and Value (US$ million) Forecast By Application, 2018 to 2033

Table 18: Eastern Europe Size (US$ million) and Volume (Units) Analysis and Forecast By Country, 2018 to 2033

Table 19: Eastern Europe Market Size Volume (Units) and Value (US$ million) Forecast By Product Type, 2018 to 2033

Table 20: Eastern Europe Market Size Volume (Units) and Value (US$ million) Forecast By Phase, 2018 to 2033

Table 21: Eastern Europe Market Size Volume (Units) and Value (US$ million) Forecast By Application, 2018 to 2033

Table 22: Central Asia Market Size Volume (Units) and Value (US$ million) Forecast By Product Type, 2018 to 2033

Table 23: Central Asia Market Size Volume (Units) and Value (US$ million) Forecast By Phase, 2018 to 2033

Table 24: Central Asia Market Size Volume (Units) and Value (US$ million) Forecast By Application, 2018 to 2033

Table 25: Russia and Belarus Market Size Volume (Units) and Value (US$ million) Forecast By Product Type, 2018 to 2033

Table 26: Russia and Belarus Market Size Volume (Units) and Value (US$ million) Forecast By Phase, 2018 to 2033

Table 27: Russia and Belarus Market Size Volume (Units) and Value (US$ million) Forecast By Application, 2018 to 2033

Table 28: Balkan and Baltic Countries Market Size Volume (Units) and Value (US$ million) Forecast By Product Type, 2018 to 2033

Table 29: Balkan and Baltic Countries Market Size Volume (Units) and Value (US$ million) Forecast By Phase, 2018 to 2033

Table 30: Balkan and Baltic Countries Market Size Volume (Units) and Value (US$ million) Forecast By Application, 2018 to 2033

Table 31: East Asia Size (US$ million) and Volume (Units) Analysis and Forecast By Country, 2018 to 2033

Table 32: East Asia Market Size Volume (Units) and Value (US$ million) Forecast By Product Type, 2018 to 2033

Table 33: East Asia Market Size Volume (Units) and Value (US$ million) Forecast By Phase, 2018 to 2033

Table 34: East Asia Market Size Volume (Units) and Value (US$ million) Forecast By Application, 2018 to 2033

Table 35: South Asia Pacific Size (US$ million) and Volume (Units) Analysis and Forecast By Country, 2018 to 2033

Table 36: South Asia and Pacific Market Size Volume (Units) and Value (US$ million) Forecast By Product Type, 2018 to 2033

Table 37: South Asia and Pacific Market Size Volume (Units) and Value (US$ million) Forecast By Phase, 2018 to 2033

Table 38: South Asia and Pacific Market Size Volume (Units) and Value (US$ million) Forecast By Application, 2018 to 2033

Table 39: Middle East and Africa Size (US$ million) and Volume (Units) Analysis and Forecast By Country, 2018 to 2033

Table 40: Middle East and Africa Market Size Volume (Units) and Value (US$ million) Forecast By Product Type, 2018 to 2033

Table 41: Middle East and Africa Market Size Volume (Units) and Value (US$ million) Forecast By Phase, 2018 to 2033

Table 42: Middle East and Africa Market Size Volume (Units) and Value (US$ million) Forecast By Application, 2018 to 2033

List of Figures

Figure 01: Global Market Historical Volume (million Units), 2018 to 2022

Figure 02: Global Market Volume (million Units) Forecast, 2023 to 2033

Figure 03: Global Market Historical Value (US$ million), 2018 to 2022

Figure 04: Global Market Absolute $ Opportunity, 2022 to 2033

Figure 05: Global Market Absolute $ Opportunity, 2022 to 2033

Figure 06: Global Market Share and BPS Analysis By Product Type– 2023 & 2033

Figure 07: Global Market Y-o-Y Growth Projections By Product Type, 2023 to 2033

Figure 08: Global Market Attractiveness Analysis By Product Type, 2023 to 2033

Figure 09: Global Market Absolute $ opportunity by Product Type, 2023 to 2033

Figure 10: Global Market Share and BPS Analysis By Phase– 2023 & 2033

Figure 11: Global Market Y-o-Y Growth Projections By Phase, 2023 to 2033

Figure 12: Global Market Attractiveness Analysis By Phase, 2023 to 2033

Figure 13: Global Market Absolute $ opportunity by Phase, 2023 to 2033

Figure 14: Global Market Share and BPS Analysis By Application– 2023 & 2033

Figure 15: Global Market Y-o-Y Growth Projections By Application, 2023 to 2033

Figure 16: Global Market Attractiveness Analysis By Application, 2023 to 2033

Figure 17: Global Market Absolute $ opportunity by Application, 2023 to 2033

Figure 18: Global Market Share and BPS Analysis by Region, 2023 & 2033

Figure 19: Global Market Y-o-Y Growth Projection by Region, 2022 to 2033

Figure 20: Global Market Attractiveness Analysis by Region, 2023 to 2033

Figure 21: North America Share and BPS Analysis By Country, 2023 & 2033

Figure 22: North America Y-o-Y Growth Projections By Country, 2023 to 2033

Figure 23: North America Attractiveness Analysis By Country, 2023 to 2033

Figure 24: North America Market Share and BPS Analysis By Product Type– 2023 & 2033

Figure 25: North America Market Y-o-Y Growth Projections By Product Type, 2023 to 2033

Figure 26: North America Market Attractiveness Analysis By Product Type, 2023 to 2033

Figure 27: North America Market Share and BPS Analysis By Phase– 2023 & 2033

Figure 28: North America Market Y-o-Y Growth Projections By Phase, 2023 to 2033

Figure 29: North America Market Attractiveness Analysis By Phase, 2023 to 2033

Figure 30: North America Market Share and BPS Analysis By Application– 2023 & 2033

Figure 31: North America Market Y-o-Y Growth Projections By Application, 2023 to 2033

Figure 32: North America Market Attractiveness Analysis By Application, 2023 to 2033

Figure 33: Latin America Share and BPS Analysis By Country, 2023 & 2033

Figure 34: Latin America Y-o-Y Growth Projections By Country, 2023 to 2033

Figure 35: Latin America Attractiveness Analysis By Country, 2023 to 2033

Figure 36: Latin America Market Share and BPS Analysis By Product Type– 2023 & 2033

Figure 37: Latin America Market Y-o-Y Growth Projections By Product Type, 2023 to 2033

Figure 38: Latin America Market Attractiveness Analysis By Product Type, 2023 to 2033

Figure 39: Latin America Market Share and BPS Analysis By Phase– 2023 & 2033

Figure 40: Latin America Market Y-o-Y Growth Projections By Phase, 2023 to 2033

Figure 41: Latin America Market Attractiveness Analysis By Phase, 2023 to 2033

Figure 42: Latin America Market Share and BPS Analysis By Application– 2023 & 2033

Figure 43: Latin America Market Y-o-Y Growth Projections By Application, 2023 to 2033

Figure 44: Latin America Market Attractiveness Analysis By Application, 2023 to 2033

Figure 45: Western Europe Share and BPS Analysis By Country, 2023 & 2033

Figure 46: Western Europe Y-o-Y Growth Projections By Country, 2023 to 2033

Figure 47: Western Europe Attractiveness Analysis By Country, 2023 to 2033

Figure 48: Western Europe Market Share and BPS Analysis By Product Type– 2023 & 2033

Figure 49: Western Europe Market Y-o-Y Growth Projections By Product Type, 2023 to 2033

Figure 50: Western Europe Market Attractiveness Analysis By Product Type, 2023 to 2033

Figure 51: Western Europe Market Share and BPS Analysis By Phase– 2023 & 2033

Figure 52: Western Europe Market Y-o-Y Growth Projections By Phase, 2023 to 2033

Figure 53: Western Europe Market Attractiveness Analysis By Phase, 2023 to 2033

Figure 54: Western Europe Market Share and BPS Analysis By Application– 2023 & 2033

Figure 55: Western Europe Market Y-o-Y Growth Projections By Application, 2023 to 2033

Figure 56: Western Europe Market Attractiveness Analysis By Application, 2023 to 2033

Figure 57: Eastern Europe Share and BPS Analysis By Country, 2023 & 2033

Figure 58: Eastern Europe Y-o-Y Growth Projections By Country, 2023 to 2033

Figure 59: Eastern Europe Attractiveness Analysis By Country, 2023 to 2033

Figure 60: Eastern Europe Market Share and BPS Analysis By Product Type– 2023 & 2033

Figure 61: Eastern Europe Market Y-o-Y Growth Projections By Product Type, 2023 to 2033

Figure 62: Eastern Europe Market Attractiveness Analysis By Product Type, 2023 to 2033

Figure 63: Eastern Europe Market Share and BPS Analysis By Phase– 2023 & 2033

Figure 64: Eastern Europe Market Y-o-Y Growth Projections By Phase, 2023 to 2033

Figure 65: Eastern Europe Market Attractiveness Analysis By Phase, 2023 to 2033

Figure 66: Eastern Europe Market Share and BPS Analysis By Application– 2023 & 2033

Figure 67: Eastern Europe Market Y-o-Y Growth Projections By Application, 2023 to 2033

Figure 68: Eastern Europe Market Attractiveness Analysis By Application, 2023 to 2033

Figure 69: Central Asia Market Share and BPS Analysis By Product Type– 2023 & 2033

Figure 70: Central Asia Market Y-o-Y Growth Projections By Product Type, 2023 to 2033

Figure 71: Central Asia Market Attractiveness Analysis By Product Type, 2023 to 2033

Figure 72: Central Asia Market Share and BPS Analysis By Phase– 2023 & 2033

Figure 73: Central Asia Market Y-o-Y Growth Projections By Phase, 2023 to 2033

Figure 74: Central Asia Market Attractiveness Analysis By Phase, 2023 to 2033

Figure 75: Central Asia Market Share and BPS Analysis By Application– 2023 & 2033

Figure 76: Central Asia Market Y-o-Y Growth Projections By Application, 2023 to 2033

Figure 77: Central Asia Market Attractiveness Analysis By Application, 2023 to 2033

Figure 78: Russia and Belarus Market Y-o-Y Growth Projections By Product Type, 2023 to 2033

Figure 79: Russia and Belarus Market Share and BPS Analysis By Product Type– 2023 & 2033

Figure 80: Russia and Belarus Market Attractiveness Analysis By Product Type, 2023 to 2033

Figure 81: Russia and Belarus Market Share and BPS Analysis By Phase– 2023 & 2033

Figure 82: Russia and Belarus Market Y-o-Y Growth Projections By Phase, 2023 to 2033

Figure 83: Russia and Belarus Market Attractiveness Analysis By Phase, 2023 to 2033

Figure 84: Russia and Belarus Market Share and BPS Analysis By Application– 2023 & 2033

Figure 85: Russia and Belarus Market Y-o-Y Growth Projections By Application, 2023 to 2033

Figure 86: Russia and Belarus Market Attractiveness Analysis By Application, 2023 to 2033

Figure 87: Balkan and Baltic Countries Market Share and BPS Analysis By Product Type– 2023 & 2033

Figure 88: Balkan and Baltic Countries Market Y-o-Y Growth Projections By Product Type, 2023 to 2033

Figure 89: Balkan and Baltic Countries Market Attractiveness Analysis By Product Type, 2023 to 2033

Figure 90: Balkan and Baltic Countries Market Share and BPS Analysis By Phase– 2023 & 2033

Figure 91: Balkan and Baltic Countries Market Y-o-Y Growth Projections By Phase, 2023 to 2033

Figure 92: Balkan and Baltic Countries Market Attractiveness Analysis By Phase, 2023 to 2033

Figure 93: Balkan and Baltic Countries Market Share and BPS Analysis By Application– 2023 & 2033

Figure 94: Balkan and Baltic Countries Market Y-o-Y Growth Projections By Application, 2023 to 2033

Figure 95: Balkan and Baltic Countries Market Attractiveness Analysis By Application, 2023 to 2033

Figure 96: East Asia Share and BPS Analysis By Country, 2023 & 2033

Figure 97: East Asia Y-o-Y Growth Projections By Country, 2023 to 2033

Figure 98: East Asia Attractiveness Analysis By Country, 2023 to 2033

Figure 99: East Asia Market Share and BPS Analysis By Product Type– 2023 & 2033

Figure 100: East Asia Market Y-o-Y Growth Projections By Product Type, 2023 to 2033

Figure 101: East Asia Market Attractiveness Analysis By Product Type, 2023 to 2033

Figure 102: East Asia Market Share and BPS Analysis By Phase– 2023 & 2033

Figure 103: East Asia Market Y-o-Y Growth Projections By Phase, 2023 to 2033

Figure 104: East Asia Market Attractiveness Analysis By Phase, 2023 to 2033

Figure 105: East Asia Market Share and BPS Analysis By Application– 2023 & 2033

Figure 106: East Asia Market Y-o-Y Growth Projections By Application, 2023 to 2033

Figure 107: East Asia Market Attractiveness Analysis By Application, 2023 to 2033

Figure 108: South Asia and Pacific Share and BPS Analysis By Country, 2023 & 2033

Figure 109: South Asia and Pacific Y-o-Y Growth Projections By Country, 2023 to 2033

Figure 110: South Asia and Pacific Attractiveness Analysis By Country, 2023 to 2033

Figure 111: South Asia and Pacific Market Share and BPS Analysis By Product Type– 2023 & 2033

Figure 112: South Asia and Pacific Market Y-o-Y Growth Projections By Product Type, 2023 to 2033

Figure 113: South Asia and Pacific Market Attractiveness Analysis By Product Type, 2023 to 2033

Figure 114: South Asia and Pacific Market Share and BPS Analysis By Phase– 2023 & 2033

Figure 115: South Asia and Pacific Market Y-o-Y Growth Projections By Phase, 2023 to 2033

Figure 116: South Asia and Pacific Market Attractiveness Analysis By Phase, 2023 to 2033

Figure 117: South Asia and Pacific Market Share and BPS Analysis By Application– 2023 & 2033

Figure 118: South Asia and Pacific Market Y-o-Y Growth Projections By Application, 2023 to 2033

Figure 119: South Asia and Pacific Market Attractiveness Analysis By Application, 2023 to 2033

Figure 120: Middle East and Africa Share and BPS Analysis By Country, 2023 & 2033

Figure 121: Middle East and Africa Y-o-Y Growth Projections By Country, 2023 to 2033

Figure 122: Middle East and Africa Attractiveness Analysis By Country, 2023 to 2033

Figure 123: Middle East and Africa Market Share and BPS Analysis By Product Type– 2023 & 2033

Figure 124: Middle East and Africa Market Y-o-Y Growth Projections By Product Type, 2023 to 2033

Figure 125: Middle East and Africa Market Attractiveness Analysis By Product Type, 2023 to 2033

Figure 126: Middle East and Africa Market Share and BPS Analysis By Phase– 2023 & 2033

Figure 127: Middle East and Africa Market Y-o-Y Growth Projections By Phase, 2023 to 2033

Figure 128: Middle East and Africa Market Attractiveness Analysis By Phase, 2023 to 2033

Figure 129: Middle East and Africa Market Share and BPS Analysis By Application– 2023 & 2033

Figure 130: Middle East and Africa Market Y-o-Y Growth Projections By Application, 2023 to 2033

Figure 131: Middle East and Africa Market Attractiveness Analysis By Application, 2023 to 2033

Frequently Asked Questions

What was the overall size of the transformer tap changers and voltage control relay market in 2025?

The overall market size for the transformer tap changers and voltage control relay market was USD 1,611.2 Million in 2025.

How big is the transformer tap changers and voltage control relay market expected to be in 2035?

The transformer tap changers and voltage control relay market is expected to reach USD 2,502.1 Million in 2035.

What will drive the demand for the transformer tap changers and voltage control relay market during the forecast period?

Increasing demand for reliable and efficient power transmission and distribution systems, growth in renewable energy integration, advancements in smart grid technologies, and the need for improved voltage regulation and system stability will drive market growth.

List the top 5 countries contributing to the transformer tap changers and voltage control relay market.

The USA, China, India, Germany, and Japan are key contributors.

Which segment in application type is expected to lead in the transformer tap changers and voltage control relay market?

The utility power distribution segment is expected to lead due to the increasing demand for voltage regulation in power grids and the growing focus on enhancing grid reliability.

Explore Electrical & Heavy Machinery Insights

Future Market Insights

Transformer Tap Changers and Voltage Control Relay Market